Gene set-level network analysis using a toxicogenomics database
Naoki Kiyosawa
a,⁎
, Sunao Manabe
b, Atsushi Sanbuissho
a, Takashi Yamoto
aa
Medicinal Safety Research Laboratories, Daiichi Sankyo Co., Ltd., 717 Horikoshi, Fukuroi, Shizuoka 437-0065, Japan b
Global Project Management Department, Daiichi Sankyo Co., Ltd., 1-2-58 Hiromachi, Shinagawa, Tokyo 140-8710, Japan
a b s t r a c t
a r t i c l e i n f o
Article history:
Received 21 January 2010 Accepted 29 March 2010 Available online 2 April 2010 Keywords: Toxicogenomics Microarray Liver Biomarker Network Systems Biology
Toxicogenomics data sets on rat livers covering 118 compounds were subjected to inference of a gene set-level, not individual gene-set-level, network structure. Expression changing levels for 58 gene sets was used for network inference with a Gaussian graphical model algorithm. The established network contained reasonable relationships, such as ones between the blood glucose level and glycolysis-related genes or the blood transaminase level and cellular injury-related genes, indicating that the gene set-level network inference successfully highlighted biological pathway-level interactions. In addition, the robustness of the inferred network structure was investigated using microarray data on bromobenzene-treated rat livers, where the gene set-level activation exhibited time-dependent propagation through neighbored nodes (i.e. gene sets) on the network, indicating that the network structure was robust and comparable with an external microarray data set. Accumulating such robust gene sets with toxicity-associated subnetwork structures would lead to a better understanding of the molecular mechanisms of drug-elicited toxicities.
© 2010 Elsevier Inc. All rights reserved.
Introduction
Toxicogenomics (TGx), a comprehensive gene expression analysis together with a conventional toxicology data set such as blood chemistry, hematology, organ weights and histopathologicfindings, is a widely utilized scientific discipline for both basic and applied toxicology. In the drug development process, the application of TGx research is expected to be of use in both characterizing the molecular mechanisms of toxicities and in early evaluation of the toxic risk potential of drug candidate compounds [1]. In particular, the prediction of drug-elicited toxicity in the early stages of drug development is one of the most promising applications of TGx. It was estimated that a 10% improvement in predicting future developmental failure in the clinical phase would save 100 million dollars of R&D cost per drug [2]. A number of gene sets whose expression levels are closely associated with certain toxicological endpoints, namely ‘TGx biomarkers,’ have been reported [3] and would be useful for better evaluation of drug-elicited toxicities. On the other hand, public, private and commercial TGx databases have been developed[1]. Thus, the analytical infrastructures for TGx research have been maturing considerably.
Although bodies of TGx databases and biomarkers are growing rapidly, the compatibility of microarray data sets obtained from different studies has been questioned in a number of reports[4,5], a problem which will hinder efficient utilization of TGx databases and biomarkers. To address this issue, the MicroArray Quality Control (MAQC) consortium investigated the compatibility of toxicoge-nomic data sets for rat livers and concluded that microarray data sets are more comparable among different studies when the fold change values of the genes between chemical-treated and corresponding control groups are used, rather than individual signal data or statisticalP-values[6]. In addition, other reports suggested that it is beneficial to perform a gene set-level (or pathway-level) data analysis instead of an individual gene-level analysis when comparing microarray data obtained from different studies [7,8]. Collectively, when analyzing TGx data using multiple data sets obtained from different studies, it would be desirable to use fold change values focusing on certain gene sets, instead of individual genes.
Recently, we reported a scoring method called thedifferentially regulated gene score(D-score), which summarizes the overall gene expression changing levels focusing on a set of genes using both the fold change value and data quality information provided by MAS5 algorithm-analyzed GeneChip data[9]. This scoring method is very simple and consequently it is easy to interpret the biological and toxicological significance of the result. In addition, the D-score is thought to be more comparable among different microarray databases, since the score considers the expression ratio of a set of genes (or toxicogenomic biomarker), not individual genes, be-tween chemical-treated and vehicle-treated animals. The D-score
Abbreviations: PCC, partial correlation coefficient; BBz, bromobenzene; CHX, cycloheximide; TGx, toxicogenomics; TGP, Toxicogenomics Project in Japan; RN, relevance network; GGM, Gaussian graphical model; BN, Bayesian network; TG-GATEs, Toxicogenomics Project-Genomics Assisted Toxicity Evaluation system.
⁎Corresponding author. Fax: +81 538 42 4350.
E-mail address:[email protected](N. Kiyosawa). 0888-7543/$–see front matter © 2010 Elsevier Inc. All rights reserved. doi:10.1016/j.ygeno.2010.03.014
Genomics
has demonstrated its usefulness for efficient detection of drug-activated biological pathways[9]. However, it would be even more helpful for toxicologists if the biological significance suggested by the changes in D-scores was interpreted in a context of systems-level molecular dynamics, namely a ‘Systems Biology’-style data interpretation.
Systems Biology is an emerging discipline for understanding organisms in the terms of their biological systems level[10]and the application of Systems Biology to toxicological research is called
‘Systems Toxicology’ [11]. From a Systems Biology point of view, biological processes are examined in the framework of pathways or biological modules which consist of tens or hundreds of molecules, rather than a single or a few sets of molecules. Usually the biological interactions among the pathways are presented as a graph in which the nodes are bio-molecules (e.g. genes, proteins, metabolites or miRNAs) and the edges are functional relationships among the nodes (e.g. transcriptional/translational regulation, protein-protein interac-tion or metabolic reacinterac-tions)[12]. In particular, inference of a genetic regulatory network based on microarray data is one of the most preferred research targets, since it is not only useful for understanding the molecular mechanisms of biological events but may also lead to the discovery of novel diagnostic biomarkers in diseased conditions
[13]. While conventional research on genetic regulatory network analysis has been focused on individual genes[14–16], in the present study we hypothesized that a gene set-level network analysis would lead to establishment of more robust and comparable network structure that can be applicable to microarray data obtained from different studies. In addition, a retrospective network inference using a large-scale TGx database may give us information not only for well investigated pathway–pathway relationships but also for unknown relationships that may lead to the discovery of novel biomarkers for toxicity evaluation.
So far, a number of network inference algorithms have been utilized, such as relevance network (RN), a Gaussian graphical model (GGM) and Bayesian network (BN)[17]. Each algorithm has its own pros and cons: for example, RN implements pairwise comparison (e.g. Pearson's correlation coefficient) which is easy to compute, but RN cannot distinguish between direct and indirect interactions between nodes. On the other hand, the GGM algorithm considers a partial correlation coefficient (PCC), by which direct relationships between two nodes from indirect ones can be distinguished. According to a comparative analysis between GGM and RN algorithms, GGM demonstrated a more stable performance for network inference compared with RN[17]. On the other hand, a comparison between GGM and BN algorithms showed that there was insufficient evidence showing significant difference between the two algorithms when using observational (or“static”) data[17,18]where no interference experiments were performed. Based on this information, we hypoth-esized that a GGM algorithm would work sufficiently for an appropriate network structure when performing a retrospective network inference analysis using an observational TGx data set. In the present study, we inferred a gene set-level network structure with a GGM algorithm using the large-scale TGx database system (Toxicogenomics Project-Genomics Assisted Toxicity Evaluation sys-tem, TG-GATEs) developed by the government-industry collaborative research Toxicogenomics Project in Japan (TGP)[19]. The robustness of the established network structure was investigated using micro-array data obtained from outside TGP, namely GeneChip data on rat livers treated with either bromobenzene (BBz) or cycloheximide (CHX). The established network contained not only well-known relationships among gene sets or phenotypes but also contained ones whose biological significance is not intuitively clear. It was demon-strated that the microarray data on BBz- and CHX-treated rat livers showed good compatibility with the established network, indicating that the network structure inferred based on the TG-GATEs database is robust for an external microarray data set. This gene set-level
network inference analysis would lead to better toxicity profiling and may lead to the discovery of novel toxicity biomarkers.
Materials and methods
Development of TG-GATEs database system in TGP
All the animal studies as well as the GeneChip analysis were supervised and performed by TGP and all the TGx data were organized and stored in the TG-GATEs database system[19]. Thefirst author of this manuscript (NK) had been working as a member of TGP and contributed in part to the development of the TG-GATEs database system.
Animal studies in TGP
The names and dosage levels of the 118 chemicals used in the TGP
in vivo toxicity studies are summarized in Table 1, with detailed animal study information having been previously described [20]. Briefly, 6-week old male Sprague–Dawley rats (Charles River Japan, Inc., Kanagawa, Japan) withfive animals per group were used in the study. Although multiple dosage levels were tested in the TGP in-life toxicity studies, we used only the highest dosage group data in the present paper. In the single treatment study, the rats were sacrificed at 3, 6, 9 or 24 h after the treatment of chemical or vehicle. In the multiple treatment study, the rats were treated with either chemical or vehicle once daily for 4, 8, 15 or 29 days and were sacrificed at 24 h after the last treatment. The livers were removed at necropsy and soaked in RNALater (Ambion Inc., Austin, TX) to prevent RNA degradation. All the experimental protocols for the animal studies were reviewed and approved by the Ethics Review Committee for Animal Experimentation of the National Institute of Health Science.
GeneChip analysis in TGP
A detailed procedure for GeneChip analysis was previously reported[20]. Briefly, three liver samples out offive were used for the microarray analysis. Total RNA was isolated using an RNeasy Mini Kit with Bio Robot 3000 (Qiagen, Inc., Valencia, CA), and 5μg of the total RNA was used for cDNA synthesis using T7-(dT)24
oligonucle-otide primer (Affymetrix Inc., Santa Clara, CA) and SuperScript Choice System (Invitrogen, Carlsbad, CA). Biotin-labeled cRNA was synthe-sized using a BioArray High Yield RNA Transcription Labeling Kit (Enzo Diagnostics, Farmingdale, NY). The hybridization cocktail was prepared with 10μg of fragmented cRNA and hybridized to Rat 230 2.0 GeneChip array (Affymetrix, Inc.) at 45 °C for 18 h, followed by washing and staining by streptavidin-phycoerythrin using Fluidics Station 400 (Affymetrix, Inc.). The scanned image was analyzed with a MAS5 algorithm using GCOS software (Affymetrix, Inc.). All the MAS5-analyzed data were scaled by global normalization.
TGx data sets for network inference
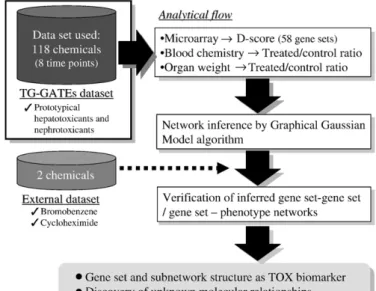
All the GeneChip data and phenotype data (i.e. blood chemistry, hematology, body weight and organ weight) used for gene set- and phenotype-level network inference were retrieved from the TG-GATEs database system (Fig. 1). Although the TG-GATEs system contains TGx data sets for 150 compounds, it also contains data sets for 17 proprietary chemicals provided by the participant pharmaceu-tical companies and those data were excluded from the analysis. In addition, data sets for 15 chemicals did not have complete data sets (i.e. 3 animals per group, 8 time points) for the highest dosage group, either because of an irregular study design or animal death before the scheduled necropsy time points. Consequently, the data sets for a total of 118 chemicals were used for network inference (Table 1). These 118 compounds have complete data sets for 8 time points (3, 6, 9 and 24 h for a single treatment study, and 4, 8, 15 and 29 day s for a repetitive treatment study).
Scoring drug-elicited toxicological effects on gene sets and phenotypes
Drug-elicited changes in gene expressions and phenotypes were evaluated by scoring their changing levels. The scores were calculated based on average data of each chemical-treated group (3 animals per group) and the calculated scores were subjected to network inference. A summarized analyticalflow is presented inFig. 1.
Scoring a gene set-level expression change
For evaluation of gene set-level expression changes, the D-score[9]
was calculated for a total of 58‘biomarker’gene sets (Table 2), all of which were selected based on gene annotation information provided by Affymetrix Inc. except for two biomarker gene sets whose expression levels are reported to be closely associated with non-genotoxic carcinogenesis[21]or glutathione depletion[22]. Detailed information for the 58 gene lists is provided inSupplementary Table 1. A detailed D-score calculation procedure is described in the previous paper [9]. Briefly, the signal log ratio (SLR, base 2) was calculated by dividing the mean signal value of the chemical-treated group by that of the corresponding vehicle-treated group, and the Presence ratio (PR) was determined by dividing the number of the Presence Call given for both chemical- and vehicle-treated by the total number of chemical-treated and vehicle-treated animals. For example, if all 3 of the chemical-treated animals gave Presence and all 3 of the vehicle-treated animals gave Absence Calls, respectively, the PR is calculated as (3+ 0)/(3 + 3) = 0.5. Assuming that agene set Xconsists ofiprobe sets (x1,x2,x3,…,xi−1,xi),
the calculated SLRs were given as (SLR1, SLR2, SLR3,…, SLRi−1, SLRi) and
PRs were given as (PR1, PR2, PR3, …, PRi−1, PRi). Let the sum of
(SLR1× PR1, SLR2× PR2, SLR3× PR3,…, SLRi−1× PRi−1, SLRi× PRi) divided
by i and the sum of ([SLR1× PR1]2, [SLR2× PR2]2, [SLR3× PR3]2, …,
[SLRi−1× PRi−1]2, [SLRi× PRi]2) divided by i be indexes for “overall
direction of the expression change per probe set”and for the“overall magnitude of the expression change per probe set”of theGene set X Table 1
Chemical information.
Name Abbreviation Dose (mg/kg)
Name Abbreviation
Allyl Alcohol AA 30 Ibuprofen IBU Acetamidofluorene AAF 1000
(300)
Imipramine IMI
Acarbose ACA 1000 Isoniazid INAH
Acetazolamide ACZ 600 Iproniazid IPA Ajmaline AJM 300 Ketoconazole KC
Amiodarone AM 200 Labetalol LBT
Amitriptyline AMT 150 Lomustine LS Naphthyl
isothiocyanate
ANIT 15 Hexachlorobenzene HCB Acetaminophen APAP 1000 Haloperidol HPL Allopurinol APL 150 Hydroxyzine HYZ
Aspirin ASA 450 Methyldopa MDP
Azathioprine AZP 30 Mefenamic Acid MEF Benzbromarone BBr 200 Mexiletine MEX Bromobenzene BBZ 300 Metformin MFM Bucetin BCT 2000 (1000) Methapyrilene MP Bendazac BDZ 1000 (300) Methyltestosterone MTS Bromoethanamine BEA 60 (20) Methimazole MTZ Benziodarone BZD 300 Moxisylyte MXS Caffeine CAF 100 Nitrofurantoin NFT Captopril CAP 1000 Nitrofurazone NFZ Carboplatin CBP 100 (10) Nicotinic acid NIC Carbamazepine CBZ 300 Nifedipine NIF Carbon tetrachloride CCL4 300 Nimesulide NIM Clofibrate CFB 300 Phenylanthranilic acid NPAA Chlorpheniramine CHL 30 Omeprazole OPZ Cimetidine CIM 1000 Papaverine PAP Chlormadinone CLM 2000
(1000)
Phenobarbital PB Cephalothin CLT 2000 Phenacetin PCT Coumarin CMA 150 Penicillamine PEN Chlormezanone CMN 500 Perhexiline PH Chloramphenicol CMP 1000 Phenylbutazone Phb Colchicine COL 15 (5) Phenytoin PHE Cyclophosphamide CPA 15 Pemoline PML Clomipramine CPM 100 Promethazine PMZ Chlorpropamide CPP 300 Propylthiouracil PTU Ciprofloxacin CPX 1000 Quinidine QND Cyclosporine A CSA 300
(100)
Ranitidine RAN Diclofenac DFNa 10 Rifampicin RIF
Diltiazem DIL 800 Sulpiride SLP
Disopyramide DIS 400 Sulfasalazine SS
Danazol DNZ 2000
(1000)
Simvastatin SST
Disulfiram DSF 600 Sulindac SUL
Dantrolene DTL 250 Thioacetamide TAA
Diazepam DZP 250 Tannic acid TAN
Ethambutol EBU 1000 Terbinafine TBF Ethinylestradiol EE 10 Tetracycline TC Erythromycin
ethylsuccinate
EME 1000 Ticlopidine TCP Enalapril ENA 600 Theophylline TEO
Ethionine ET 250 Tiopronin TIO
Ethanol ETN 4000 Tolbutamide TLB
Etoposide ETP 1000
(30)
Trimethadione TMD
Famotidine FAM 1000 Tamoxifen TMX
Fenofibrate FFB 1000 Triamterene TRI Fluphenazine FP 20 Thioridazine TRZ
Flutamide FT 150 Triazolam TZM
Furosemide FUR 300 Vitamin A VA
Glibenclamide GBC 1000 Vancomycin VMC Griseofulvin GF 1000 Valproic Acid VPA
Gentamicin GMC 100 Wy-14643 WY
Parenthesis: dose level in repetitive treatment study.
Fig. 1.Overview of network inference. The major objective of the present study was to develop a gene set- and phenotype-level network based on TG-GATEs, a large-scale toxicogenomics database developed by the government–industry collaborative Toxicogenomics project in Japan (TGP). Both microarray and phenotype (i.e. blood chemistry, hematology, body weight and organ weight) data for rats treated with one of 118 chemicals with 8 time observational points were used in the present study. The gene expression change level was evaluated by calculating the D-score using 58 gene lists (Table2), followed byz-score transformation. The phenotype changing level was evaluated by the change ratio between chemical-treated and vehicle-treated rats, followed by z-score transformation. The gene set- and phenotype-level network was inferred using a Gaussian graphical model (GGM) algorithm. The robustness of the established network structure was investigated using microarray data on rat livers treated with either bromobenzene or cycloheximide obtained outside TGP.
genes, respectively. The D-score is calculated by multiplying the two indexes shown above by a ×100 scaling factor. The calculated D-scores were then transformed into z-scores by the following equation:
Z=ðX−μÞ=σ
whereXis the raw D-score,μis the mean of the D-score for all the chemicals andσis the standard deviation of the D-score for all the chemicals.
Table 2
Summary of gene list.
Node name Number of probe sets
Description ABC_transporter 50 ABC transporter family Akr 20 Aldo-keto reductase family
AP1 11 Components of AP1 complex
Bcl 21 Mitochondrial apoptosis and BCL2-related genes
Caspase 19 Caspase family
Cebp 9 CCAAT/enhancer binding protein family
Cell_proliferation 22 Cell prolifiration-related genes
Chemokine 61 Chemokines
Cholesterol_synthesis 19 Genes involved in cholesterol synthesis
Cyclin 35 Cyclin family
Cyp1a1 3 Cyp1a1 and aryl hydrocarbon receptor (AhR) genes
Cyp1a2 1 Cyp1a2 gene
Cyp1b1 1 Cyp1b1 gene
Cyp2b 5 Nuclear receptor CAR and Cyp2b family genes
Cyp2c 7 Cyp2c family genes
Cyp3a 5 Nucelar receptor PXR and Cyp3a family genes
Cyp4a 5 Cyp4a family genes
DNA_damage 10 DNA damage-responsive genes ER_stress 3 Endoplasmic reticulum
stress-responsive proteins Fgf 38 Fibroblast growth factor genes Glutathione_homeostasis 11 Genes related with glutathione
synthesis and reduction Glycolysis 46 Genes involved in glycolysis Gst 19 Glutathione S-transferase family Hemoglobin 9 Hemoglobin genes
Hsp 41 Heat shock protein genes
Hypoxia 6 Genes associated with hypoxia Igf 30 Insulin-like growth factor genes IL_receptor 33 Interleukin receptor genes Inflammation 19 Inflammation-related genes Interleukin 29 Interleukin genes
Ketone_body 5 Genes involved in ketone body metabolism
LXR 16 Genes regulated by nuclear receptor LXR
Misc_GF 28 Miscellaneous growth factors MMP 30 Matirx metalloprotease genes Mt_electron 40 Genes related with mitochondrial
electron transport
Mt_genome 5 Genes encoded by mitochondrial genome
Mt_ribosome 101 Genes encoding mitochondrial ribosomes
NFkB 15 NF-kappa B-related genes Organic_cation_transporter 11 Organic cation transporter genes Oxidative_stress 20 Genes associated with oxidative
stress
PDGF 9 Platelet derived growth factor-related genes
Phorone_GSH_depletion 161 Glutathione depletion-responsivve genes
PP 43 Peroxisome-localized proteins PPAR 5 Peroxisome proliferator activated
receptor family
Proteasome 61 Genes related with proteasome component
Ribosome 125 Ribosomal genes
Slc 334 Solute carrier family
Slco 19 Solute carrier organic anion transporter family
Stellate 6 Genes associated with stellate cell activation
Steroid_hormone 11 Genes related with steroid hormone synthesis / metabolism
Sterol_related 67 Genes related with steroid metabolism
TGF 17 Transforming growth factor (TGF) genes
Table 2(continued)
Node name Number of probe sets
Description
TGF_b 43 TGF beta signaling-associated genes TNF 10 Tumor necrosis factor-related genes Carcinogenesis 112 Genes associated with non-genotoxic
carcinogenesis
Ubiquitin 230 Genes related with ubiquitin conjugation
Ugt 10 UDP glucuronosyltransferase family Vegf 4 Vascular endothelial growth factor
genes
Table 3
Summary of the phenotype information.
Node name Description
Organ/body weight
TERMINAL_BW Terminal body weight
LIVER_WT Liver weight
KIDNEY_TOTAL_WT Total kidney weight KIDNEY_R_WT Relative right kidney weight KIDNEY_L_WT Relative left kidney weight LIVER_WT_PER_BW Relative liver weight KIDNEY_TOTAL_WT_PER_BW Relative total kidney weight KIDNEY_R_WT_PER_BW Relative right kidney weight KIDNEY_L_WT_PER_BW Relative left kidney weight Hematology
RBC Red blood cell count
Hb Hemoglobin
Ht Haematocrit
MCV Mean corpuscular volume
MCH Mean corpuscular hemoglobin
MCHC Mean corpuscular hemoglobin concentration
Ret Reticulocytes
Plat Platelet
WBC White blood cell
Neu Neutrophil
Mono Monocytes
Lym Lymphocytes
PT Prothrombin time
APTT Activated partial thromboplastin time
Fbg Fibrinogen
Blood chemistry
ALP Alkaline phosphatase
TC Total cholesterol
TG Triglycerides
PL Phospholipids
GLC Glucose
BUN Blood urea nitrogen
CRE Creatinine Na Sodium K Potassium Cl Chloride Ca Calcium IP Inorganic phosphorous TP Total protein
RALB Rat albumin
A_G Albumin/globulin ratio
AST Aspartate aminotransferase ALT Alanine aminotransferase
Fig. 2.Correlation among gene sets and phenotypes. (A) Heat map presentation of gene set- and phenotype-level scores. D-score and changing ratio values between chemical-treated and vehicle-chemical-treated rats were calculated for gene set and phenotype data, respectively, and were rank-ordered. Black and white in the heat map indicate that the rank order is close to 1 and 944, respectively. Descriptions of the labels for each column can be found in Tables2 and 3. (B) Frequency distribution of partial correlation coefficients (PCC) between nodes. A total of 335 edges whose |PCC|N0.065 satisfied a false discovery ratioq-value less than 0.01, and these edges were used for network analysis.
Scoring a phenotype-level change
A total of 42 phenotype data sets (18 blood chemistry data sets, 15 hematology data sets, and 9 of body and organ weight data sets) were subjected to network inference (Table 3). For evaluation of the phenotype-level changes, the changing ratio value was calculated by dividing the mean of the chemical-treated group by that of the corresponding vehicle-treated group, followed by transformation into a z-score.
Network inference
The gene set- and phenotype-level network structure was inferred using GeneNet software[23]implemented on the statistics software R (CRNA project) [24]. A GeneNet package was obtained from the Bioconductor project website (http://www.bioconductor.org/)[25]. A time-course D-score data set of each chemical-treated group using 58 biomarker gene sets was prepared using a‘longitudinal package’
(http://cran.r-project.org/web/packages/longitudinal/), and a ggm. estimate.pcor() function provided in the GeneNet package (http:// cran.r-project.org/web/packages/GeneNet/) was implemented for network inference by the GGM algorithm. The statistical significance of each edge between nodes (i.e. gene set and phenotypes) was estimated by ggm.test.edges() function provided in the GeneNet package, where the false discovery rate (q-value) of PCC is calculated for each edge. In the present study, edges with aq-valueb0.01 were considered significant and were used for further analysis. Cytoscape
Fig. 3.Network inferred based on TG-GATEs database. Gene set- and phenotype (blood chemistry, hematology, body weight and organ weight)-level changes were evaluated on toxicogenomics data sets for rats treated with one of the 118 chemicals (8 time points) by calculating thez-scored D-score andz-scored changing ratio between chemical-treated and vehicle-treated rats, respectively. Relationships among the gene sets and phenotype data were evaluated by a partial correlation coefficient (PCC) using a Gaussian graphical model algorithm and the edges with statistically significant PCC were used for drawing the network using Cytoscape software. Edges with purple and green indicate positive and negative relationships, respectively.
Fig. 4.Mean number of edges per node. Number of edges per node for blood chemistry and hematology (N= 33), body and organ weights (N= 9) and gene set (N= 58) are presented. Gene set showed significantly (Pb0.05 by a one-way ANOVA followed by a Tukey's post hoc test) greater number of edges per node compared with blood chemistry and hematology.
software[26]was utilized to visualize the network using the PCC value given for each edge.
Verification of the inferred network structure
To investigate if the inferred network structure established based on the TG-GATEs database could be applicable to external micro-array data sets, we prepared micromicro-array data of bromobenzene (BBz) or cycloheximide (CHX)-treated rat livers and D-scores for 58 gene sets were calculated. The D-scores for a total of 31 gene sets exhibiting either greater than 20 or less than−20 for at least one data set in the BBz- or CHX-treated groups were subjected to the following analysis.
Animal studies for BBz and CHX treatments
BBz and CHX were purchased from Sigma Aldrich (St. Louis, MO, USA) and 9-week-old male F344/DuCrj rats (Charles River Japan Inc., Yokohama, Japan) were used for the studies. For the BBz treatment, animal groups consisting of four rats were intraperitoneally admin-istered with BBz (300 mg /kg body weight per day) or corn oil as a vehicle control. The animals were killed under ether anesthesia at 2, 6, 12 and 24 h after the BBz treatment and the liver samples were snap-frozen and stored at−80 °C until use. For the CHX treatment, the liver samples were obtained 1 h, 2 h and 6 h after the intravenous treatment of CHX (6 mg/kg body weight). Detailed information on the CHX animal study is described in the previous report [27]. The experimental protocols for these studies were approved by the Ethics Review Committee for Animal Experimentation of Daiichi Sankyo Co., Ltd.
GeneChip analysis for BBz- or CHX-treated rat livers
For both the BBz and CHX treatment studies, the liver samples were homogenized with the RLT buffer supplied in the RNeasy Mini Kit (Qiagen, Valencia, CA, USA) and the total RNA was isolated according to the manufacturer's instructions. A hybridization cocktail was
prepared with 15μg of fragmented cRNA and hybridized to Rat 230 2.0 GeneChip array (Affymetrix, Inc.) at 45 °C for 18 h, followed by washing and staining with streptavidin-phycoerythrin using a Fluidics Station 400 (Affymetrix, Inc.). Microarray image data were analyzed with the MAS5 algorithm (Affymetrix Inc., Santa Clara, CA, USA). All the MAS5-analyzed data were scaled by global normalization.
Statistical analysis
The number of edges per node for blood chemistry/hematology (N= 33), organ/body weight (N= 9) and gene set (N= 58) calculated by GeneNet software was subjected to a one-way ANOVA followed by a Tukey's post hoc test using GraphPad Prism 4 (GraphPad Software, La Jolla, CA), and Pb0.05 was considered statistically significant.
Results
General profile of the established gene set-level network
All the PCC values between nodes are presented inSupplementary Table 2. Representative gene set–phenotype relationships which exhibited high PCC, such as the ones betweenPDGFgene and ALT (PCC = 0.124),Glycolysisgenes and GLC (PCC = 0.108), orGstgenes and relative liver weight (PCC = 0.114), are presented as a heat map inFig. 2A. The distribution of PCC values for all the gene set- and phenotype-level relationships is presented inFig. 2B and a total of 335 relationships (edges) out of 4950 showed statistically significant PCC values (estimated with a False Discovery Rateq-valueb0.01). All the nodes (i.e. 58 gene sets plus 42 phenotypes) with the 335 statistically significant edges are presented as a network graph inFig. 3, where positive and negative relationships are colored purple and green, respectively. Next, the number of edges per node was investigated for blood chemistry, hematology, body weight, organ weights and gene set, and it was revealed that the number of edges per node was
Fig. 5.Representative interactions. (A) Glucose-centered network. Blood glucose level (GLC) and itsfirst neighbor nodes were highlighted from the whole network presented in Fig. 3. Numbers on the edges represent partial correlation coefficients between nodes. Positive and negative correlations between nodes are colored as purple and green, respectively. (B) LDH-centered network. (C) Relative liver weight-centered network.
significantly higher in gene sets compared with blood chemistry and hematology (Fig. 4).
Biological significance of the established network
As examples of gene set–phenotype relationships, GLC, LDH and relative liver weight-centered subnetworks with their 1st neighbored nodes are highlighted in Fig. 5. GLC showed the strongest direct positive correlation withGlycolysisgenes (PCC = 0.108) and direct negative correlation withCholesterol synthesisgenes (PCC =−0.074) (Fig. 5A). GLC also showed direct correlation with PPAR genes (PCC = 0.080), IP (PCC = 0.066) and BUN (PCC = 0.081). On the other hand, LDH showed high direct positive correlations with AST and ALT (PCC = 0.181 and 0.079, respectively) (Fig. 5B). In addition, LDH showed a couple of strong correlations with gene sets such as
Chemokinegenes (PCC = 0.188),Bclgenes (PCC = 0.110) andInfl am-mation genes (PCC = 0.087). Regarding relative liver weight, the following reasonable relationships were observed: strong positive and negative relationships with liver weight (LIVER_WT, PCC = 0.407) and terminal body weight (TERMINAL_BW, PCC = -0.096), respectively (Fig. 5C). In addition, the relative liver
weight showed positive correlations with Gst and LXR genes (PCC = 0.114 and 0.093, respectively), and negative correlation with
Interleukingenes (PCC = -0.068).
Verification of D-score network with data sets from outside TG-GATEs
To verify the robustness of the network structure inferred based on TG-GATEs, we investigated time-course gene expression profiles on rat livers treated with CHX or BBz. First, D-scores for CHX- or BBz-treated rats using 58 gene sets were obtained and the gene sets whose D-scores were greater than 20 or smaller than−20 for at least at one time point were selected and subjected to further analysis. Thirty-one gene sets were selected in this process, and were re-organized as a subnetwork (Figs. 6 and 7). All the D-scores for BBz- or CHX-treated rats are presented inSupplementary Table 3.
BBz-treated rat liver
The time-course of the D-score profile for the BBz-treated rat liver is presented inFig. 6. The D-score forDNA damagegenes was
first increased at 2 h after the treatment. At 6 h, D-scores for
Glutathione depletionandOxidative stressgenes were increased, and
Fig. 6.Time-course of D-score profile for bromobenzene-treated rat liver. Rats were treated with 300 mg/kg bromobenzene, the livers were collected at 2, 6, 12 or 24 h after the treatment, and GeneChip analysis was conducted. Red and blue colors indicate high and low D-scores for the gene sets, respectively. At 2 h, the D-score forDNA damagegenes was increased, indicating that the genes associated with DNA damage were overall up-regulated at this time point. At 6 h, D-scores forPhorone glutathione depletionandOxidative stress were increased, and those forCyp1a1andCyp2bgenes were increased as well. At 12 h, the increased D-scores forHSP,Carcinogenesis,Glutathione homeostasis,ER stressandAP1genes were observed, suggesting that the increased D-score forDNA damagegenes triggered at 2 h affected its neighbored nodes and the area of activated nodes was propagated. In addition, the increase in the D-scores forCyp1a1andCyp2bgenes disappeared at 12 h, and instead those forAkrandGstgenes, which arefirst neighbors ofCyp1a1andCyp2bgenes, respectively, were increased at 12 h. Furthermore, the D-score forCholesterol synthesisgenes was decreased, which has a negative correlation withDNA damagegenes. At 24 h, the D-scores forCebpandNfkBgenes were increased and those forLXRandSlcogenes were decreased. Overall, the established network inferred based on the TG-GATEs data set was well applicable to microarray data on BBz-treated rat liver which was obtained from outside TGP.
those forCyp1a1andCyp2bincreased as well. At 12 h, the D-scores for HSP,Carcinogenesis,Glutathione homeostasis, ER stress and AP1
genes were increased, suggesting that the increase in the D-score for
DNA damagegenes triggered at 2 h affected its neighbored nodes and the activation of the neighbored gene sets propagated sequentially. In addition, the increased D-scores for Cyp1a1 and
Cyp2bgenes disappear at 12 h, but instead the D-scores forAkrand
Gst genes, which are first neighbors ofCyp1a1 and Cyp2b genes, respectively, were increased at 12 h. Furthermore, a decreased D-score was observed for Cholesterol synthesis genes, which has a negative correlation with DNA damage genes that showed an increased D-score as early as at 2 h. Eventually, at 24 h, D-scores forCebpandNfkBgenes were increased and those forLXRandSlco
genes were decreased.
CHX-treated rat liver
The time-course of D-score profile for the CHX-treated rat liver is presented inFig. 7. A number of gene sets showed an increased D-score at 1 h after the treatment, such as ER stress, DNA damage,
Carcinogenesis,AP1,Cholesterol synthesis,InterleukinandGlutathione depletiongenes. At 2 h, increased D-scores were observed forCebp -andNFkBgenes, which are adjacent toER stress- andAP1genes on the network, and a decreased D-score was observed forCyp1a2gene. At 6 h, the area of increased D-scores was propagated as far asIL receptor
andCaspasegenes on the network. In addition, a decreased D-score
was observed forCyp2bgene, which is adjacent toCyp1a2gene which showed decreased D-score at 6 h.
Discussion
Network inference based on gene set-level data, not individual gene-level data, was utilized in the present study. At least two advantages are expected by conducting a gene set-level network analysis. First, it is reported that a gene set-level (or biological pathway-level) analysis is usually more robust and comparable for microarray data sets obtained from different studies[7,8]. Second, a GGM algorithm, used for network structure inference in the present study, would work better by reducing the number of inputs for calculation by grouping a set of genes from a microarray data set because when using a GGM algorithm the number of samples N
should be large enough compared with the number of variablesp(e.g. expression level data for individual genes), which is one of the serious problems when handling microarray data where tens of thousands of pieces of gene expression data are obtained at a time. While a number of studies have tried to avoid the p≫N problem when analyzing microarray data[28,29], gene set-level analysis can circumvent this issue because the number of D-score-summarized data (p= 58 in this study) is considerably smaller than the number of samples (N= 118 chemicals × 8 time points = 944 in this study). Thus, gene set-level network inference has clear advantages in terms of both data
Fig. 7.Time-course of D-score profile for cycloheximide-treated rat liver. Rats were intravenously treated with 6 mg/kg bromobenzene, the livers were collected at 1, 2 or 6 h after the treatment, and GeneChip analysis was conducted. At 1 h after the treatment, increased D-scores were observed forER stress,DNA damage,Carcinogenesis,AP1,Cholesterol synthesis,InterleukinandGlutathione depletiongenes, followed byCebp- andNFkBgenes at 2 h, which are adjacent toER stress- andAP1genes on the network. At 6 h, the area of increased D-scores was propagated as far asIL receptorandCaspasegenes on the network. Again, the established network inferred based on the TG-GATEs data set were well applicable to microarray data on CHX-treated rat livers which were obtained from outside TGP.
compatibility and appropriate network inference when handling large-scale microarray data sets.
The inferred network presented inFig. 3possessed a couple of interesting characteristics. First, the number of edges per node indicated that the nodes of the gene sets had a greater number of edges compared with those for blood chemistry and hematology (Fig. 4), suggesting that the gene expression was more actively regulated compared with the blood chemistry and hematology parameters, and that gene expression analysis may give us more clues into the mechanisms of drug-elicited toxicity. Second, the established network exhibited a number of reasonable biological relationships between nodes. For example, blood glucose level (GLC) showed the strongest correlation withGlycolysisgenes (Fig. 5A). In addition, GLC showed strong correlation withPPARαgenes, which is supported by a previous study reporting that PPARαregulates glycolytic gene expression[30]. On the other hand, LDH showed strong correlation with AST and ALT (Fig. 5B), all of which indicate the incidence of drug-elicited liver cell injury. As well, LDH showed correlations with infl ammation-associ-ated gene sets such as AP1, Inflammation and Chemokine genes, suggesting close relationships between cell injury and inflammatory response in the liver. Furthermore, LDH andBclgenes showed a direct relationship with each other, for which the biological significance is supported by previous studies showing that Bcl genes are associated with either a pro- or an anti-apoptotic reaction accompanied by incidences of cell injury[31]. Collectively, these results demonstrate that the gene set- and phenotype-level network analysis performed in the present study successfully extracted meaningful biological relationships from complicated TGx data sets. On the other hand, the biological significance of some of the relationships, such as ones between GLC and BUN, GLC and IP (Fig. 5A), relative liver weight and
Gstgenes or relative liver weight andLXRgenes (Fig. 5C), was not intuitively clear and these relationships might be less relevant in terms of toxicology. However, because these relationships were suggested based on large-scale TGx data sets, it is worth the effort to investigate them. This may lead to a better understanding of the molecular mechanisms of toxicity and in turn to the discovery of novel toxicity-associated biomarkers, as suggested in a previous report[32]. Although TGx research is thought to be quite useful for evaluating the molecular mechanisms of toxicities, the compatibility of the microarray data sets among sets obtained from different studies has been questioned in a number of reports[4,5]and this problem may
flaw the efficient utilization of the TGx database and biomarkers. To address the robustness of the established network structure in the present study, we investigated the compatibility of microarray data on rat livers treated with either BBz or CHX that were obtained outside TGP. BBz and CHX are reported to cause liver cell injury through distinct molecular mechanisms: when overdosed BBz causes centri-lobular necrosis in the hepatocytes through the generation of reactive metabolites [33], and CHX causes apoptosis in the hepatocytes, possibly mediated through ER stress[27].
In the BBz-treated rat liver, the D-score forDNA damage genes showed an increase at 2 h after the treatment and that forOxidative stressgenes showed a slight increase at this time point (Fig. 6). At 6 h, the D-score forPhorone GSH depletiongenes, which are afirst neighbor node for both DNA damage and Oxidative stress genes, showed a marked increase, and those forCyp1a1and Cyp2bgenes showed a tentative increase, while that ofCholesterol metabolismgenes showed a marked decrease. These activated nodes are indicative of the generation of reactive metabolites in the liver and consequent oxidative stress and glutathione depletion at 6 h. At 12 h, the area of high-D-score nodes propagated toGlutathione homeostasis,Akr,ER stress,AP1 and Gstgenes, all of which suggest a response against oxidative stress and dysfunction of cellular macromolecule turnover. On the other hand, the D-score forLXRgenes showed a decrease at 12 h. Eventually, at 24 h the area of the increased D-score was extended as far asCebpandNFkBgenes on the network, which are
associated with tissue repair and stress response, respectively. On the other hand, at 24 h, the area of decreased D-score extended toSlco,
Ketone bodyandGlycolysisgenes, which are the nearest neighbors of
LXRgenes, whose D-score was decreased at 12 h. It should be noted that most of the time-course increases and decreases in the D-scores were propagated through positively correlated nodes, such as the ones between DNA damage and Phorone GSH depletion genes (increased D-score) or the one betweenLXRandSlco(decreased D-score). In addition, the signs of the D-score forDNA damage and
Cholesterol synthesisgenes (2–24 h) orOxidative stressandIgfgenes (24 h) were opposite, which is reasonable considering that they have negative relationships with each other. These results indicate that the established network structure based on the TG-GATEs data set was robust enough to be comparable with the microarray data on BBz-treated rat liver obtained outside TGP, even though the strain and age of the rats used in the in-life studies were different from those used in the TGP studies.
In the CHX-treated rats, the D-scores for a number of gene sets were increased as early as at 1 h after the treatment (Fig. 7). Similar to the BBz study, the time-course changing profile of the D-scores showed sequential propagation through neighbored nodes on the network. This result further supports the notion that the gene sets as well as the established gene set-level subnetwork highlighted inFigs. 6 and 7would be useful biomarkers for evaluating BBz- and CHX-induced molecular mechanisms of toxicities. Accumulation of such toxicity-associated gene set-level subnetwork would aid efficient profiling of TGx data set and may lead to identification novel biomarker candidates.
Although the network inference using gene set- and phenotype-level data appeared to work well in the present study, a number of points should be considered to refine the analytical system. First, in the present study, the gene set- and phenotype-level network was inferred based only on passively observed TGx data sets and therefore the network inference was totally retrospective. According to a previous study, it was demonstrated that the BN algorithm out-performed GGM and RN when using an interventional data set[17]
and therefore BN could infer a better network structure if an appropriate interventional data set were prepared. However, it is difficult to prepare interventional data sets for gene set-level analysis compared with single gene-level analysis, since it is not easy to exclude the total effects of a set of genes when a single gene can be knocked down, completely excluding its effect. Nonetheless, the structure of a gene set-level network will be more sophisticated if a set of appropriate interventional data sets can somehow be prepared. Second, an appropriate study design for collecting the TGx data set will be a crucial factor for network inference. A high dose chemical exposure elicits a mixed response of primary, secondary and more downstream reactions in the body and therefore finding the appropriate dosage level and time points for sample collection by dissecting such complicated biological reactions will be crucial for better network inference.
Third, the gene set used for profiling the activities of biological pathways is tissue- and species-specific and therefore needs to be prepared and optimized case by case. It must be emphasized that the gene set-level network established in the present study is valid only for microarray data on rat livers but not for any data collected from other organs (e.g. kidney, muscle, adrenal grand, etc.) or other species (e.g. mice, dogs, monkeys, humans, etc.). We need to establishfi t-to-purpose gene sets for appropriate network inference to better utilize the TGx data sets for toxicity evaluation. In other words, comparative analysis on species-specific network structures may give us new insight into species differences in drug-elicited toxicities.
Finally, refinement of the scoring algorithms will dramatically affect the network structure. Although the D-score can capture the general tendency of gene expression changing direction and the changing level of a gene set [9], the calculated score is highly
opportunities to reveal novel interactions between gene sets and phenotypes.
In conclusion, we established a gene set- and phenotype-level relational network using TG-GATEs, a large-scale TGx database. The subnetwork structure associated with BBz- and CHX-induced toxi-cities appears to be robust between TG-GATEs and outside data sets. Accumulation of such robust gene sets with toxicity-associated subnetwork structures supported by verification data sets will not only be useful for efficient toxicity characterization using TGx data but will also be helpful for discovering unknown relationships among gene sets, which may lead to a better understanding of the molecular mechanisms of drug-elicited toxicities. For the establishment of a better biological network model, improvement of the computational algorithms and biomarker gene sets as well as the database quality should be continued.
Conflict of interest statement
The authors declare that there are no conflicts of interest. Acknowledgments
The authors appreciate all the efforts by Noriyo Niino, Kyoko Watanabe, Shusuke Yamauchi and Makoto Tomida for their excellent technical assistance, and Dr. Kazumi Ito for his helpful discussions. As well, the authors truly appreciate Drs. Taku Nagao, Yasuo Ohno, Tetsuro Urushidani, Toshikazu Miyagishima, Atsushi Ono, Hiroshi Yamada, and all the TGP members for their devotion to the development of the TG-GATEs database system. The TGP research was supported in part by a grant from the Ministry of Health, Labor and Welfare (H14-Toxico-001).
Appendix A. Supplementary data
Supplementary data associated with this article can be found, in the online version, atdoi:10.1016/j.ygeno.2010.03.014.
References
[1] D.R. Boverhof, T.R. Zacharewski, Toxicogenomics in risk assessment: applications and needs, Toxicol. Sci. 89 (2006) 352–360.
[2] US Food and Drug Administration, Innovation or stagnation? Challenge and opportunity on the critical path to new medicinal products, 2004.
[3] N. Kiyosawa, Y. Ando, S. Manabe, T. Yamoto, Toxicogenomic biomarkers for liver toxicity, J. Toxicol. Pathol. 22 (2009) 35–52.
[4] N. Mah, A. Thelin, T. Lu, S. Nikolaus, T. Kuhbacher, Y. Gurbuz, H. Eickhoff, G. Kloppel, H. Lehrach, B. Mellgard, C.M. Costello, S. Schreiber, A comparison of oligonucleotide and cDNA-based microarray systems, Physiol. Genomics 16 (2004) 361–370.
[5] M. Severgnini, S. Bicciato, E. Mangano, F. Scarlatti, A. Mezzelani, M. Mattioli, R. Ghidoni, C. Peano, R. Bonnal, F. Viti, L. Milanesi, G. De Bellis, C. Battaglia, Strategies for comparing gene expression profiles from different microarray platforms: application to a case-control experiment, Anal. Biochem. 353 (2006) 43–56. [6] L. Guo, E.K. Lobenhofer, C. Wang, R. Shippy, S.C. Harris, L. Zhang, N. Mei, T. Chen, D.
Herman, F.M. Goodsaid, P. Hurban, K.L. Phillips, J. Xu, X. Deng, Y.A. Sun, W. Tong, Y.P. Dragan, L. Shi, Rat toxicogenomic study reveals analytical consistency across microarray platforms, Nat. Biotechnol. 24 (2006) 1162–1169.
[7] R.G. Ulrich, J.C. Rockett, G.G. Gibson, S.D. Pettit, Overview of an interlaboratory collaboration on evaluating the effects of model hepatotoxicants on hepatic gene expression, Environ. Health Perspect. 112 (2004) 423–427.
[8] T. Manoli, N. Gretz, H.J. Grone, M. Kenzelmann, R. Eils, B. Brors, Group testing for pathway analysis improves comparability of different microarray datasets, Bioinformatics 22 (2006) 2500–2506.
188 (2009) 91–97.
[10] H. Kitano, Looking beyond the details: a rise in system-oriented approaches in genetics and molecular biology, Curr. Genet. 41 (2002) 1–10.
[11] M.D. Waters, J.M. Fostel, Toxicogenomics and systems toxicology: aims and prospects, Nat. Rev. Genet. 5 (2004) 936–948.
[12] J.D. Han, Understanding biological functions through molecular networks, Cell Res 18 (2008) 224–237.
[13] M. Benson, R. Breitling, Network theory to understand microarray studies of complex diseases, Curr. Mol. Med. 6 (2006) 695–701.
[14] G. Sanguinetti, M. Rattray, N.D. Lawrence, A probabilistic dynamical model for quantitative inference of the regulatory mechanism of transcription, Bioinfor-matics 22 (2006) 1753–1759.
[15] A. Djebbari, J. Quackenbush, Seeded Bayesian networks: constructing genetic networks from microarray data, BMC Syst. Biol. 2 (2008) 57.
[16] Y. Ko, C. Zhai, S. Rodriguez-Zas, Inference of gene pathways using mixture Bayesian networks, BMC Syst. Biol. 3 (2009) 54.
[17] M. Crzegorczyk, D. Husmeier, A.V. Werhli, Reverse engineering gene regulatory networks with various machine learning methods, in: F. Emmert-Streib, M. Dehmer (Eds.), Analysis of Microarray Data—A Network Approach, WILEY-VCH Verlag GmbH & Co. KGaA, Weinheim, 2008.
[18] A.V. Werhli, M. Grzegorczyk, D. Husmeier, Comparative evaluation of reverse engineering gene regulatory networks with relevance networks, graphical Gaussian models and Bayesian networks, Bioinformatics 22 (2006) 2523–2531. [19] T. Urushidani, Prediction of hepatotoxicity based on the toxicogenomics database,
in: S. Sahu (Ed.), Hepatotoxicity from Genomics to In Vitro and In Vivo Models, Wiley & Sons, 2007, pp. 507–529.
[20] K. Takashima, Y. Mizukawa, K. Morishita, M. Okuyama, T. Kasahara, N. Toritsuka, T. Miyagishima, T. Nagao, T. Urushidani, Effect of the difference in vehicles on gene expression in the rat liver—analysis of the control data in the Toxicogenomics Project Database, Life Sci. 78 (2006) 2787–2796.
[21] T. Uehara, M. Hirode, A. Ono, N. Kiyosawa, K. Omura, T. Shimizu, Y. Mizukawa, T. Miyagishima, T. Nagao, T. Urushidani, A toxicogenomics approach for early assessment of potential non-genotoxic hepatocarcinogenicity of chemicals in rats, Toxicology 250 (2008) 15–26.
[22] N. Kiyosawa, T. Uehara, W. Gao, K. Omura, M. Hirode, T. Shimizu, Y. Mizukawa, A. Ono, T. Miyagishima, T. Nagao, T. Urushidani, Identification of glutathione depletionresponsive genes using phorone-treated rat liver, J. Toxicol. Sci. 32 (2007) 469–486.
[23] R. Opgen-Rhein, K. Strimmer, From correlation to causation networks: a simple approximate learning algorithm and its application to high-dimensional plant gene expression data, BMC Syst. Biol. 1 (2007) 37.
[24] R Development Core Team, R, A Language and Environment for Statistical Computing., Vienna, Austria, 2005.
[25] R.C. Gentleman, V.J. Carey, D.M. Bates, B. Bolstad, M. Dettling, S. Dudoit, B. Ellis, L. Gautier, Y. Ge, J. Gentry, K. Hornik, T. Hothorn, W. Huber, S. Iacus, R. Irizarry, F. Leisch, C. Li, M. Maechler, A.J. Rossini, G. Sawitzki, C. Smith, G. Smyth, L. Tierney, J.Y. Yang, J. Zhang, Bioconductor: open software development for computational biology and bioinformatics, Genome Biol 5 (2004) R80.
[26] P. Shannon, A. Markiel, O. Ozier, N.S. Baliga, J.T. Wang, D. Ramage, N. Amin, B. Schwikowski, T. Ideker, Cytoscape: a software environment for integrated models of biomolecular interaction networks, Genome Res 13 (2003) 2498–2504. [27] K. Ito, N. Kiyosawa, K. Kumagai, S. Manabe, N. Matsunuma, T. Yamoto, Molecular
mechanism investigation of cycloheximide-induced hepatocyte apoptosis in rat livers by morphological and microarray analysis, Toxicology 219 (2006) 175–186. [28] J. Schafer, K. Strimmer, An empirical Bayes approach to inferring large-scale gene
association networks, Bioinformatics 21 (2005) 754–764.
[29] H. Li, J. Gui, Gradient directed regularization for sparse Gaussian concentration graphs, with applications to inference of genetic networks, Biostatistics 7 (2006) 302–317.
[30] J. Xu, V. Chang, S.B. Joseph, C. Trujillo, S. Bassilian, M.F. Saad, W.N. Lee, I.J. Kurland, Peroxisomal proliferator-activated receptor alpha deficiency diminishes insulin-responsiveness of gluconeogenic/glycolytic/pentose gene expression and sub-strate cycleflux, Endocrinology 145 (2004) 1087–1095.
[31] G.E. Kass, Mitochondrial involvement in drug-induced hepatic injury, Chem. Biol. Interact. 163 (2006) 145–159.
[32] L. Chen, J. Xuan, C. Wang, M. Shih Ie, Y. Wang, Z. Zhang, E. Hoffman, R. Clarke, Knowledge-guided multi-scale independent component analysis for biomarker identification, BMC Bioinformatics 9 (2008) 416.
[33] S.S. Lau, T.J. Monks, The contribution of bromobenzene to our current understanding of chemically-induced toxicities, Life Sci. 42 (1988) 1259–1269. [34] V.K. Mootha, C.M. Lindgren, K.F. Eriksson, A. Subramanian, S. Sihag, J. Lehar, P.
Puigserver, E. Carlsson, M. Ridderstrale, E. Laurila, N. Houstis, M.J. Daly, N. Patterson, J.P. Mesirov, T.R. Golub, P. Tamayo, B. Spiegelman, E.S. Lander, J.N. Hirschhorn, D. Altshuler, L.C. Groop, PGC-1alpha-responsive genes involved in oxidative phosphorylation are coordinately downregulated in human diabetes, Nat. Genet. 34 (2003) 267–273.