Multi-objective Optimization in Traffic
Signal Control
Author:
Phuong Thi Mai Nguyen
Supervisor:
Prof. Yingjie Yang Dr. Benjamin Passow Dr. Lipika Deka
A thesis submitted in fulfilment of the requirements for the degree of Doctor of Philosophy
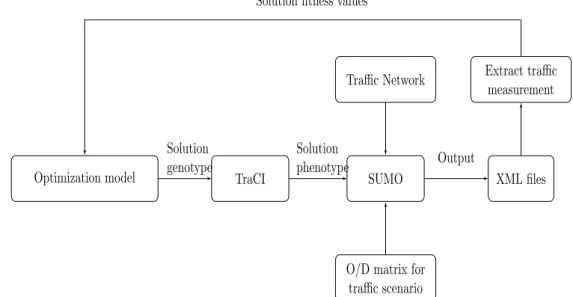
Traffic Signal Control systems are one of the most popular Intelligent Transport Sys-tems and they are widely used around the world to regulate traffic flow. Recently, complex optimization techniques have been applied to traffic signal control systems to improve their performance. Traffic simulators are one of the most popular tools to eval-uate the performance of a potential solution in traffic signal optimization. For that reason, researchers commonly optimize traffic signal timing by using simulation-based approaches. Although evaluating solutions using microscopic traffic simulators has sev-eral advantages, the simulation is very time-consuming.
Multi-objective Evolutionary Algorithms (MOEAs) are in many ways superior to tra-ditional search methods. They have been widely utilized in traffic signal optimization problems. However, running MOEAs on traffic optimization problems using microscopic traffic simulators to estimate the effectiveness of solutions is time-consuming. Thus, MOEAs which can produce good solutions at a reasonable processing time, especially at an early stage, is required. Anytime behaviour of an algorithm indicates its ability to provide as good a solution as possible at any time during its execution. Therefore, optimization approaches which have good anytime behaviour are desirable in evaluation traffic signal optimization. Moreover, small population sizes are inevitable for scenarios where processing capabilities are limited but require quick response times. In this work, two novel optimization algorithms are introduced that improve anytime behaviour and can work effectively with various population sizes.
NS-LS is a hybrid of Non-dominated Sorting Genetic Algorithm II (NSGA-II) and a local search which has the ability to predict a potential search direction. NS-LS is able to produce good solutions at any running time, therefore having good anytime behaviour. Utilizing a local search can help to accelerate the convergence rate, however, computational cost is not considered in NS-LS. A surrogate-assisted approach based on local search (SA-LS) which is an enhancement of NS-LS is also introduced. SA-LS uses a surrogate model constructed using solutions which already have been evaluated by a traffic simulator in previous generations.
NS-LS and SA-LS are evaluated on the well-known Benchmark test functions: ZDT1 and ZDT2, and two real-world traffic scenarios: Andrea Costa and Pasubio. The proposed algorithms are also compared to NSGA-II and Multiobjective Evolutionary Algorithm based on Decomposition (MOEA/D). The results show that NS-LS and SA-LS can ef-fectively optimize traffic signal timings of the studied scenarios. The results also confirm that NS-LS and SA-LS have good anytime behaviour and can work well with different population sizes. Furthermore, SA-LS also showed to produce mostly superior results as compared to NS-LS, NSGA-II, and MOEA/D.
I would like to express my sincere gratitude to my supervisory team Prof. Yingjie Yang, Dr. Benjamin N. Passow and Dr. Lipika Deka who provided unstinting support with their insights, expertise, and valuable comments. Without their encouragement and support, this thesis would not have been completed on a limited time frame. Especially, I would like to expand deepest thank to my dedicated supervisor Dr. Benjamin N.Passow who share his pearls of wisdom during this research, devoted his time and made valuable comments for better insight. Also, inspiration and encouragement play important role in keeping me moving forward.
I gratefully thank the Ministry of Education and Training of Vietnam for funding me a four-year scholarship for my study in the UK. Without this financial sponsorship, I would not be able to come to study in the UK.
My sincere thanks also go to the De Montfort University Interdisciplinary research Group in Intelligent Transport Systems (DIGITS) for the financial support to participate the WCCI 2016 conference in Vancouver and the International student workshop 2016 in Wroclaw, Poland. I also would like to thank all member of DIGITs for offering assistance to my study.
Last but not least, I would like to thank my parents and my sister for always encouraging me throughout this journey. Especially, I owe thanks to a very special person, my husband, for his love, support, and understanding during my pursuit of Ph.D. I greatly appreciate his belief in me that gave me extra strength to get things done.
Abstract i
Acknowledgements ii
Contents iii
List of Figures vii
List of Tables ix Abbreviations x Symbols xi 1 Introduction 1 1.1 Motivation . . . 1 1.2 Propositions . . . 5
1.3 Aims and objectives . . . 6
1.4 Major Contributions of the Thesis . . . 7
1.5 Thesis structure. . . 8
2 Background 10 2.1 Introduction. . . 10
2.2 Traffic Signal Control Systems . . . 10
2.2.1 Introduction to Traffic Signal Control Systems . . . 10
2.2.2 Fundamental Definitions of Traffic Signal Control Systems . . . 12
2.2.3 Overview of Traffic Signal Control Systems . . . 14
2.2.4 Performance Measures of Traffic Signal Control Systems . . . 16
2.3 Traffic simulation . . . 18
2.3.1 Introduction . . . 18
2.3.2 Simulation of Urban Mobility (SUMO). . . 20
2.4 Multi-objective evolutionary algorithms . . . 22
2.4.1 Definition of Multi-objective Optimization Problems and Basic Concepts . . . 22
2.4.2 General Framework of Multi-objective Evolutionary Algorithms. . 24
2.5 Surrogate-assisted evolutionary algorithms . . . 27 iii
2.5.1 Evolutionary algorithms vs. surrogates-assisted evolutionary
al-gorithms. . . 27
2.5.2 Strategies for managing surrogates . . . 28
2.5.2.1 Model management: its roles and classification . . . 28
2.5.2.2 Criteria for choosing individuals for re-evaluation . . . . 29
2.5.3 Techniques for constructing surrogates . . . 30
2.5.4 Artificial Neural Networks . . . 31
2.6 Conclusion . . . 33
3 Literature Review 35 3.1 Multi-objective Traffic Signal Optimization . . . 35
3.1.1 Introduction . . . 35
3.1.2 Traffic Signal Optimization using MOEAs . . . 36
3.1.3 Multi-objective Traffic Signal Optimization using Local Search based MOEAs . . . 38
3.2 Objectives in Traffic Signal Optimization . . . 40
3.2.1 Optimization Objectives in Traffic Signal Control . . . 40
3.2.2 Objective Calculation using Mathematical Programming Methods 44 3.2.3 Objective Calculation using Simulation-based Methods. . . 45
3.3 Reducing Computational Cost using Surrogate Models . . . 47
3.3.1 Computational Cost of Traffic Signal Optimization using MOEAs and Traffic Simulators . . . 47
3.3.2 Techniques for constructing surrogates . . . 48
3.3.3 Surrogate Assisted Optimization in Transportation . . . 53
3.4 Conclusion . . . 54
4 Methodology 56 4.1 Introduction. . . 56
4.2 The local search strategy . . . 57
4.2.1 Creating neighbours of a solution . . . 58
4.2.2 Motivation of the local search method . . . 58
4.2.3 The flow of the proposed local search. . . 59
4.3 NS-LS algorithm . . . 62
4.3.1 Overview of NS-LS . . . 62
4.3.2 The flow of NS-LS . . . 64
4.3.3 Design of the evolutionary search . . . 67
4.3.3.1 Chromosome Representation . . . 67
4.3.3.2 Selection and Reproduction Operators. . . 69
4.4 The surrogate model . . . 72
4.4.1 Constructing a surrogate model . . . 73
4.4.1.1 Choosing the model . . . 73
4.4.1.2 The training algorithm . . . 74
4.4.1.3 The error function . . . 75
4.4.1.4 Hyperparameter tunning . . . 76
4.4.2 Updating a surrogate model. . . 78
4.5 Fitness evaluation scheme . . . 79
4.5.2 The closeness of two solutions. . . 81
4.5.3 The framework of the fitness evaluation scheme . . . 82
4.6 SA-LS algorithm . . . 84
4.6.1 Overview of SA-LS . . . 85
4.6.2 The flow of SA-LS . . . 87
4.7 Conclusion . . . 90
5 Experimental Setup 92 5.1 Introduction. . . 92
5.2 Traffic scenarios. . . 93
5.2.1 Introduction to the traffic scenario of Andrea Costa . . . 94
5.2.2 Introduction to the traffic scenario of Pasubio . . . 97
5.3 Extracting optimization objective values from SUMO output . . . 100
5.4 Indicators for Performance Assessment . . . 104
5.4.1 Hypervolume . . . 104
5.4.2 C-metric. . . 105
5.4.3 Diversity Indicators . . . 106
5.5 Experimental design for evaluating the performance of the algorithms . . 107
5.5.1 Experiment 1 - Benchmark functions . . . 107
5.5.2 Experiments using real-time traffic scenarios simulated by SUMO. 109 5.5.2.1 Experiment 2 - Andrea Costa scenario. . . 109
5.5.2.2 Experiment 3 - Pasubio scenario . . . 110
5.6 Conclusion . . . 110
6 Experimental Results 111 6.1 Introduction. . . 111
6.2 Experiment 1: ZDT1 and ZDT2 test functions . . . 112
6.3 Results of experiments using traffic scenarios . . . 115
6.3.1 Results of Experiment 2 - Andrea Costa . . . 115
6.3.1.1 Hypervolume Metric . . . 116 6.3.1.2 C-metric results . . . 121 6.3.1.3 Diversity results . . . 122 6.3.2 Results of Experiment 3 . . . 124 6.3.2.1 Hypervolume results . . . 125 6.3.2.2 C-metric results . . . 131 6.3.2.3 Diversity results . . . 132 6.4 Conclusion . . . 133
7 Conclusions, Recommendations, and Future Work 135 7.1 Propositions . . . 136
7.2 Key findings of the research . . . 139
7.3 Key contributions of the research . . . 142
7.4 Limitations of the Research . . . 143
7.5 Recommendations and Future Work . . . 144
B Mean hypervolume with standard deviation of the algorithms in
Ex-periment 2 146
C Mean hypervolume with standard deviation of the algorithms in
Ex-periment 3 150
2.1 Movements in a two-phase system. . . 13
2.2 A diagram of two-phase signal system . . . 13
2.3 The structure of the node file of a traffic scenario simulated by SUMO . . 19
2.4 The structure of the edge file of a traffic scenario simulated by SUMO . . 19
2.5 The structure of the traffic light file of a traffic scenario simulated by SUMO 19 2.6 The Netconvert command to generate a traffic network file of a scenario simulated by SUMO . . . 20
2.7 The structure of the route file of a traffic scenario simulated by SUMO . . 20
2.8 The structure of the configuration file of a traffic scenario simulated by SUMO . . . 21
4.1 The neighbour creation: a neighbour nbR(t) i is created from solutionR(it) based on two other reference solutions R(ut) and Ru(t) using equation 4.1 withα = 0.5. . . 59
4.2 The overall optimisation framework of NS-LS. . . 62
4.3 The framework of the optimization process in NS-LS . . . 63
4.4 Chromosome representation wheregi is a variable representing the green duration ofi(th) phase. . . 67
4.5 Overall structure of the surrogate model.. . . 74
4.6 Sigmoid function witha= 4. . . 74
4.7 Grid search for hyperparameter fine-tuner.. . . 76
4.8 The n-fold cross validation technique. . . 77
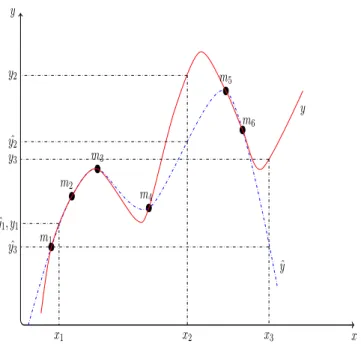
4.9 Relationship between distance and approximation error of new solutions and available solutions in the database . . . 81
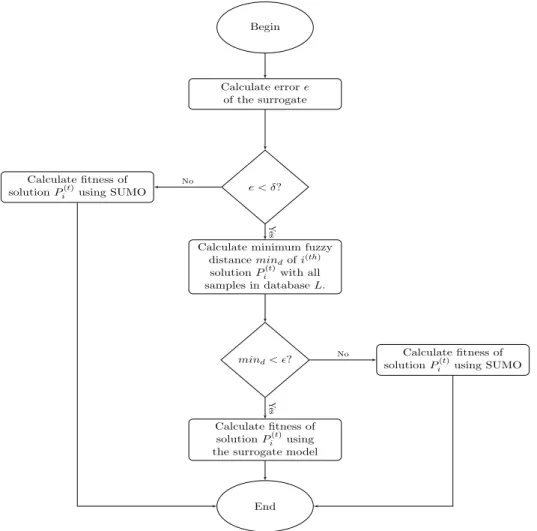
4.10 The framework of the fitness evaluation scheme.. . . 83
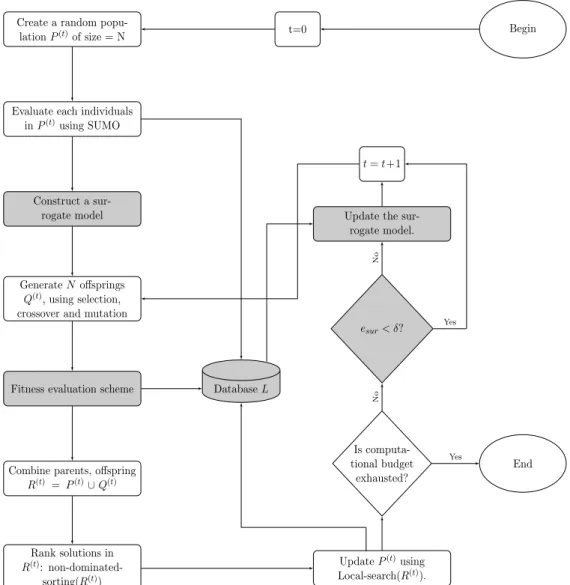
4.11 The framework of the proposed algorithm SA-LS . . . 86
5.1 The traffic network of Andra Costa extracted from Open Street Map . . . 93
5.2 The Andrea Costa traffic map simulated by SUMO . . . 94
5.3 The traffic flow of three days in Bologna city provided by the municipality 95 5.4 Case study area in Andrea Costa . . . 96
5.5 Phases of the signal control program of the case study in Andrea Costa. . 96
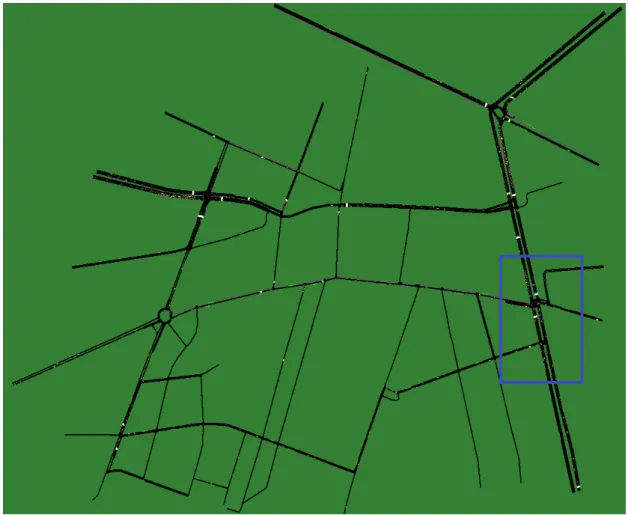
5.6 A traffic network of Pasubio taken from Open Street Map . . . 98
5.7 The Pasubio road network simulated by SUMO. . . 99
5.8 Case study area in Pasubio . . . 100
5.9 Phases of the signal control program of the case study in Pasubio. . . 101
5.10 A part of a trip information output file from the Andrea Costa scenario. This file is produced after the simulation finished containing departure and arrival times, time loss, and route length and other information. . . . 101 5.11 A part of the acosta detectors.add.xml file . . . 102 5.12 A part of the e1 output.xml file from Andrea Costa scenario. . . 103 6.1 The mean of HV on 20 runs obtained by NS-LS, SA-LS, NSGA-II, and
MOEA/D over the number of evaluations using the original objective function. The objective function is ZDT1. . . 113 6.2 Mean of HV on 20 runs obtained by NS-LS, SA-LS, NSGA-II, and MOEA/D
over the number of evaluations using the original objective function. The objective function is ZDT2. . . 114 6.3 Average HV with standard deviation on 20 independent runs obtained by
MOEA/D, NSGA-II, NS-LS, and SA-LS at the end of the optimization process in Experiment 2. . . 115 6.4 Mean of HV on 20 runs obtained by NS-LS, SA-LS, NSGA-II, and MOEA/D
over the number of evaluations using SUMO in Experiment 2. . . 117 6.5 Mean HV with standard deviation of MOEA/D, NSGA-II, NS-LS, and
SA-LS on 20 different runs in population size 20 in Experiment 2.. . . 118 6.6 Distribution of solutions in the non-dominated set achieved by NS-LS,
SA-LS, NSGA-II, and MOEA/D at the end of the optimization process in Experiment 2. These solutions are selected from the final solutions of 20 runs. . . 121 6.7 Average HV with standard deviation on 20 independent runs obtained by
MOEA/D, NSGA-II, NS-LS, and SA-LS at the end of the optimization process in Experiment 3. . . 125 6.8 Mean of HV on 20 runs obtained by NS-LS, SA-LS, NSGA-II, and MOEA/D
over the number of evaluations using SUMO in Experiment 3. . . 126 6.9 Mean HV with standard deviation of MOEA/D, NSGA-II, NS-LS, and
SA-LS on 20 different runs in population size 20 in Experiment 3.. . . 128 6.10 Distribution of solutions in the non-dominated set achieved by NS-LS,
SA-LS, NSGA-II, and MOEA/D at the end of the optimization process in Experiment 3. These solutions are selected from the final solutions of 20 runs. . . 130 B.1 Mean HV with standard deviation of NS-LS, SA-LS, MOEA/D, and
NSGA-II on 20 different runs with population size 40 in Experiment 2. . . 147 B.2 Mean HV with standard deviation of NS-LS, SA-LS, MOEA/D, and
NSGA-II on 20 different runs with population size 60 in Experiment 2. . . 148 B.3 Mean HV with standard deviation of NS-LS, SA-LS, MOEA/D, and
NSGA-II on 20 different runs with population size 80 in Experiment 2. . . 149 C.1 Mean HV with standard deviation of NS-LS, SA-LS, MOEA/D, and
NSGA-II on 20 different runs with population size 40 in Experiment 3. . . 151 C.2 Mean HV with standard deviation of NS-LS, SA-LS, MOEA/D, and
NSGA-II on 20 different runs with population size 60 in Experiment 3. . . 152 C.3 Mean HV with standard deviation of NS-LS, SA-LS, MOEA/D, and
3.1 Evolutionary algorithms in traffic signal control systems. . . 37 3.2 Optimization objectives in traffic signal optimization using MOEAs. . . . 41 3.3 Techniques for constructing surrogate in the literature. . . 49 5.1 Experimental parameters settings for NS-LS, SA-LS, and NSGA-II in
Experiment 1. . . 107 5.2 Experimental parameters settings for NS-LS, SA-LS, and NSGA-II in
Experiments 2 and 3.. . . 109 6.1 A solution obtained by SA-LS algorithm in the final generation with the
population size 20 in Experiment 2.. . . 116 6.2 Best, worst, median, mean, and standard deviation of HV obtained by
MOEA/D, NSGA-II, NS-LS, and SA-LS in Experiment 2, each over 20 independent runs and for different population sizes. . . 120 6.3 C-metric obtained by NS-LS, SA-LS, NSGA-II, and MOEA/D at the end
of the optimization process in Experiment 2 . . . 122 6.4 S and MS metrics achieved by NS-LS, SA-LS, NSGA-II, and MOEA/D
in Experiment 2 . . . 123 6.5 Best, worst, median, mean, and stdev of HV obtained by NS-LS, SA-LS,
and NSGA-II over 20 independent runs in Experiment 3.. . . 129 6.6 C-metric obtained by NS-LS, SA-LS, NSGA-II, and MOEA/D at the end
of the optimization process in Experiment 3 . . . 131 6.7 S and MS metrics achieved by NS-LS, SA-LS, NSGA-II, and MOEA/D
in Experiment 3 . . . 133
ITS Intelligent Transportation System TSC Traffic Signal Control
MOOP Multi-objective Optimization Problem
MOEA Multi-objective Optimization Evolutionary Algorithm NSGA-II Non-dominated Sorting Genetic Algorithm
GA Genetic Algorithm
PSO Particle Swarm Algorithm DE Differential Algorithm
MOEA/D Multi-objective Evolutionary Algorithm Based on Decomposition NS-LS Multi-objective optimization algorithm based on local search
SA-LS Surrogate-assisted optimization algorithm based on fuzzy distance and local search SUMO Simulation of Urban Mobility
MSE Mean Square Error
RPROP Resilient Back-propagation Learning Algorithm FNN Feedforward Neural Networks
ANN Artifical Neural Networks
MLP Multilayer Feedfoward Perceptrons TraCI Traffic Control Interface
O/D Origin/Destination
ZDT1 Zitzler-Deb-Thiele’s function N.1 ZDT2 Zitzler-Deb-Thiele’s function N.2 SBX Simulated Binary Crossover PLM Polynomial Mutation
HV Hypervolume
S Schott metric
M S Maximum Spread
C(A, B) The set coverage (C-metric) of algorithms A and B tli The time loss oft(th) vehicle
¯
T L Average time lost ¯
F Average traffic flow Nveh Total number of vehicles
Ne Total number of detectors
N Population size of the evolutionary algorithm
maxEval Maxinum number of evaluations using a traffic simulator pc Crossover probability
pm Mutation probability of a chromosome
Pmv Mutation probability of a variable in a chromosome
C Cycle length
Cmax Maximum cyle length
Cmin Minimum cyle length
gi Green duration ofi(th) phase
gmini Minimum green duration ofi(th) phase gmaxi Maximum green duration ofi(th) phase <c The crowded tournament selection operator
nb
R(it) Neighbour of solutionR (t) i
P(t) The population of the evolutionary search atith generation Q(t) The offspring population created from P(t) atith generation R(t) The population merged byP(t) and Q(t)atith generation
L A database consisting all solutions evaluated by SUMO
Ltemp A database consisting solutions evaluated by SUMO in the current generation
SU P1 A set of solutions of a sub-population which belong to the first non-dominated front SU P2 A set of solutions of a sub-population which belong to the second non-dominated front Fi i(th) non-dominated front
E Error function for a learning algorithm Ec The Cross-validation error function
errcur Average approximation error of the surrogate using solutions inLtemp
δ An error threshold ¯
HV The average hypervolume
Introduction
1.1
Motivation
Transportation plays an important role in society as it contributes to economic growth, social development, and improvement to human lifestyle. However, the transport sector is facing several challenges, especially in urban areas. First, congestion has become a serious issue which can lead to an increase in fuel consumption, air pollution and ac-cordingly can cause detrimental impacts on economic growth. The second challenge is to reduce the number of fatalities and serious injuries from road accidents and collision, especially in low- and middle-income countries. According to the global status report on road safety 2018 of the World Health Organization, approximately 1.35 million people die each year due to road traffic accidents,WHO(2018). Third, reducing traffic exhaust emissions is an urgent mission since the transportation industry is a key player in global warming. To solve these mentioned problems, a number of methods can be applied such as constructing new roads, expanding existing transport systems, optimizing the per-formance of existing transportation systems and making transport policies. Depending on the situation and characteristics of each area, suitable and efficient methods would be chosen. However, for urban cities where there is no available space for building new transport roads, constructing more roads or expanding transport systems is often in-feasible. Therefore, upgrading and optimizing an existing transport system to make it become smarter has become an attracting trend in transportation research. Intelligent Transport System (ITS) has been proposed and deployed in many cities around the world to improve the performance of the transport sector,Chen et al.(2014),Chen and
Chang (2014),Djalalov(2013), Hamza-Lup et al.(2008),Sanchez-Medina et al.(2010),
Zhang et al. (2011).
Intelligent Transportation System (ITS) combines information and communication tech-nologies into the transportation system’s infrastructure to improve performance, effi-ciency, and safety. The purpose of ITS is to take advantages of advanced technologies to address transportation problems, for example, safety, traffic congestion, transport ef-ficiency, and environmental protection by creating more intelligent roads. Over the past decade, ITS has greatly improved transportation conditions and access capacity of road networks Chen and Chang (2014), Kouvelas et al. (2011), Yan et al. (2013), reduced traffic congestion Adacher (2012), Sabar et al. (2017), Shen et al. (2013) and exhaust emissions Armas et al. (2017), Passow et al. (2012), Sanchez-Medina et al. (2010) in many urban areas over the world.
Traffic signal control system is a cost-effective tool for urban traffic management and has become an important research area in ITS. It controls the traffic at road intersections, determines which flows are allowed to pass through and which flows have to stop. Its final purpose is to make sure that every traffic users including vehicles, pedestrians, and bicyclist move through the intersection safely and efficiently. The correct and efficient operation of traffic signal control of the overall traffic network is therefore critical to the performance of the urban transport network and is considered to be an essential element of ITS.
The role of traffic signal optimization is to significantly improve traffic network per-formance by optimizing objectives such as reducing delay and number of stops and increasing network throughput or average speed within the traffic network. Setting traffic signals in a signal-controlled street network involves the determination of cycle time, splits of green (and red) time, and offsets. Traffic light signal optimization might optimize a part of or all these values.
Traffic signal timing optimization methods fall within two main categories: mathemati-cal programming method and simulation-based approach,Chen and Chang(2014). The former scheme utilizes mathematical formulations to capture the characteristics of traffic flow models which will be utilized to optimize objectives in traffic management. How-ever, the calculations of these mathematical models are often very complicated and hard to meet real-time requirements, Zhao et al. (2012). Furthermore, the interrelationship
between the traffic flows of complex intersections, such as queue spillback or blockage between through and turning lanes, cannot be adequately captured by mathematical programming formulations, Chen and Chang (2014). Moreover, not every optimiza-tion problem can be expressed by mathematical formulas. On the other hand, the simulation-based approaches aim at capturing the complex interactions between traffic characteristics. For that reason, more recently, researchers tend to optimize traffic signal timing by using simulation-based approaches,Chen and Chang(2014),Papatzikou and
Stathopoulos (2015),Poole and Kotsialos (2016).
Multi-objective Evolutionary Algorithms (MOEAs) are widely used to solve the multi-objective optimisation problem in transportation, Caraffini et al.(2013),Goodyer et al.
(2013),Witheridge et al. (2014), Zheng et al. (2015). However, when applying MOEAs
to optimise a transportation problem, traffic simulation always needs to be called when a solution is evaluated. Moreover, MOEAs need to evaluate solutions many times in the optimisation process to obtain optimal solutions. Time to run multiple simulations requires much processing time. For example, it takes 25 seconds to run one simulation of the Andrea Costa traffic scenarioBieker et al.(2015) using a PC with Intel(R) Core(TM) i5-6500 CPU 3.2GHz. If the population size is 60 and there are 20 generations in the evolutionary process, the number of simulations needed in the optimization algorithm is 1200. Therefore, the time to run simulations is about 8.3 hours. The computation time will rapidly rise as the scale of the traffic network increases, such as in road network size and number of vehicles. In order to address this problem, a few research methods have utilized powerful and expensive hardware to reduce computation time. However, such approaches are expensive and not always feasible. As a result, optimisation approaches which have the ability to provide good solutions, which produce high fitness values and satisfy all constraints, at a reasonable processing time, especially at an early stage, are desired. Nevertheless, the optimization literature mostly focuses on the quality of so-lutions reached by an algorithm at the end of the optimization process. However, such studies might not work efficiently in optimization problems where function evaluations are limited by time or cost. In these situations, in order to evaluate the efficiency of an optimisation algorithm, an indicator, which can measure the ability of that algorithm to produce good solutions at any time during its operation, is needed. Anytime be-haviour of an algorithm is its ability to provide as good a solution as possible at any
time during its execution and continuously improves the quality of the results as com-putation time increases,Dubois-Lacoste et al.(2015),Lopez-Ibanez and Stutzle (2014). Anytime behaviour may be described in terms of the curve of hypervolume over time. Hypervolume, introduced by Zitzler and ThieleZitzler and Thiele (1998), measures the volume of the objective space which is dominated by a non-dominated set. Therefore, if one non-dominated set has a higher hypervolume, it will be closer to the Pareto-optimal front. The hypervolume indicator is used to compare anytime behaviour between two multi-objective optimization algorithms. As optimizing traffic signal control is time-consuming and the time to run the optimization process is limited and scenario specific, anytime behaviour of the system is a preferred indicator for system performance. In transportation optimization problems, small population sizes can be important for scenarios where limited processing capabilities meet demand for quick response time. Such scenarios are typical for local and distributed signal controllers which offer very limited processing power while requiring optimised signal timings within a few cycles or minutes. Therefore, optimization algorithms with the ability to work effectively in small population sizes are preferable.
A combination of a local search and a global evolutionary algorithm may accelerate the convergence speed of the search. Furthermore,Espinoza et al.(2003) indicates that local search also helps to reduce the population size of the optimization algorithm. Therefore, with selective use of a local search, anytime behaviour of an evolutionary algorithm can be improved and the efficiency of a traffic signal optimization model can be increased. Surrogate or approximation models are computational models used to estimate objective values of candidate solutions at a cheaper cost compared to original objective function. Surrogates are used to reduce the number of evaluations using original objective function while remaining a reasonable good quality of results obtained. Surrogate may reduce the number of traffic simulator-based evaluations in a generation of the evolutionary search. Therefore, with a limited budget of the maximum number of evaluations using the traffic simulator, the number of generations may be increased. Consequently, surrogate-assisted MOEAs are very promising to improve anytime behavior of traffic signal optimization algorithms.
algorithm based on local search (NS-LS) and a surrogate-assisted multi-objective op-timization algorithm based on fuzzy distance and local search (SA-LS) for improving anytime behaviour in traffic signal timing. Furthermore, these algorithms can work ef-fectively when the population size is small. The performance of the proposed algorithms will be compared with NSGA-II and MOEA/D with different sizes of the population, demonstrating their improved effectiveness.
1.2
Propositions
In this demanding field of intelligent transport systems, the following research proposi-tions have been set and studied:
Proposition 1: A local search method can be used to improve anytime behaviour of multi-objective optimization algorithms in traffic signal optimization problems.
A novel local search algorithm looking for neighbours which potentially have good fit-ness values is introduced in Chapter 4. The proposed local search method can predict potential search directions before searching for better solutions. Therefore, the chance to find a superior neighbour at early stages would be increased. Consequently, anytime behaviour of the search algorithm may be improved. The experiments are conducted in Chapter 6 and the results are shown in Chapter 7.
Proposition 2: A method based on an approximation model can be designed to evaluate candidate solutions in traffic signal optimization problems.
A novel surrogate model is proposed in Chapter 4 based on an Artificial Neural Net-work. By using solutions evaluated by the traffic simulator in previous generations, this surrogate can learn the relationship between the input which is the duration of phases of a traffic signal system and the output that are values of traffic parameters such as flow and delay. The surrogate is continuously updated during the optimization process to increase the accuracy of the approximation result. This surrogate is partially used with a traffic simulator to evaluate objective values of candidate solutions in every generation of the evolutionary search.
Proposition 3: A local search method can be combined with an approximation model to enhance anytime behaviour of evolutionary search in traffic signal optimization problems, especially in small population sizes.
A novel surrogate-assisted evolutionary algorithm is introduced in Chapter 5 for traffic signal optimization problems. An approximation model is used to reduce the number of traffic simulator-based evaluations while a local search can accelerate the convergence rate of the evolutionary search. Therefore, using the same number of evaluations con-ducted by a traffic simulator, the number of iterations in the optimization process of the proposed algorithm will be increased. An appropriate management model is also proposed to use the surrogate effectively and properly. Experiments are carried out in Chapter 5 to evaluate the performance of the combination of a local search with an ap-proximation model in traffic signal optimization problems in terms of anytime behaviour improvement. The results of the experiments are shown in Chapter 6.
1.3
Aims and objectives
The main aim of this research is to evaluate the ability of combining a surrogate-assisted evolutionary algorithm and a local search method in improving anytime behaviour of a traffic signal optimization system, especially when the population size of the evolu-tionary process is small. This research also intents to assess the possibility of using an approximation model to evaluate candidate solutions in traffic signal optimization prob-lems. Furthermore, another subsidiary aim of this research is to investigate the ability of local search methods in increasing anytime behaviour of multi-objective optimization algorithms in traffic signal optimization problems.
The objectives of this study are:
1. To provide a comprehensive literature review of traffic signal optimization based on multi-objective evolutionary algorithms and traffic microscopic simulators. 2. To extend the knowledge of optimizing traffic signal control using surrogate-assisted
3. To construct an optimization model for traffic signal control based on a local search method to improve anytime behaviour and this model can work effectively in small population sizes.
4. To develop a surrogate-assisted evolutionary algorithm for optimizing multiple ob-jectives in traffic signal control. This methodology utilizes a surrogate to decrease the number of traffic simulator-based evolutions. A local search is also used to accelerate the convergence rate of the evolutionary search.
5. To assess and compare the performance of the proposed models on traffic scenarios.
1.4
Major Contributions of the Thesis
Major contributions of the thesis are summarized as follows:
1. A local search methodology for superior neighbours in local areas is introduced. This local search has the ability to predict potential search directions, therefore, the chance to find out a better neighbour from an early stage can be increased. 2. A multi-objective evolutionary algorithm based on local search is proposed for
improving anytime behaviour in traffic signal timing. The local search is performed inside the iteration process of the evolutionary algorithm to quickly find superior solutions. This helps to increase the convergence rate of the evolutionary search. 3. A surrogate model is constructed to evaluate the fitness value of candidate
solu-tions in the optimization process. This surrogate is able to learn the relasolu-tionship between the phase duration of the signal timing setting and the traffic parameters needed such as flow and time lost. Solutions which are already evaluated using the traffic simulator in the previous generations are utilized to train the surrogate model. The model is also updated during the optimization process to improve the approximation accuracy.
4. A surrogate-assisted multi-objective evolutionary optimization algorithm for traffic light signal control in urban intersections is introduced. This algorithm utilizes the surrogate model to estimate the fitness value of candidate solutions. Both traffic simulator and the surrogate are used together in the fitness evaluation process
to prevent the evolutionary search from obtaining false optima. Moreover, the local search is also used in the iterations of the evolutionary search to accelerate the convergence rate. A hybrid of the local search and the surrogate improve the anytime behaviour of the evolutionary algorithm in traffic signal optimization problems.
5. A fitness evaluation scheme is proposed to effectively choose a model between the surrogate and the traffic simulator SUMO to estimate fitness values of solutions. This scheme is used to guarantee that the surrogate is used effectively. This scheme is based on the closeness of the solution to the solutions already evaluated by the traffic simulator in the database which is used to build the surrogate and the MSE of approximation error of the surrogate.
1.5
Thesis structure
The thesis is organized as follows:
Chapter 2 provides a background of traffic signal control systems, road traffic simulators as well as optimization algorithms which have been applied in transportation problems. Fundamental definitions of traffic signal control systems are introduced in the first part of this chapter. Basis introduction to road traffic simulators and Simulation of Urban Mobility (SUMO) software are present in the next section. Afterward, definition and ba-sic concepts as well as the general framework of Multi-objective Evolutionary Algorithms (MOEAs) are explained. Definition of surrogate-assisted evolutionary algorithms and techniques for constructing a surrogate are introduced in the last part of this chapter. Chapter 3 contains a comprehensive literature review. Although many computational intelligent methods have been applied to optimize traffic signal problems, this chapter mainly focuses on multi-objective traffic signal optimization using MOEAs and local search-based MOEAs. Evaluating the objective value of a candidate solution using traffic simulators is also reviewed. Advantages and drawbacks of optimizing a traffic signal optimization problem using traffic simulator-based MOEAs are shown and the gap in the previous researches of traffic signal optimization using MOEAs is outlined. Studies on traffic signal optimization using surrogate-assisted MOEAs are also in this chapter.
Chapter 4 introduces the algorithms proposed in this study. Firstly, the motivation and the flow of the local search strategy are provided. Afterwards, this chapter presents NS-LS which is a multi-objective optimization algorithm for improving anytime behaviour in traffic signal timing. The overview, flow, framework of NS-LS, as well as discussion of the design of the evolutionary search of NS-LS are explained. The process to construct the surrogate including choosing the model, the training algorithm, the error function, tuning hyperparameters, and updating the surrogate are also offered. The surrogate is used together with the traffic simulator to estimate the fitness value of candidate solu-tions and fitness evaluation scheme which is a strategy to effectively use the surrogate is also proposed in this chapter. Afterwards, SA-LS - a surrogate assisted multi-objective traffic signal optimization algorithm based on fuzzy distance and local search is intro-duced, including an overview of SA-LS and a discussion of the SA-LS’s search flow. Chapter 5 discusses the experimental setup used to evaluate the performance of the pro-posed algorithms in this thesis. Two benchmark test functions and two traffic scenarios are introduced in the first part. Procedure to connect a traffic scenario and an opti-mization model as well as methods to extract optiopti-mization objective value from SUMO output are presented in the next sections. Performance indicators used in this thesis are also discussed. At the end of this chapter, the details of the three experiments are introduced to evaluate the performance of the algorithms.
Chapter 6 illustrates the experimental results. The performance of proposed algorithms is evaluated and compared against NSGA-II and MOEA/D using several performance indicators introduced in Chapter 6. The optimization results of the algorithms in three experiments are presented to examines the propositions.
Chapter 7 concludes the thesis and it contains conclusions, recommendations, and future work. The propositions introduced in the introduction chapter are reconfirmed in this chapter. Overall summary of the major contributions of research is also provided.
Background
2.1
Introduction
Before evaluating hypotheses formulated in Chapter1, general knowledge about relevant components is reviewed. Therefore, this chapter provides a background of traffic signal control systems, road traffic simulators, and optimization algorithms applied in trans-portation problems. This chapter is organized as follows: Section 2.2 introduces the fundamental definitions of traffic signal control systems while basic introduction to road traffic simulators as well as Simulation of Urban Mobility (SUMO) software are pre-sented in Section 2.3. Multi-objective Optimization Algorithms (MOEAs) definitions, basic concepts, and the general framework are explained in Section 2.4. The difference between surrogate-assisted evolutionary algorithms and evolutionary algorithms is illus-trated in Section 2.5. Techniques for constructing a surrogate model are also shown in this section. Finally, Section 2.6 concludes this chapter.
2.2
Traffic Signal Control Systems
2.2.1 Introduction to Traffic Signal Control Systems
Transportation is a critical and non-separable part of any society as it links various regions and helps people move easily between different destinations. Advances in trans-portation have made possible changes the way in which societies are organized and the
way of living. Hence, transportation has a high influence on the development of civili-sations. The rapid increase in population has enabled the number of registered vehicles to grow quickly. The number of vehicles is increasing and transport characteristics are growing more complex such as different types of drivers, pedestrians, bicyclists, vehicles, and road infrastructure. Traffic demand is rapidly increasing and continues to exceed the transport capacity. To better meet traffic demand, it is essential to build new transport infrastructures or to upgrade existing road systems. Traffic demand in urban cities are normally much higher than that of rural areas but space for constructing new roads or expanding existing transport infrastructure in big cities is no longer enough. Consequently, traffic congestion in urban areas has become prevalent and continues to have detrimental consequences on both society and economy of the region and country. According to a report of CE Delft, which is an independent organization specialized in developing solutions for environmental problems; the external cost of road traffic, which is the cost imposed by side effects of transport such as congestion, noise level, and air pollution, in the European Union accounts for 1 to 2 % of GDP ,van Essen et al.
(2011). Furthermore, the transportation system is currently facing several challenges and there is a need to decrease travel time and delays, improving passenger safety and reducing traffic exhaust emissions. Therefore, Intelligent Transportation Systems (ITSs) have been proposed and developed in many cities around the world to improve the per-formance of the transport sector. Over the past decade, ITSs have greatly improved transportation conditions and capacity of road networks, reduced traffic congestion and exhausted emissions in many urban areas over the world, DOrey and Ferreira (2014),
Hess et al. (2015),Quddus et al. (2019),Sheng-hai et al. (2011).
Traffic Signal Control (TSC) Systems is one of the most popular ITSs and it is widely used around the world to regulate traffic flow. TSC systems play an important role in transportation network management and they are one of the most effective traffic control methods for safe and efficient travel in urban areas. Traffic signal control systems are placed at road intersections to control conflicting traffic movements and determines which approaches are allowed to travel through and which traffic streams have to stop. Its final purpose is to guarantee that every traffic user, including vehicles, pedestrians, and bicyclists move through the intersection safely and efficiently. TSC systems are also meant to reduce traffic congestion and emissions. However, inefficient operation of the traffic movement control system at intersections is one of the main reasons leading to
traffic congestions. The efficiency of a TSC system is directly related to the effectiveness of the employed control methodology. It is estimated that 50-80 % of traffic issues happen at intersections and their surroundings, 1/3 travel time and 80-90 % waiting time is consumed at red phases of signalized intersections,Ben et al.(2010). Therefore, a proper and efficient traffic signal control systems is essential to the performance of the whole transport system. Basically, most signal control approaches aim to increase traffic flow and to reduce delay or to prevent traffic congestion,Chen and Chang(2014),
Sanchez-Medina et al. (2010),Shen et al. (2013).
2.2.2 Fundamental Definitions of Traffic Signal Control Systems
A traffic signal control system is a signaling device placed at intersections, junctions, crossroads or pedestrian crossing to regulate traffic movements. In the UK and many other countries, a TSC system commonly consists of three lights: a red, indicating that incoming vehicles have to stop, a green light meaning that the vehicles are allowed to travel through the intersection if it is safe. The green arrow pointing right or left means the vehicles are allowed to make a protected turn. An amber warning light, coming after a green light, indicating that the traffic light is about turn red and the vehicles have to stop if possible. When the red and amber lights are shown at the same time, the vehicles have to completely stop. For pedestrians, there are only two lights: a red light, which means pedestrians have to stop, and a green light, indicating that pedestrians can cross the road.
The TSC deployed at an intersection implements traffic signal timing to control vehicles, bicyclists, pedestrians, and other traffic participants safely passing through the intersec-tion. Traffic signal timing includes deciding the sequence of movements and allocating green time to each group of movements at a signalized intersection. Pedestrians, cyclist and other users also should be taken into account when designing signal timings. An example of movements in a two-phase signal system of a four-legged intersection is illus-trated in Figure 2.1. A diagram of signal timing is demonstrated in Figure 2.2. Some fundamental definitions in signal timing are described as follows,Kittelson & Associates
(a) Phase 1 (b) Phase 2
Figure 2.1: Movements in a two-phase system.
Figure 2.2: A diagram of two-phase signal system (C is signal cycle length, x1 and x2 are green durations of phase one and phase two, L1 and L2 are inter-green durations).
A signal cycle is a complete sequence of all traffic movements at an intersection. A signal cycle length is defined as the total time required to accomplish one signal cycle and it is determined by the sum of green times of all stages, yellow change intervals and all-red clearance intervals.
A phase is a portion of a signal cycle assigned to one set of movements and it is defined as the green, yellow or all-red clearance intervals.
Offset is the difference between two green initiation times for two successive in-tersections. Offset helps vehicles moving through successive intersections without being stopped.
Green splits are a portion of total available green time in the cycle allocated to each phase at an intersection.
Inter-green time consists of both the yellow indication and the all-red indication(if applicable) in one cycle and it is necessary when changing states to avoid collision between traffic movements.
A proper and effective traffic signal timing can have a number of benefits: (1) vehicles can pass the intersection safely; (2) increase the number of vehicles served at the inter-section - or increase the capacity of signalized interinter-sections; (3) reduce congestion and delay; (4) allow pedestrians and side street traffic to travel through the intersection with appropriate levels of accessibility.
2.2.3 Overview of Traffic Signal Control Systems
The most important role of traffic control is to regulate traffic flow, improve congestion, and reduce emissions. Information technology and computer technology are two of dependencies of traffic control progress and development, Wang et al. (2018). Recent improvements in traffic control methods can provide flexible control strategies, Chow
(2010).
As mentioned in Board et al. (2010), a lot of traffic signal control systems have been proposed and developed, but less than half of them have been deployed in the real world traffic to use. According to Wang et al. (2018), signal control strategies employed for road signalized intersections may be classified as follows:
Fixed-time or pre-timed signal control methods use pre-determined traffic signal control parameters such as the sequence of operation, split and offset, is suitable for regular and relatively stable traffic flows. Pre-time strategies are obtained off-line by utilizing appropriate optimization methods based on historical data.
Traffic-responsive or real-time signal control methods automatically regulate the signal timing based on current traffic conditions which were studied from real-time traffic data. These data are collected from equipment such as inductive loops or sensors, which are installed along the roads. Therefore, various traffic signal control parameters can be dynamically changed depending on recent traffic conditions. Real-time TSC provides an effective management method for urban traffic networks which are highly complex, uncertain and dynamic.
Signal control strategies can be classified by the number of intersections involved as shown as follows:
Isolated strategies which are applicable to a single intersection without consider-ation of any adjacent intersections and signal timings at this intersection do not significantly affect other neighbouring intersections. In this instance, each inter-section will have signal settings that are the most suitable for only that particular intersection.
Coordinated strategies which consider several adjacent intersections or a traffic area. Coordinated strategies allow vehicles to move through successive intersec-tions without encountering a red signal. Accordingly, the green time of one junction always starts later than its predecessor by the amount of time the vehicle needed to travel between two intersections. This travel time is determined by congestion-free conditions.
Traffic signal control is an dependency of the development of modern control theory, artificial intelligence theory, traffic information technology, and traffic engineering tech-nology. Rapidly development of Artificial Intelligence (AI) theory and methods, which include agents, neural networks, fuzzy logic, and group intelligence, also impact the traffic control strategies, Papageorgiou et al.(2003).
TRANSYT is a well-known fixed-time coordinated traffic signal control system, Robert-son (1986). It contains a traffic model and is fed with initial signal settings including initial values of splits, cycle length, and offsets as well as of the minimum value of green duration for each signal stage and the pre-defined staging of each intersection. It can produce fixed-time signal plans for different hours of a day. The optimization model de-termines the corresponding output, which is the performance metrics, from given input of decision variables. In TRANSYT, the hill-climbing algorithm is utilized to look for the optimum. Split Cycle and Offset Optimization Technique (SCOOT) is considered to be the traffic-responsive version of TRANSYT. In both TRANSYT and SCOOT, the major objective is to minimize the sum of the average queues in the area. SCOOT collects real-time measurements (instead of historical data) from vehicle detectors and runs repeatedly a network model to examine the effect of incremental changes of cycle length, offsets, and splits. The parameters are adjusted through an iterative process
of gradient optimization. SCOOT has been deployed in many cities in the UK and overseas,Robertson and Bretherton(1991).
Leicester, Leicestershire and Rutland traffic are controlled by a Area Traffic Control Centre. In this centre, day by day traffic is managed and controlled using intelligent transport system. Currently, the systems is used to manage over 800 sets of traffic signals. Timings of traffic signal are adjusted to aid the flow of traffic. SCOOT and traffic cameras are two main data source for the system, Council(2019).
2.2.4 Performance Measures of Traffic Signal Control Systems
Several measures have been used in evaluating the quality of traffic signal control sys-tems. These measures are all related to the experience of drivers travelling through a signalized intersection. The most popular indicators are delay and queue length.
A. Delay
Delay is the most important indicator of effectiveness evaluation at a signalized inter-section. It is directly related to the amount of lost travel time, fuel consumption and the discomfort of car occupants. Delay at an intersection is measured as the extra time spent by the vehicle to pass the intersection compared to the time required to travel through the intersection without any stoppage. The total delay time of a vehicle at an intersection can be divided into acceleration delay, deceleration delay, and stopped time delay. The time loss that the vehicle takes to slow down and stop when the red signal is on, or in case there is a queue of vehicles passing through the intersection at the beginning of the green phase is the deceleration delay. The stopped delay is identified as the time a vehicle stops in the queue waiting to travel through the intersection. It is calculated as the time period from the vehicle is fully stopped until when the vehicle starts to accelerate. Acceleration delay begins when the vehicle starts to accelerate at the beginning of the green phase and ends when the vehicle gets the normal speed, which is the moving speed without any obstruction.
The accuracy of delay prediction is very important, however, it is a complex task to calculate delay because of its un-uniform arrival rate. Delay can be estimated by mea-surement in real traffic networks, simulation, and analytical models. Delay meamea-surement using analytical models are simple and convenient, as a result, they have been widely
used to estimate delay at a signalized intersection. There are a number of delay mod-els, which have been introduced to estimate average delay that a vehicle has to take at an intersection, for example, HCM 2000 delay model Board (2000) and Webster’s delay model, Webster (1958). However, these models are based on some assumptions, for example, vehicles arrive at the traffic light according to a Poisson process, to sim-plify the complex flow conditions to a quantifiable model to approximate delay,Mathew
(2014). Consequently, delay calculated using such models may not be accurate as the models are based on the theoretical concept onlyMathew(2014) and the actual traffic is highly dynamic and its characteristics cannot be adequately captured by mathematical formulations,Chen and Chang (2014).
B. Queue length
Queue length is a crucial indicator, which can be used to determine whether to stop discharging vehicles from an adjacent upstream intersection,Mathew (2014). Over the years, many studies have been conducted to determine the average queue length of traffic signals. Generally, queue length estimation approaches can be divided into two types,
Liu et al. (2009). The first type is based on cumulative traffic input-output, Sharma
et al. (2007), Webster (1958). This type of model can only be used when the queue
length is smaller than the distance between the intersection stop line and the detector installed on the road. The second type of queuing model is based on the behaviour of traffic shockwaves, Ban et al. (2011), Liu et al. (2009), Stephanopoulos et al. (1979). Shockwave theory can describe complex queueing processes but it has limitations, such as, these queuing models assume that the arrival rate of vehicles is known, which is not always satisfied, especially in congested situations.
C. Other Metrics
There are other metrics for assessing the performance of traffic signal control systems such as exhaust emissions, safety, and pedestrian level of service. In recent years, air pollution produced by vehicles is receiving increasing attention by researchers and policy makers. Tong et al. (2000) concludes that transient driving modes, for example, decel-eration and acceldecel-eration, produce more emissions than the steady-speed driving modes. As a result, air pollution is often more serious at signalized intersections. Thus vehi-cle emissions has been considered as a metric when assessing the impacts of proposed traffic signal control systems. It is the fact that traffic safety at signalized intersections
significantly contributes to road safety in urban areas. Several strategies and tools have been developed for safety assessment in urban traffic networks, HSM (2010),Pirdavani
et al. (2010). Pedestrian level of service in a signalized intersection measures its degree
of pedestrian accommodation. This measure directly relates to delay experience, safety, and comfort of pedestrian crossing an intersection, and it reflects the pedestrian friend-liness of an signalized intersection. A review on pedestrian level of service can be found
inKadali and Vedagiri(2016).
2.3
Traffic simulation
2.3.1 Introduction
In recent years, the rapid growth of ITS applications is generating an increasing demand for tools to support in designing and assessing the performance of proposed strategies. Traffic simulators are cost-effective tools to achieve these objectives. There are several reasons which make traffic simulators play an important role in traffic research area: (1) It is expensive and difficult to test and evaluate most proposed traffic strategies in real-world traffic networks; (2) For some studies, it is extremely difficult to establish ex-pected traffic parameters in order to set up the experimental environment in real-world traffic networks as in simulation models; (3) Traffic simulators are a powerful tool which allows users to determine the correctness and efficiency of a proposed strategy before it is actually constructed. Therefore, the overall cost of constructing a specific strategy would be reduced significantly. Users also can use traffic simulators to compare the con-sequences’ of a number of alternative strategies and improvement plans. Consequently, traffic simulators are one of the widely used methods in research of modelling and plan-ning as well as the development of traffic networks and systems,Kotusevski and Hawick
(2009).
Currently, there are several traffic simulation software, such as SUMO, VISSIM, MAT-Sim, AIMSUN, and Paramics. According to the level of detail which transport simula-tors can represent, they are divided into three categories: microscopic, mesoscopic, and macroscopic simulators. Macroscopic simulators describe the traffic at a high level of aggregation without considering its parts. They are mainly used in traffic flow analysis. The dynamics of every single vehicle are modelled by microscopic traffic models based
Figure 2.3: The structure of the node file of a traffic scenario simulated by SUMO, Krajzewicz et al.(2019).
Figure 2.4: The structure of the edge file of a traffic scenario simulated by SUMO, Krajzewicz et al.(2019).
Figure 2.5: The structure of the traffic light file of a traffic scenario simulated by SUMO,Krajzewicz et al.(2019).
on the interactions between the vehicles and their neighbourhood in detail. Mesoscopic traffic models have an intermediate level of detail, for instance, describing the individual vehicle without their interactions. Microscopic traffic simulation has proven to be a use-ful tool to support the evaluation process of ITS’s deployment, B D Venter and Barcelo
(2001). Comparative studies of traffic simulators can be found atPell et al. (2017) and
Figure 2.6: The Netconvert command to generate a traffic network file of a scenario simulated by SUMO, Krajzewicz et al.(2019).
Figure 2.7: The structure of the route file of a traffic scenario simulated by SUMO, Krajzewicz et al.(2019).
2.3.2 Simulation of Urban Mobility (SUMO)
Simulation of Urban Mobility (SUMO) is a well-known and widely used microscopic traffic simulators Kotusevski and Hawick (2009). SUMO is a microscopic traffic simu-lation package which is highly portable, open-source and created to handle large road networks. The development of SUMO started in the year 2000 and it is mainly devel-oped by employees of the Institute of Transportation Systems at the German Aerospace Centre to provide the traffic research community a tool to implement and assess their own studies. SUMO is multi-modal which means that not only car movements are mod-elled, but also public transports, such as bus and train networks, can be included in the simulation. Due to SUMO’s high portability, it may be used on different operating systems.
There are two main components to construct a traffic simulation using SUMO which are road network representation and traffic demand. The road networks represent real-world traffic network as directed graphs, where intersections and roads are represented by nodes and edges, respectively, and they are described in XML files. The nodes are declared in the node file. Figure2.3illustrates an example of a node file. The edges contains certain attributes such as the position, shape, and speed limitKrajzewicz et al.(2012) as shown in Figure2.4. A SUMO network also can contain traffic lights, roundabouts and other transport components. An example of the traffic light file is provided in Figure 2.5.
Figure 2.8: The structure of the configuration file of a traffic scenario simulated by SUMO,Krajzewicz et al.(2019).
All the information about road network are described in the net.xml file. SUMO road networks can be either generated from XML files or converted from other input data. “Netconvert” is a road network importer which is used to import road networks from other traffic simulators as Vissim, MATsim, or VISUM and produces road network that can be used by other tools in SUMO, Krajzewicz et al. (2019). Figure 2.6 de-scribes the Netconvert command. SUMO can also read other common formats such as OpenStreetMap. The existing road network file can be edited using NETEDIT tool,
Krajzewicz et al. (2019).
The second major component in SUMO scenarios is traffic demand defining routes of vehicles. The structure of a route file is provided in Figure2.7. Routes can be generated either by using existing origin/destination matrices (O/D matrices) and convert them into route descriptions or specifying them manually. The first approach is applied mostly within the traffic science when dealing with large real-world scenarios. The second one is used when the researchers would like to have their own wishes about the traffic movements of the scenarios, Krajzewicz et al. (2012). SUMO also can import routes from other simulations. Additional information such as traffic light timing data can be integrated into the traffic simulation through additional files.
After creating network and route files, a configuration file is generated to glue every files together and the simulation scenario can be visualized in the SUMO-GUI. The structure of the configuration file of a traffic scenario simulated by SUMO is shown in Figure2.8. A large number of measurements can be generated for each simulation run in SUMO. The output can be unaggregated vehicle-based information such as positions and speed
for every simulation step or aggregated information of vehicles in their journeys. SUMO also provides information about simulated detectors, traffic lights, and values for lanes or edges. Besides common traffic measures, other metrics such as noise emission, pollutant emission, and a fuel consumption are also included in SUMO,Behrisch et al. (2011).
2.4
Multi-objective evolutionary algorithms
2.4.1 Definition of Multi-objective Optimization Problems and Basic
Concepts
Optimization refers to maximizing or minimizing some functions to find a set of feasible solutions corresponding to optimal values of a single of multiple objectives. An optimiza-tion problem might consist of a single objective or multiple objectives. Single-objective optimization problem involves only one objective function while multi-objective opti-mization problems include several objective functions. The goal of optimizing a single-objective problem is to find the best solution which gives the minimum or maximum value of the problem depending on the requirement of the objective function. But for multi-objective optimization problems (MOOPs), there is often more than one optimal solution and it is complex to choose the best solution. Therefore, the decision maker has to choose one of the achieved solutions based on higher-level information. In the real world, optimization problems normally consist of multiple conflicting objectives with a number of constraints and multiple optimal solutions, namely Pareto solutions. Finding suitable trade-off solutions which provide acceptable performance over all objectives are the main aim of MOOPs.
MOOPs have a number of objectives needed to be either minimized or maximized si-multaneously while satisfying the constraints. Deb (2008) states the overall form of a MOOP as follows: Minimize/maximize fm(x) m∈[1, M]; subject to gj(x) = 0, j∈[1, J]; hk(x)≤0, k= 1,2, ..., K; x(Li)≤x(i)≤x(Ui) i∈[1, n]. (2.1)
where J and K are the numbers of equality and inequality constraints, respectively, which are needed to be fulfilled. There are M objective functions in this optimization problem. Objectives in MOOPs can be continuous or discrete and linear or non-linear. xis the decision vector includingndecision variablesx(i), i∈[1, n] whilex(Li)andx(Ui)are the lower and upper bounds for each decision variable x(i), respectively. These decision variables xi can be continuous or discrete. A feasible solution is a solution satisfying all
constraints and variable bound.
Here are the fundamental concepts in MOOPs, which are defined as follows,Deb(2008):
Decision variable space or decision space of a problem is its feasible space with all possible numerical amount that can be allocated to decision variablesxi of MOOPs. Objective space is the space including all possible values produced by the objective functions of a MOOP.
Domination: most MOOPs use the concept of domination to compare two solutions. For two decision solutionsx(u)andx(v),x(u)dominatesx(v)(or mathematically denoted
by x(u) x(v) ) if and only if x(u) is strictly better than x(v) in at least one objective and better or equal to x(v) in all objectives. Domination definition can be described
mathematically as:
x(u)x(v) if and only if xi(u) ≤x(iv)∧ ∃i∈[1, n] :x(iu)< xi(v),∀i∈[1, n]. (2.2)
Strong dominance: x(u) strongly dominatesx(v) (orx(u) ≺x(v)) ifx(u) is strictly better thanx(v) in all objectives.
x(u)≺x(v) if and only if ∀i∈[1, n] :x(iu) < x(iv) (2.3)
Weak dominance: x(u) weakly dominates x(v) if x(u) is better or equal to x(v) in all objectives.
Non-dominated set: the non-dominated set Q0 of a given set of solutions Q is a set including solutions that are not dominated by any solution in Q.
Pareto optimal solution: in the decision spaceX, a solutionx(i)is named Pareto optimal if and only if there exists no solutionx(j) thatx(j) dominates x(i).
Pareto-optimal set: ifP is the entire feasible search space, the non-dominated set Q0 of setQis then called the Pareto-optimal set. The Pareto-optimal setP0 of a given MOOP f(x) is defined as:
Q0 ={x∈X|@x0 ∈X :f(x)f(x0)} (2.4)
Pareto front: the corresponding objective vectors of Pareto-optimal set are referred to as the Pareto-front. The Pareto frontP F0 of a given MOOPf(x) and a Pareto-optimal set P0 is defined as:
P F0 ={−→u =f(x) = (f1(x), f2(x), ..., fn(x)|x∈P
0
} (2.5)
In MOOPs, the task is to find a set of well acceptable solutions which are as close as possible to Pareto-optimal set. There are many real-life problems for which it is quite hard for the decision-maker to correctly and completely formulate them. Furthermore, all efficient solutions cannot be found out within an acceptable time in these problems. Therefore, decision-makers tend to use approximated solutions in such situations,
Sang-hamitra Bandyopadhyay(2013).
2.4.2 General Framework of Multi-objective Evolutionary Algorithms
Multi-objective Evolutionary Algorithms (MOEAs) imitate principles of nature’s evo-lutionary process including reproduction, mutation, recombination, and selection to find multiple well acceptable solutions. Several characteristics of MOEAs are desirable for MOOPs and it has been used to solve MOOPs for more than one decade, Zitzler
et al. (2004). One of the critical differences between classical search methodologies and
MOEAs is that MOEAs use a set of potential solution candidates, namely population, in each iteration, instead of a single solution. This population is then transformed by the selection and variation principles. The first principle, selection, imitates the compe-tition for reproduction among living beings in nature. The other one, variation, mimics
Algorithm 1 Principal steps of a MOEA framework 1: Randomly initialize a population
2: Whiletermination conditions are not satisfied
3: Step 1: Mating selection
4: Step 2: Offspring generation
5: Step 3: Environmental selection
6: Step 4: Check the termination conditions
7: ReturnNon-dominated set of solutions
the natural ability to create “new” living beings using recombination and mutation. Al-though their working mechanisms are simple, MOEAs are proven to be robust, general, and powerful search approaches.
The fundamental principle of MOEAs is that it applies the principle of survival of the fittest to produce the next generation of solutions. The fittest individuals have a greater chance of survival than weaker ones. MOEAs randomly initialize a population of solutions, which are also called individuals, and then iteratively undergo four main steps which help to gradually increase the quality of the population and direct the solutions toward the Pareto front. Each iteration is also called a generation, and in most studies, a pre-defined maximum number of iterations is used as the termination condition of the loop. The basic principal steps of an MOEA framework are illustrated in Algorithm 1 and explained in the following sections,Cheshmehgaz et al. (2015).
Mating selection aims at choosing promising solutions for reproduction. The mating selection consists of two stages: fitness assignment and sampling. A fitness assignment strategy is needed in MOEAs to give a fitness value or a rank to solutions in the pop-ulation based on their objective functions and constraints. It makes solutions become comparable to other solutions. In general, fitness assignment strategies can be classified into Pareto-based fitness assignment strategies, criterion-based, and aggregation-based,
Konak et al. (2006). In the fitness assignment stage, each individual in the current
population is evaluated using objective functions and then is assigned a fitness value, reflecting its quality. After that, a so-called mating pool is created in the sampling stage using mate-selection strategies. Roulette wheel selection, introduced byHolland(1992), and binary tournament selections, proposed byGoldberg(1989), are two common mate-selection strategies. Roulette wheel mate-selection method selects an individual proportional to its probability which directly depends on its fitness. The implementation of this wheel selection follows a roulette-wheel mechanism. The percentage fitness values of solutions