Association Studies for Yield and its components in Green Gram
Reecha. T. Das* and Purna K. Barua
Department of Plant Breeding and Gene cs, Assam Agricultural University, Jorhat-785013, India. *Corresponding author: [email protected]
Paper No. 347 Received: 10 July 2014 Accepted: 18 August 2015
Abstract
Twenty three genotypes of green gram were studied for genetic variability, correlation and path analysis for eight economically important traits. The genotypes viz. SG1, MH 709, ML 1278, Pant M 4, SG 21-5, OGG 56, CGG 973, ML 1354 and RVSM 11 were found promising for seed yield per plant. In general, PCV were higher than the corresponding GCV values for all the characters, suggesting the infl uence of environment in the expression of these traits. The broad sense heritability were high for plant height followed by 100-seed weight, pod length, seed yield per plant, days to fl owering, seeds per pod, days to maturity, pod fi lling percentage and pods per plant . Seeds per pod, 100 seed weight, pods per plant, pod fi lling percentage and pod length showed signifi cant positive correlations with seed yield per plant both at phenotypic and genotypic levels. Path analysis revealed that seeds per pod had the maximum direct eff ect on seed yield followed by 100 seed weight, pod fi lling percentage and pods per plant. Therefore, main emphasis should be given on these traits during phenotypic selection for developing high yielding genotypes of green gram.
Highlights
● Correlation and path analysis was studied in 23 green gram genotypes
● Seeds per pod, 100 seed weight and pods per plant were potential selection criteria for improvement of green gram yield.
● Genotypes exhibiting higher performance for the above mentioned characters can be used as parents for yield improvement
Keywords:Genetic variability, correlation, path analysis, green gram
The grain legumes or the pulses are important food grains of the world a er the cereals. Pulses are main source of dietary proteins, and they contain about three times more proteins than the cereals. Green gram or mungbean (Vigna radiata (L.) Wilczek) is an important pulse crop grown extensively in both tropical and sub-tropical regions of the world. In addition mungbean is also known for its easy digestibility and non-fl atulence behaviour. Although numbers of varieties have been recommended for cultivation
the productivity is very low which may be a ributed to narrow genetic base of the varieties resulting in low yield potential and susceptibility to biotic and abiotic stresses. To increase its yield potential several genetic improvement methods have been employed. Existence of adequate genetic variability is a pre-requisite for the genetic improvement of any crop. Similarly, the correlation and path analysis studies are of great help in formulating effi cient scheme of multiple trait selection. Thus, knowledge on genetic DOI Number: 10.5958/2230-732X.2015.00086.8
variability, heritability, genetic advance, correlation and path analysis is essential for a breeder to choose best genotypes and to decide the correct breeding methodology for crop improvement. With these objectives, the present investigation was undertaken for the genetic improvement of green gram.
Materials and Methods
The experiment was conducted during summer season, at the Instructional Cum Research Farm (ICR), Assam Agricultural University, Jorhat in a randomized block design with three replications. Each genotype was grown in 4-row plots, 6 m long with 30 X 10 cm spacing. The experimental material comprised of twenty three genotypes of green gram viz. MH 709, ML 1354, KM 2272, GM 04-02, Pusa 0972, RMG 987, NM 1, IPM 02-09-1, Pant M-4, MH 721, SG 63-14, Pusa 0971, RVSM 11, GM 05-08, SG 33-5, KM 2268, CGG 973, SG 21-5, ML 1278, MGG 360, OGG 56, SG 1 (Pratap) and NDMZ 09-18. The recommended packages of practices were followed to raise the crop. Data on the basis of fi ve randomly selected competitive plants were recorded on seed yield per plant (g), 100 seed weight (g), pod fi lling percentage, pod length (cm), number of seeds/ pods, number of pods/ plant, number of primary branches/ plant, days to maturity, days to 50% fl owering. The genotypic and phenotypic correlation coeffi cient of all the characters was worked out through covariance analysis as per Al-Jibouri et al. (1958). The path analysis was carried out with the formula as given by Dewey ad Lu (1959) considering yield as the dependable variable and yield component characters as independent characters.
Results and Discussion
The association analysis among ten characters at genotypic and phenotypic levels is given in Table 1, respectively. In general, genotypic correlation coeffi cients were of higher magnitude than the corresponding phenotypic correlation coeffi cients. The highest genotypic and phenotypic coeffi cients of variation were observed for seed yield per plant. The other characters that showed relatively high
genotypic variation are seeds per pod, plant height and pods per plant. Similar results were also reported by Narashimhulu et al.(2013) and Garge et al.(2014) for number of pods per plant and seed yield yield per plant.100-seed weight and pod length showed moderate level of genotypic variation. The highest estimate of heritability in broad sense was recorded
Table 1. Estimates of genetic parameters for different characters in green gram
Character PCV (%) GCV (%) h 2 b.s.(%) GA (%) Days to 50%
fl owering 9.31 9.12 95.89 18.39
Plant height 18.97 18.37 98.88 37.63
Pods/plant 16.47 15.19 85.13 28.88
Pod length 11.16 11.00 97.14 22.34
Seeds/pod 20.04 19.43 93.99 38.80
Pod fi lling percentage 9.69 9.14 89.05 17.78
100 seed weight 12.09 12.02 98.83 24.62
Seed yield/ plant 29.58 28.65 96.31 58.29
be more eff ective for these characters compared to the others. Similar fi ndings were reported by Rahim et al.(2010) for seed yield per plant, plant height and seeds per pod in green gram. Siddique et al. (2006)
also reported high heritability coupled with high genetic advance for seed protein, plant height, and test weight in this crop.
Table 2. Genotypic (upper diagonal) and phenotypic (lower diagonal) correlation coeffi cients between different characters in green gram
Days to 50% fl owering
Plant height
100 seed
weight Pod length Seeds/ pod
Pods/ plant
Pods fi lling%
Seed yield/ plant
Days to 50% fl owering 0.295 0.08 0.019 0.088 -0.289 -0.077 0.179
Plant height 0.288 -0.031 -0.004 0.095 -0.13 0.233 0.307
100 seed weight 00.08 -0.028 0.415* 0.546** 0.266 0.238 0.678**
Pod length 0.012 -0.012 0.404 0.628** 0.494* 0.308 0.454*
Seeds/ pod 0.094 0.092 0.526** 0.608** 0.477* 0.121 0.692**
Pods/ plant -0.264 -0.119 0.234 0.439* 0.422* 0.253 0.522*
Pod fi lling% -0.078 0.223 0.222 0.281 0.099 0.206 0.530*
Seed yield/plant 0.175 0.304 0.673** 0.447* 0.669** 0.480* 0.502*
*Signifi cant at 5 % probability level **Signifi cant at 1 % probability level
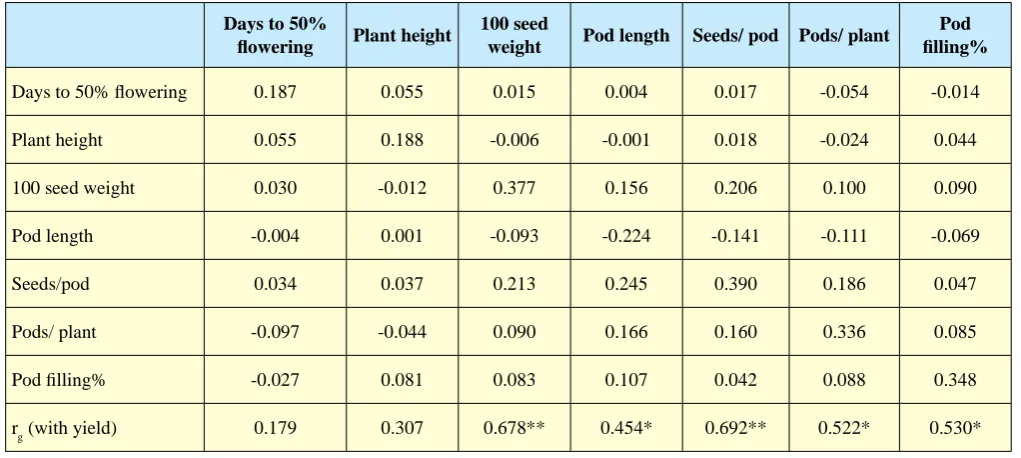
Table 3. Direct (diagonal values in bold face) and indirect effects of component characters on seed yield per plant in green gram
Days to 50%
fl owering Plant height
100 seed
weight Pod length Seeds/ pod Pods/ plant
Pod fi lling%
Days to 50% fl owering 0.187 0.055 0.015 0.004 0.017 -0.054 -0.014
Plant height 0.055 0.188 -0.006 -0.001 0.018 -0.024 0.044
100 seed weight 0.030 -0.012 0.377 0.156 0.206 0.100 0.090
Pod length -0.004 0.001 -0.093 -0.224 -0.141 -0.111 -0.069
Seeds/pod 0.034 0.037 0.213 0.245 0.390 0.186 0.047
Pods/ plant -0.097 -0.044 0.090 0.166 0.160 0.336 0.085
Pod fi lling% -0.027 0.081 0.083 0.107 0.042 0.088 0.348
rg (with yield) 0.179 0.307 0.678** 0.454* 0.692** 0.522* 0.530*
The yield is a complex character and depends on a number of yield a ributing traits. In order to understand the inter-character associations among diff erent yield contributing characters, it is necessary to interpret correlation in the crop plants. Between yield components, 100 seed weight showed signifi cant positive correlations at genotypic and phenotypic levels with seeds per pod. Seeds per pod was positively correlated to pod length and pods per plant. On the other hand, pod fi lling percentage was positively correlated to only seed yield per plant at both levels of analysis.
Knowledge on association of seed yield with diff erent characters as well among the component characters is very much important for breeders to formulate an eff ective breeding programme. Seed yield per plant showed signifi cant positive correlation with 100 seed weight, pod length, seeds per pod, pods per plant and pod fi lling per cent. Similar positive correlations for pods per plant by Ahmad et al. (2015) . Kousar et al.(2007) observed that seeds per pod and pods per plant were positively correlated for with seed yield per plant. This indicates that selection based on 100 seed weight, pod length, seeds per pod, pods per plant and pod fi lling percentage might result in improved yield. Among these yield components seeds per pod exhibited high estimates of heritability (broad sense) and genetic advance with relatively good genotypic variation. This character could be a very useful selection criterion for improvement of seed yield in green gram.
To partition the genotypic correlation coeffi cient between a component trait and seed yield per plant into direct and indirect eff ects on seed yield, path coeffi cient analysis was adopted. These direct and indirect eff ects are presented in Table 3. Path analysis revealed that seeds per pod had the maximum direct eff ect on seed yield followed by 100 seed weight, pod fi lling percentage and pods per plant. Previously high positive direct eff ect by seeds per pod was reported by Patel et al.(2014) and pods per plant and 100 seed weight on seed yield per plant was reported by Tabasum et al. (2010). Considerable positive indirect eff ects of seeds per pod via 100 seed weight and pods per plant, and
negative indirect eff ect through pod length were observed. Positive indirect eff ects of 100 seed weight via seeds per pod. In addition, the indirect eff ects of pod per plant via seeds per pod and 100 seed weight were also non-negligible. Pod length showed negative direct eff ect on seed yield per plant but its correlation with yield was positive. The positive correlation was mainly due to positive indirect eff ects through seeds per pod, 100 seed weight, pod fi lling percentage and pods per plant.
Therefore, from correlation and path analysis it could be concluded that the characters seeds per pod, 100 seed weight, pod fi lling percentage and pods per plant, which exerted positive direct eff ects and were positively correlated with seed yield per plant, deserve consideration in breeding programme as selection criteria to bring about improvement in seed yield. Earlier in analysis of genetic parameters, it was concluded that apart from seed yield per plant, seeds per pod, pods per plant, plant height and 100 seed weight could be eff ective selection criteria. Thus by considering both genetic parameters and character relationships, three characters viz. seeds per pod, 100 seed weight and pods per plant were potential selection criteria for improvement of green gram yield.In a study on genetic variability, correlation and path analysis in green gram, Khanpara et al. (2012) found similar positive direct eff ects of pods per plant and seeds per pod on seed yield. Kumar et al.(2013) also reported high positive direct eff ect of number of pods per plant, number of grains per pod and 100 seed weight on grain yield.
Thus, correlation and path coeffi cient analysis revealed that 100 seed weight, pod length, seeds per pod, pods per plant and pod fi lling percentage were positively correlated with seed yield both at genotypic and phenotypic levels. Seeds per pod, 100 seed weight, pod fi lling percentage and pods per plant exhibited positive direct eff ects on seed yield per plant.
Conclusion
studied.By considering both genetic parameters and character relationships, three characters viz. seeds per pod, 100 seed weight and pods per plant were potential selection criteria for improvement of green gram yield, apart from possible eff ectiveness of selection for seed yield per plant.The estimate of residual eff ects was high (0.354). That means yield a ributing characters considered in the present investigation explain only 65% of variability in seed yield, indicating possibilities of some other characters eff ecting seed yield per plant.
References
Ahmad, H.B., Rauf, S., Hussain, I., Rafi q, C.M., Rehman, A.U., Aulakh, A.M. and Zahid, M.A. 2015. Genetic variability, association and path analysis in mung bean (Vigna radiata L.). International Journal of Agronomy and Agricultural Research6(6): 75-81.
Al-Jibouri, N.A., Miller, F.A. and Robinson, H.P. 1958. Genotypic and environmental variances, covariances in an upland co on cross of interspecifi c origin. Agronomy Journal50: 633-637.
Biradar, S., Kaveri, S., Salimath, P.M. and Ravikumar, R.L. 2007. Genetic studies in green gram and association analysis. Karnataka Journal of Agricultural Sciences 20(4): 843-844.
Burton, G.W. 1952. Quantitative inheritance in grasses.Proc 6th Grassland Cong.,1: 277- 281.
Dewey, D.R. and Lu, K.H. 1959. A correlation and path coeffi cient analysis of components of crested wheat grass seed production.Agronomy Journal51: 515 – 518.
Garje, U.A., Bhailume, M.S., Nagawade, Deepak, R. and Parhe Sachin, D. 2014. Genetic association and path coeffi cient analysis in green gram [Vigna radiata (L.) Wilczek].Journal Food Leg.27(2): 151-154.
Gul, R., Ali, S., Khan, H., Nazia, Ali, F. and Ali, I. 2007. Variability among mungbean (Vigna radiata) genotypes for yield and yield components grown in Peshwar valley.J. Agric. Bio. Sci.2(3): 5-9.
Hakim, L. 2008. Variability and correlation of agronomic characters of mungbean and their utilization for variety improvement program. Indonesian Journal of Agricultural Science9(1): 24-28.
Khanpara, M.D., Vachhani, J.H., Jivani, L.L., Jethava, A.S. and Vaghasia, P.M. 2012. Correlation and path coeffi cient analysis in greengram (Vigna radiata (L.) Wilczek).Asian Journal of Bio Science 7(1): 34-38
Kousar, M., Abrahim, G., Jan, A. and Singh, A.K. 2007. Genetic variability and correlation studies on yield and its components in mungbean (Vigna radiata (L.) Wilczek). J.
Agronomy6: 216-218
Kumar, K., Prasad, Y., Mishra S.B., Pandey, S.S. and Kumar, R. 2013. Study on genetic variability, correlation and path analysis with grain yield and yield a ributing traits in green gram [Vigna radiata (L.) Wilczek].The BioScan8(4): 1551-1555.
Narasimhulu, R., Naidu, N.V., Priya, M.S., Rajarajeswari, V. and Reddy, K.H.P. 2013. Genetic variability and association studies for yield a ributes in mungbean (Vigna radiataL. Wilczek).Indian Journal of Political Science2(3):82-86. Patel, S.R., Patel, K.K. and Parmar, H.K. 2014. Genetic
variability, correlation and path analysis for seed yield and its components in green gram [Vigna radiata (L.) Wilczek].
The Bioscan.9(4): 1845-1847.
Rahim, M.A., Mia, A.A., Mahmud, F., Zeba, N. and Afrin, K.S. 2010. Genetic variability, character association and genetic divergence in mungbean (Vigna radiata L. Wilczek).Plant Omics J.3(1).1-6.
Siddique, M., Malik, M.F.A. and Awan, S.I. 2006. Genetic divergence, association and performance evaluation of diff erent genotypes of mungbean (Vigna radiata).
International Journal of Agricultural and Biological Engineering
8(6): 793-795.