Available Online At www.ijpret.com
INTERNATIONAL JOURNAL OF PURE AND
APPLIED RESEARCH IN ENGINEERING AND
TECHNOLOGY
A PATH FOR HORIZING YOUR INNOVATIVE WORKIDENTIFICATION OF NITROGEN DEFICIENCY IN COTTON PLANT BY USING IMAGE
PROCESSING
SWAPNIL S. AYANE, M. A. KHAN, S. M. AGRAWAL
Department of Electronics & Telecommunication Engineering, Babasaheb Naik College of Engineering, Pusad, Dist-Yavatmal.
Accepted Date:
27/02/2013
Publish Date:
01/04/2013
Keywords
Cotton,
Histogram,
Deficiency,
Leaf Area,
Image Processing
Corresponding Author Mr. Swapnil S. Ayane
Abstract
In a research of identifying and diagnosing plant diseases, the
patterns that appeared on the leaf are considered as important
concept in detection of these diseases occurred because of nutrient
deficiencies in the plant. The various features of image of leaf are
extracted such as the shape of leaf, area of leaf, shape of holes
present on the leaf, disease spots etc. These features could be
extracted using different image processing techniques. The feature
extraction is the key point of proposed work. These extracted
features are used to determine the occurrence of the particular
deficiency related to primary nutrients of cotton plant. Improper use
of pesticide for plant diseases treatment increases the cost and
environmental pollution so their use must be appropriate. This can be
achieved by targeting the nutrient deficiency using image processing
Available Online At www.ijpret.com
INTRODUCTION
As India is an agricultural country and 70%
of the population depends on agriculture.
Observers have wide range of diversity to
select particular fruit and vegetable crop
for optimum throughput. However the
cultivation of these crops for optimum
yield and quality product is highly
technical. It can be further increased by
the aid of technological support. The
world textile industries are being ruled by
“Cotton King” and India is recognized as
cradle of cotton industry. India thus
enjoys the distinction of being the earliest
country in the world to domesticate
cotton and utilize its fiber to manufacture
the fabric. Maharashtra is the important
cotton growing state in India with 31.33
lacks hectors area and production of
approximate 62 lack bales. The second
largest producer of cotton in the world,
about 3 million observers is engaged in
cotton cultivation in the state mostly in
backward region of Marathwada and
Vidarbha. [1]
Generally the visual observation of the
pattern appearing on the leaf of plant, the
observer used to decide which fertilizer to
be used but no idea how much? Hence
sometimes wastage of money and
overdose of fertilizer may disturb the life
cycle of plant as well as surrounding.
The cotton leaf mainly suffers from the
diseases like foliar leaf spot of cotton,
fungus, viral diseases. About 80% to 90%
of diseases reflect the symptoms on the
leaves of cotton plant. Hence we are
focusing on the pattern changes in the
leaf of cotton. These diseases mainly
occurs due to the deficiency of
nutrients[1].The image processing now a
day’s become the key technique for the
diagnosis of various features of the crop,
providing new approach to explore the
field of agriculture. The image processing
can be used in the agricultural
applications for the following purposes. [2]
1. To detect diseased leaf, stem, fruit.
2. To determine affected area by disease.
3. To find shape of affected area.
4. To determine the size and shape of fruits.
This work proposes the fast and accurate
solution to analyze the different patterns
caused due to different deficiencies in the
plant of cotton by using image processing
techniques.
Available Online At www.ijpret.com
Here proposed approach for the detection
of nutrient deficiency in cotton crop is by
processingthe captured image through
MATLAB. In this proposed method the
image captured by using SONY CIBERSHOT
14 MP digital camera is preprocessed for
the noise removal. Since all the nutrient
deficiencies results in variations in
attributes that appears on leaf. These
variations in the features are measured
with respect to healthy leaf. The feature
extraction may involve Spectral features,
spectral parameters, Geometric features
and Textural features.
DETERMINATION OF NITROGEN
Nitrogen Deficiency Symptoms
There are sixteen nutrient elements
required for normal growth of crop. Three
basic elements Carbon (C), Hydrogen (H),
and Oxygen (O2) are taken up from
atmospheric carbon dioxide and water.
Thirteen other nutrients are taken up
from the soil and are usually grouped as
Primary, Secondary, and micronutrients
[3]
.
There are three primary nutrients. These
are utilized in the largest amount for the
crops, and therefore are applied at higher
rates than secondary and micronutrients.
Plant requires nitrogen which is one of the
major of the three nutrients. It is
responsible for the chlorophyll
manufacture through photosynthesis.
Nitrogen is usually concentrated in the
growing points of the plant. Nitrogen
deficiency shows following symptoms.
1. It influences both rate, and extent of
growth.
2. A pale yellowish green color coupled
with reduction in leaf size is the most
striking symptom of nitrogen deficiency in
cotton.
3. It also results in to stunted growth.
Visual symptoms are seen first on older
leaves as a yellowing from the leaf tip and
along the midrib while the edges remain
green. By considering the various
parameters such as change in the size,
color etc. following steps can be taken to
extract the various features to detect the
deficiency [4].
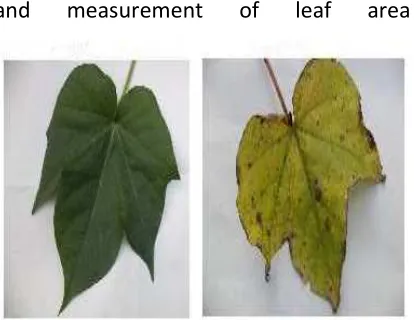
Image Acquisition
Nearly 25 photographs of cotton leafs of
same plot are taken for the analysis as
shown in figure 1. These images are saved
in JPEG format for further processing
[5]
.Nitrogen deficiency can be detected by
Available Online At www.ijpret.com
and measurement of leaf area
Figure 1. Sample cotton leaf Images Histogram analysis
Algorithm:
1. Read the image.
2. Convert RGB to Grayscale image.
3. Plot the histogram.
The algorithm is repeated for the
healthy as well as visually deficient leaf.
Input RGB image of healthy leaf is first
transformed in to gray scale image to plot
the histogram. Same steps are carried out
for plotting the histogram of deficient leaf.
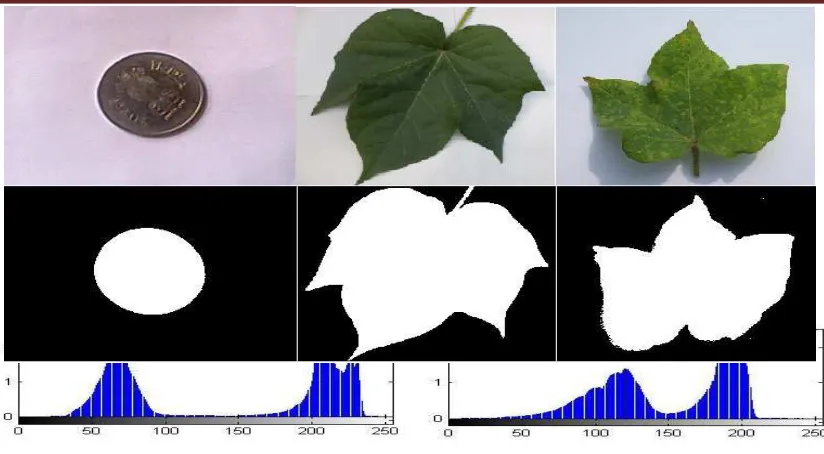
From the obtained histogram shown in
figure 2. Following points are concluded.
1. Histogram of normal leaf is
concentrated symmetrically at certain
value on the gray scale.
2. Histogram of normal leaf has maximum
peak occurs generally about 30% and 90%
of dynamic range. This indicates frequency
of occurrence of single color in leaf.
3. Histogram of deficient leaf has non
symmetric shape at certain values on gray
scale. Narrow downs the dynamic range
than the healthy leaf.
4. Histogram of deficient leaf has smaller
peak amplitude than that of normal.
These peaks occurs generally about 50%
and 70% of dynamic range of normal
plant.
Measurement of leaf area
Leaf area is one of the most important
feature that describes the deficiency of
leaf [6]. In case of nitrogen deficiency, the
Available Online At www.ijpret.com
Figure 2.Histogram for Normal & Deficient leaf.
leaf size gets reduced than that of normal
leaf hence by calculating the area of
deficient leaf and comparing it with that of
healthy leaf, it is possible to conclude that
the leaf is nitrogen deficient or not. The
algorithm is repeated for the reference
object, healthy leaf as well as visually
deficient leaf.
Algorithm:
1. Read the image.
2. Convert RGB to Grayscale image.
3.ConvertGrayscale image to Binary Image.
4. Remove noise.
5. Calculate the leaf area.
Photographs captured as shown in figure 1 is processed by Matlab code in two colors. The function regionprops in Matlab is used to measure area of a selected region of an image in pixel count. Before applying the function regionprops, the actual image converted into a binary image as shown in figure.3.Regionprops instruction is used to estimate area enclosed. The area is the actual number of pixels in the selected region. Leaf area is calculated through pixel number statistic. Unit pixel in the same digital images represent the same size hence from known reference area and pixel count, unit pixel size can be calculated, so that it is easy to calculate leaf area by counting total pixel in leaf area region. The pixel count of the processed image depends
Available Online At www.ijpret.com
on the distance between the camera and
the object whenthe picture is taken. Smaller
the distance, the larger the pixel counts. A
reference object is an object withknown
area, needed to translate the pixel count to
area.
Here One Rupees coin is used as reference
object whose area is given as follows.
(Acoin)= 4.9063 cm2
The pixel count (Pcount)of the coin from the
image is 8144Hence,
Unit pixel value (Upx) = 0.0006024cm2.
The pixel count of the healthy leaf (PHleaf) is
5954059 pixels.
Hence,
Area of Leaf (AHeaf) = 3586.98cm2.
The pixel count of the deficient leaf (PDleaf) is
1287554 pixels.
Hence,
Area of Leaf (ADeaf) = 775.622cm2.
RESULTS AND DISCUSSIONS
The leaf with deficiency has reduced area
compared to that of normal leaf. To test the
performance of the deficiency detection
system, leaves are selected from different
plots and different varieties of cotton.
It is possible to detect the deficiency of
other plants like, Sugarcanes, Maize, and
betel by this method. One can compare the
results of area measurement with the
standard methods.
REFERENCES
1. Viraj A. Gulhane, Dr. A. A. Gurjar.
“Detection of Diseases on Cotton leaves and its possible Diagnosis”, JIP, Volume (5), Issue (5):2011.
2. Jaymala K. Patil, Raj Kumar, “Advances
in Image Processing for Detection of Plant
Diseases.”Journal of Advanced
Bioinformatics Application and Research, Vol.2, Issue 2, June-2011, Pp135-141.
3. J. A. Silva, R. Uchida. “Essential Nutrients
for plant growth: NutrientsFunctions &
Deficiency symptoms”,Plant nutrient
management, Approachfor tropical and Subtropical Agriculture,2000
4. Hezhong Dong, Wei Tang, Zhenhuai Li.
“On Potassium Deficiency in cotton
Disorder, Caused and Tissue Diagnosis”. Agricultural conspectus Scientifics’, Vol.69 (2004) No.2-3(77-85).
5. Sanjay B Patil, Dr. S. K. Bodhe,” Leaf
Diseases severity measurement using Image
Processing” International Journal of
Available Online At www.ijpret.com
6. Sanjay B Patil, Dr. S. K. Bodhe, “Betel
Leaf Area Measurement Using Image Processing,” IJCSE, Vol 3.No 7, July2011, pp.2856-2660
7. Sanjay B Patil, Dr. S. K. Bodhe, “Image
processing Method to measure Sugarcane Leaf area, “JEST, Vol.3,No.8 Aug.2011
8. Enrique Rico-Garcia, Fabiola Hernandez,
“Two new methods for theEstimation of
leaf area using digital photography”
International Journal of agriculture and Biology, ISSN Online: 1814-9596, 2009.
9. H. Al-Hiary, S. Bani Ahmad. “Fast and
Accurate Detection and classification of plant diseases” IJCA (0975-8887), Volume 17-No.1 March 2011.
10.AH Prakash, SESA Khader “Nutritional