Android APP Development of Remote Wireless Automatic
Meter Reading System based on 3G
https://doi.org/10.3991/ijoe.v13i02.6439
Lei Feng
Harbin Institute of Technology, Harbin, China [email protected]
Chuang Yang
Nanjing Research Institute of Electronics Engineering, Nanjing, China [email protected]
Wenbin Zheng*
Harbin Institute of Technology, Harbin, China [email protected]
Ping Fu
Harbin Institute of Technology, Harbin, China [email protected]
Abstract—Urban water supply pipe network is critical infrastructure for the survival of people. Efficient operation of equipment, water supply and water safety has always received great attention from the government and operators. The existing way of manual meter reading and manual inspection has the draw-backs of inefficient time and labor consumption. To solve this problem, we de-veloped databases, software platforms and mobile terminal APP (Application) based on Android operating system to integrate a remote wireless automatic meter reading system based on the existing remote wireless automatic reading meter devices which are our previous research work. The system realizes the remote monitoring of the pipe network, and it also realizes the remote control of the monitoring nodes, such as the camera shooting, selection of monitoring node's working mode and so on, which data feedback is accurate and timely, monitoring methods is simple, fast and efficient. In addition, compared to tradi-tional methods, the system greatly reduced the manpower and resources, reduce monitoring costs. And the tests and experiments show this remote wireless au-tomatic meter reading and control system is useful and effective.
1
Introduction
Freshwater resources are necessary for human survival, and China is one of the countries whose water resources are the least per capita [1]. The IT market survey of global water industry shows that the promising market has attracted many internation-al companies to participate in the development of smart water network [2].
The United States, Australia have implemented the theme of water information service network and so on [3-5]; In China, Shanghai, Beijing, Wuxi city, Hainan province, Shandong province, Shanxi province and other areas are the first step to start the related work to construct distinctive water network project[6][7].
Objectively compare the current development of domestic and foreign in hardware technology of Water monitoring system, China has the same level compared with other developed countries, but there is a certain gap in software between China and international advanced level. Especially in the data collection and troubleshooting, our basic approach is the use of artificial, which is time-consuming and there are a number of other drawbacks, for example, statistics are not accurate, the operation is difficult to standardize, data collection is not timely, high cost, low efficiency and so on[8]-[10].
Summarizes the domestic and foreign various "experience of smart water network" practice, can get the following conclusions:
1.Practice of "smart water network" is inevitable product of parallel development of
the process of water demand and information process in a certain stage
2."Smart water network" is the mainstream of the current development trend of the
water industry, which is reflected in the long-term planning in many countries.
3.The application of intelligent network "continue to expand, gradually evolved into
a comprehensive modern water carrier.
4.The "smart water network" has not formed the top-level design framework and
sys-tem of academic achievements.
Based on the remote wireless automatic meter reading equipment which is our pre-vious research work, the remote wireless automatic meter reading and control system had been developed in software to monitor the data of urban water network status. The development of this system makes the monitoring of the water more efficiently and quickly, which has important significance to the further realization of the smart water network.
The outline of the paper is as follows, the overall design described in Section II. The design of database and server is in Section III. Section IV described the every function of the APP in details, and then test the function, database, server and perfor-mance in different platforms in Section V. Conclusions are summarized in Section VI.
2
The Overall Scheme Design of our System
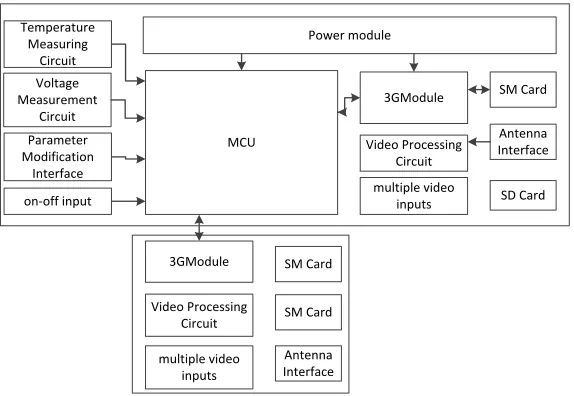
We use the remote wireless automatic meter reading devices as the monitoring nodes, which has been completed in our previous research work. It implements net-work selection, camera and video recording, sensor signal acquisition, low power, configuration parameters, time synchronization and working condition monitoring and other functions demand. The monitoring nodes provide data for the entire system, as well as they are the final actuator of the system. The general design of the system hardware is showed in Figure 2, it is divided into two parts, the motherboard and the back board. Motherboard has voltage, temperature and other multi input interface to achieve the basic functions. The back board mainly provides another set of communi-cation module, in order to realize the optimization of the three kinds of network sys-tem.
Fig. 1. Schematic diagram of remote wireless automatic meter reading system
!"#
$%&'()*%+,-'
./!%+,-'
01+'%)$(%2'33145) "1(2,16 *,-617-')81+'%)
147,63 %49%::)147,6
$;(;*'6'() !%+1:12;61%4)
<46'(:;2' 0%-6;5') !';3,('*'46)
"1(2,16 ='*7'(;6,(')
!';3,(145) "1(2,16)
>?)";(+ >!)";(+
./!%+,-'
01+'%)$(%2'33145) "1(2,16
*,-617-')81+'%) 147,63
>!)";(+
>!)";(+
@46'44;) <46'(:;2'
@46'44;) <46'(:;2'
!"#$%"&'()*$+)'
(,%,-,.)'/)&*)& 0&,#.1$..$"# 2"3%,4)
0)15)&,%6
&) 76&&)#%
8//9 :)%;"&<'
0=5)
0$1) >$+%6&)
7,1)&,' +"#%&"3
?3,&1'
1"@) 73),&'/(
0$1)' 9#%)&*,3
/)#."&' +"#%&"3
#
A
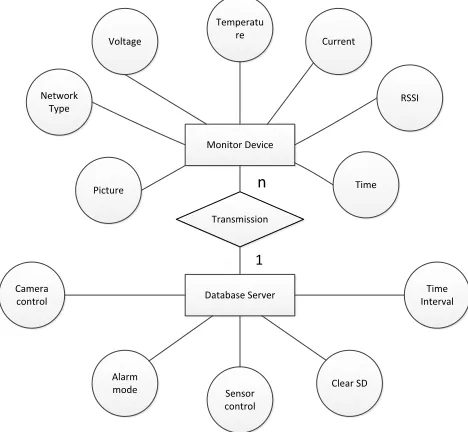
Fig. 3. The relationship between the device and server
We use database to store all kinds of data, and design appropriate database server program to establish a database server on the PC (personal computer), which is the link between managers and remote wireless automatic meter reading devices. Here we use PC to test our program, if it is used by the factory, we would choose Server or cloud storage on line. On one hand, the service programs exchange data with the re-mote wireless automatic meter reading devices and the data is received, parsed and stored into the specified data table. On the other hand, it also provides an interface to the management staff for remote access, therefore managers can keep abreast of all aspects of the water supply network information.
And the ER diagram of the monitoring node and the database server is shown in Figure 3. Monitor nodes provide on-site monitoring data for the database, the data-base provides control commands for the monitor node.
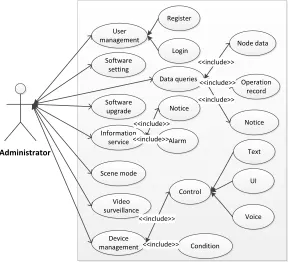
Handheld APP sends and receives data through the handle terminal. The APP is a more convenient way to get the status of water supply network information, the APP has functions of user management, software configuration, software upgrade, scene mode, video surveillance, information service, data query, equipment management and alarm. APP has become the focus of the development of this system because it is easy to carry, easy to use and timely feedback.
3
Design of Database Server
system design. In the project, we use eclipse to design our database which we chose Oracle.
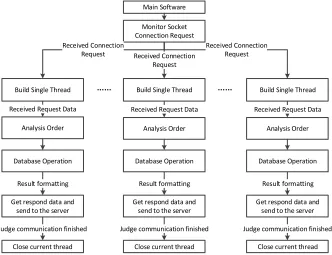
In the eclipse development environment, the database server is developed by java language. Figure 4. Shows the organization of our server, all the function would be applied by it.
The database server consists of two parts.
!"#$%&'()*"+,
!'$#)'+%&'-.,)% /'$$,-)#'$%0,12,3)
42#56%&#$75,%89+,"6 42#56%&#$75,%89+,"6 42#56%&#$75,%89+,"6
:$"5;3#3%<+6,+ =")">"3,%<?,+")#'$ @,)%+,3?'$6%6")"%"$6% 3,$6%)'%)9,%3,+A,+ /5'3,%-2++,$)%)9+,"6 0,-,#A,6%/'$$,-)#'$ 0,12,3) 0,-,#A,6%/'$$,-)#'$
0,12,3) 0,-,#A,6%/'$$,-)#'$0,12,3)
0,-,#A,6%0,12,3)%=")" 0,325)%('+B"))#$7 C267,%-'BB2$#-")#'$%(#$#39,6 :$"5;3#3%<+6,+ =")">"3,%<?,+")#'$ @,)%+,3?'$6%6")"%"$6% 3,$6%)'%)9,%3,+A,+ /5'3,%-2++,$)%)9+,"6 0,325)%('+B"))#$7 C267,%-'BB2$#-")#'$%(#$#39,6 :$"5;3#3%<+6,+ =")">"3,%<?,+")#'$ @,)%+,3?'$6%6")"%"$6% 3,$6%)'%)9,%3,+A,+ /5'3,%-2++,$)%)9+,"6 0,325)%('+B"))#$7 C267,%-'BB2$#-")#'$%(#$#39,6 0,-,#A,6%0,12,3)%=")" 0,-,#A,6%0,12,3)%=")"
Fig. 4. The organization chart of the server
The first part is the database which we chose is Oracle 11, it has many advantages [9][10]:
1.Support multiple users, event handling: Oracle supports multiple users, large
amount of data work load.
2.Data security and integrity control: Oracle limits the user to use the database
through the permissions settings. Controlling user access to the database, imple-menting the database audit and tracking the database are in order to monitor the use of the database.
3.Provide interface to database operation: Oracle provides interfaces for applications,
software, high-level languages, and heterogeneous database to access databases.
4.Support distributed data processing: Using the distributed computing environment,
we can make full use of the computer network system, so that the hardware and da-ta resources in different regions can be shared.
!"##$%&'($)*$)
+,#-'.)$/'0#1")2/&,"#
($3$%&'.)$/
+,#-'4$*,%$5',#' &6$'.)$/
7833'9$1)$56 4)":'4";#'<"/-,#=
7833'9$1)$56 4)":'4";#<"/-,#=
($3$%&'4$*,%$
>,$;'&6$'-/&/'"1' &6$'4$*,%$
7833'9$1)$56 4)":'4";#'<"/-,#=
($3$%&'4/&$'/#-' ?,2$ >,$;'4$&/,3' 0#1")2/&,"#
>,$;'@,5&")A'+,= 4/&/'?/='!"))$%&
B$5
C"
Fig. 5. The research flow diagram between the device and server
Figure 5 shows the research flow diagram of our APP, we can use “Pull Refresh” and “Drop Down Loading” to refresh the view of the APP.
The second part is the part of the database server program. This part consists of three modules: communication, analysis and storage, data maintenance. The commu-nication module is responsible for the work of the network commucommu-nication part, in-cluding receiving data, sending back information and forwarding instructions. Data analysis and storage module unpack the data, and store to the database table according to the specified data packet information. Maintenance module is responsible for oper-ations to the data table in the database to add, delete, modify information, and other basic maintenance. Use Socket to connect between remote wireless automatic meter reading device, APP and database server, and use heartbeat packets to maintain Sock-et long connection. Use JDBC (Java Data Base Connectivity) connection database to achieve access to the database and operation. JDBC is one type of Java API (Applica-tion Program Interface) with execute SQL (Structured Query Language) statement provide unity visit for multiple relationship database [11, 12]. In order to achieve a multi-client access server, the multi thread mode is used to establish in the Socket connection, and each client accesses the data stream in a single thread.
In the data analysis, storage and maintenance modules, the returned data by the monitoring node, which could be stored according to its geographical name in the database of the corresponding data sheet. For the uploaded data from handheld termi-nal APP, it needs to be atermi-nalyzed to determine the content, and carry out the corre-sponding operation. For example, if upload content is "area", all geographical names will be return, and displayed at the APP.
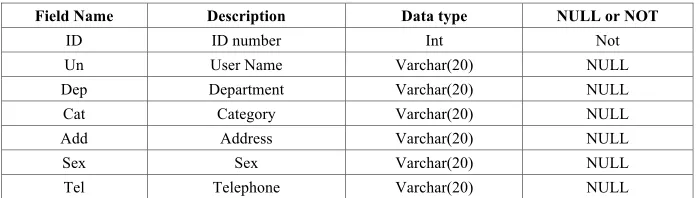
As an example, we give the User table and Node information table in the data-base, as described in Table 1 and Table 2.
Table 1. The user table
Field Name Description Data type NULL or NOT
ID ID number Int Not
Un User Name Varchar(20) NULL
Dep Department Varchar(20) NULL
Cat Category Varchar(20) NULL
Add Address Varchar(20) NULL
Sex Sex Varchar(20) NULL
Tel Telephone Varchar(20) NULL
Table 2. The Nodes Table
Field Name Description Data type NULL or NOT
ID ID number Int Not
Un Node Name Varchar(20) NULL
Area Area Varchar(20) NULL
Cat Category Varchar(20) NULL
Fun Function Varchar(20) NULL
Sim Sim Card Varchar(20) NULL
4
Design of Handheld Terminal APP
Through extensive research, at the same time reference to other APP product relat-ed functions, in view of the requirements of this APP user nerelat-eds, scene mode Case diagram model was designed, as shown in Figure 6. Along with a brief introduction to user management, information services, data query and device management.
Fig. 6. The general design of the system hardware
• User management: user registration and login.
• Data queries: The management personnel can obtain the state information of the
water supply network through the manual input method, and can also inquire the relevant information through the voice recognition function.
• Information service: Receiving and management notice.
• Device management: Managers can send instructions to the monitor node through
APP, to control water supply pipe valve, to change the water supply, or to cut off the water supply directly, to meet the different needs of different water supply net-work.
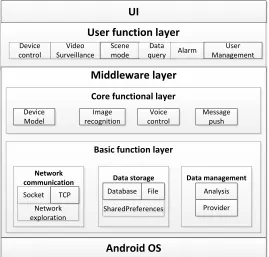
APP uses a layered structure, which is divided into four layers from top to bottom, called the user interface layer, user function layer, middleware layer and operating system layer. Among them, the middleware layer is divided into the core function layer and the basis function layer, as shown in Figure 7.
Fig. 7. Software module diagram
There is a top-down dependency between the layers. The lower layer provides the open service interface for the upper layer, but the specific implementation details are hidden. When the internal content of a certain layer changes, as long as the external interface unchanged, it will not affect the implementation of other layers. Each layer is divided into modules, each module is independent of each other, and the different modules are connected with each other through the interface.
Our APP is based on the Android operating system, The MBFL (the middleware basic function layer) provides the services such as network communication, data stor-age, data management and so on to the CFL (the core function layer). The MCFL (the middleware core function layer) provides the required equipment model, voice con-trol, message push, data access agent and other core services to the UFL (the User function layer). The UFL depends on the service which is provided by the ML (the middleware layer) to realize the specific function of the user's needs. In the end, the UFL interacts with the user through UI (User Interface).
In all the modules, the network communication module is the basis of all the func-tions of the APP, so the development of the module is also the most important. Com-pared to the UDP protocol, TCP is a connection oriented communication protocol, which through the three handshake to establish a connection, is a reliable data stream service. And TCP uses the "positive acknowledgement" technique to realize the transmission reliability, so the TCP protocol is adopted as the transmission layer pro-tocol [10].
!"#
!$%&#'()*+,-)#./0%&
!"#$%"&
%'()*'+ ./*#"$++0(%",$-"'& .%"("&1'-" 2/"*3!0)0& 4+0*1 70(08"1"()56"*&
1,22.%3/&%#./0%&
4-&%#'()*+,-)/.#./0%&!"#$%"&
7'-"+ %'()*'+,'$%"& 7"6608"&9/6:
5/$,*#'()*+,-)#./0%&
6%+3-&7#
*-88(),*/+,-) 9/+/#$+-&/:% 9/+/#8/)/:%8%)+
;")<'*=& ">9+'*0)$'( .'%=")
.:0*"-?*"@"*"(%"666
.:0*"-?*"@"*"(%"6
4(0+36$6
?*'#$-"*
;)2&-,2#<=
A108"& *"%'8($)$'(
Socket itself is a long connection as the connection is always maintained. But in reality, it is hard to know if there is anything wrong with the middle node. Some nodes (such as firewall) will cut off some connect without data exchange within a certain time automatically. In addition, the mechanism of TCP has the mechanism of the heart packet, that is, the option of TCP: SO_KEEPALIVE. The default setting of the system is the 2 hour heart rate. But it cannot check the power down of the ma-chine, the network cable pulled out, the firewall and other issues. And logical layer processing may not be so easy to deal with. Due to this situation, we use the heartbeat packet mechanism to send specific information to the server at regular time, and re-ceive the return data from the server. If the return message is not rere-ceived within a certain period of time, then the connection is re-established.
In order to ensure that there are more than one activity that can share the same socket, here we use a single model to establish a socket connection, this method not only solves the connection of the repeated establishment, to achieve a long connec-tion, but also eliminates the "new" operator, reduce the frequency of system memory, reduce the GC (Collection Garbage) pressure, and ensure the independence of the whole process control, avoid cross control. In addition, simple singleton class has no thread protection. When it is in a multi-threaded environment, there are bound to have problems, so the use of the synchronized keyword can lock the object, and only need to lock on it in the first time to create an object.
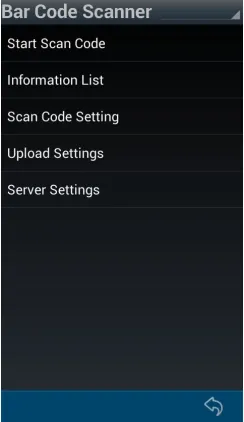
In addition, the bar code is added to the device management module to obtain or edit the device information. Bar code with equipment information is glued on the related equipment, bar code scanning through the function of APP to obtain the bar-code image and interpretation of the information. If it is available, you can read the relevant control information and edit it; else if it is a new device, you can create new device information and stored in the database. The realization of this function greatly reduces the complexity of equipment management, and improves the management efficiency.
5
Testing and Results
A simulation environment is established in the laboratory, and the test of remote wireless automatic meter reading system is carried out. Here is only a brief descrip-tion of the results of the following two funcdescrip-tions.
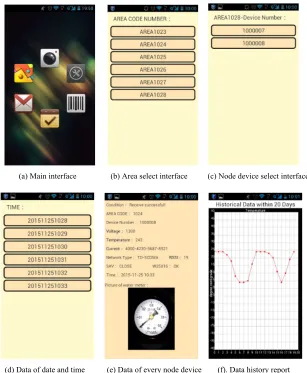
tem-perature, current, RSSI (Received Signal Strength Indication), etc. The water meter photo that returned from the site is located inside of the blue dashed box. Finally, click on the voltage and other parameters, such as temperature tag, you can get the device within 20 days of the temperature parameter line chart, so as to carry out the trend analysis, just shown as the Fig. 8(f).
(a) Main interface (b) Area select interface (c) Node device select interface
(d) Data of date and time (e) Data of every node device (f). Data history report
Fig. 8. Function Testing of APP
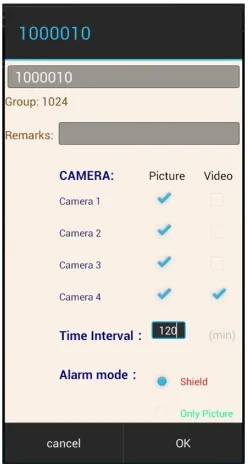
device just saved, we will access to the information interface as shown in Figure 11. In this window, set the parameters of the equipment and upload to the server, and then sent the parameter information to the remote monitoring device by the server, which achieve the remote control of the device, including the timing of the interval, alarm mode, the function of the camera and whether to empty the device on the SD card and other functions. In addition, the "List Information" also contains the control infor-mation of the existing equipment from the server, you can modify the corresponding operation.
In order to implement the significant function for the nodes which need to work, and provide the convenient and rapid search for the path to the nodes from current position, our APP supply the function of path service by map. This module uses “Bai-du maps” platform to set up the development environment. And utilize the map to be built in our APP, which implement position related some function, algorithm. In the remote automatic reading system, there are two roles of client, the manager and work-er client. In the managwork-er client, we implement the functions of problem consult, watwork-er internet management, map service and so on, which is shown in Figure 12. The Fig. 12(a) shows the positions of all devices and Fig. 12(b) shows the path from current position to the appointed device node. We can go to the place by the guide of our map path guider.
Fig. 10.Scanner Methods and its Results
Fig. 11.Control and edit interface of every node device
We evaluate our APP by Baidu Cloud testing platform. The APP performance test-ing report showed in Table. III, we can observe that our APP is better than Baidu APP in the average CPU occupancy, the average ram occupancy, the average data con-sumption and the average energy concon-sumption, only the average start time is little slower about 200 ms, this testing report proves the performance of our APP is good.
could be referred. MTC is a leading automatic test service platform in the mobile application area, which support over 500 kinds of main mobile phone and over 1000 mobile phone simulation tools to complete the application test. It also serve real phone and real person test for the APP to check the APP performance in real world. The testing results show that compatibility of Baidu APP is 91% and our VL APP is 90%, so this result proves the compatibility of VL APP is very good, which results are shown in Table III.
(a) Position of the nodes (b) Path plan to the chosen node
Fig. 12.Map service for the user
Table 3. report of the app performance
Performance Testing Content Minimum Maximum Average
APP CPU occupancy% 2.3 14.4 5.7
Baidu CPU occupancy (%) 1.0 46.2 21.2
APP Energy Consumption (mAh) 0.04 0.67 0.24
Baidu Energy Consumption (mAh) 0.94 7.32 2.54
APP Start Time (ms) 469 24989 1587
Baidu Start Time (ms) 739 5824 1248
6
Conclusions
data acquisition, command publishing, environmental monitoring and so on, manag-ers neither need to keep an eye on any computer screen information inquiry, nor need to enter the harsh environment of the scene, only need to open the mobile APP, you can quickly understand the relevant information, which provides a convenient, effi-cient and functional management mode for the management.
7
Acknowledgment
This work is supported in part by the Online Education Research Funds of Online Education Research Center of Ministry of Education (Quantong Education) (Grant No. 2016YB132) and “the Fundamental Research Funds for the Central Universities” (Grant No. HIT NSRIF.20169).
8
References
[1]Dan WU. “Evaluation and Strategic Conception of China's Water Conservancy Green
Modernization Process”. China population resources & Environment, 2015, pp. 132-135.
[2]M Angelidou. “Smart city policies: A spatial approach”, cities, 2014, 41 S1-S11.
[3]Group of "national intelligent network engineering frame design". Comprehensive carrier
of water conservancy modernization construction - intelligent network. Chinese water con-servancy, 2015, pp. 27-37.
[4]National Health and Medical Research Council. “Australian drinking water guidelines”.
Australia: National Health and Medical Research Council, 2013, pp. 10.
[5]Eker. Lyas, “Operation and Control of Water Supply System”, ISA Transactions, Jul,
2014, 2(3), pp. 461-473.
[6]Urban water supply association of China. “Technical progress and development plan of
urban water supply industry in 2014 and its prospect in 2020”. Beijing: China Building In-dustry Press, 2005, pp. 35-46.
[7]Chuanlian Hu. The preliminary exploration of development of "smart water network" in
city Based on the condition of new technology [J]. Chinese water conservancy,(2013),11
[8]S. Wu, Q. Xu and K. Zhao, “The intelligent remote meter reading system research and
de-sign based on GPRS technology”, Electronic Dede-sign Engineering, (2011), 12(32): 65-68.
[9]A. Biranje and S. S. Lokhande, "Wireless ARM-Based Automatic Meter Reading &
con-trol system (WAMRCS)," 2015 International Conference on Pervasive Computing (ICPC),
Pune, 2015, pp. 1-6. https://doi.org/10.1109/pervasive.2015.7087019
[10]Shangfu Kuang, Jianhua Wang. Construction of national intelligent network engineering
upgrade China's water security [J]. China water resources, (2013), 27-31.
[11]Huiqin Zhao, Xiulan Li. The optimization strategy of ORACLE database application
sys-tem. Computer engineering and application. (2013), 213-217.
[12]Hongliang Yu. The principle of TCP and UDP and the difference in network programming
9
Authors
Lei Feng is an associate professor of School of Electrical Engineering, Harbin In-stitute of Technology, No.2 Yikuang Street, Harbin, Heilongjiang Province, China, 150080.
Chuang Yang is an assistant engineer of Nanjing Research Institute of Electronics Engineering, No.1 Muxuyuan East Street, Nanjing, Jiangsu Province, China, 210007.
Wenbin Zheng is a lecturer of School of Electrical Engineering, Harbin Institute of Technology, No.2 Yikuang Street, Harbin, Heilongjiang Province, China, 150080. He received doctor degree in 2014 from Harbin Institute of Technology. His main research interests are cooperative transmission, wireless sensor, network and automat-ic test and control technology, mautomat-icrofluidautomat-ic technology and etc
Ping Fu is a professor of School of Electrical Engineering, Harbin Institute of Technology, No.2 Yikuang Street, Harbin, Heilongjiang Province, China, 150080. He received his Doctor Degree from Harbin Institute of Technology in 1999. His main research areas are image processing, compressive sensing and automatic test technol-ogy and etc.