World Maritime University
The Maritime Commons: Digital Repository of the World
Maritime University
World Maritime University Dissertations
Dissertations
2001
The measurement of maritime policy impacts on
Thai economy
Nakorn Indra-Payoong
World Maritime UniversityFollow this and additional works at:
http://commons.wmu.se/all_dissertations
Part of the
Economics Commons
Recommended Citation
Indra-Payoong, Nakorn, "The measurement of maritime policy impacts on Thai economy" (2001).World Maritime University Dissertations. 375.
WORLD MARITIME UVIVERSITY
Malmö, Sweden
THE MEASUREMENT OF MARITIME POLICY
IMPACTS ON THAI ECONOMY
By
NAKORN INDRA-PAYOONG
Thailand
A dissertation submitted to the World Maritime University in partial fulfillment of
the requirement of the award of the degree of
MASTER OF SCIENCE
in
MARITIME AFFAIRS
(SHIPPING MANAGEMENT)
DECLARATION
I certify that all the material in this dissertation that is not my own work has been
identified, and that no material is included for which a degree has been conferred on
me.
The contents of this dissertation reflect my own personal views, and are not
necessarily endorsed by the University.
……… (Signature)
24 August 2001
Supervised by:
Name: Professor Patrick Donner
Office: Associate Professor, Shipping Management
World Maritime University
Assessor:
Name: Professor Shuo Ma
Office: Professor, Shipping and Port Management
World Maritime University
Co-assessor:
Name: Professor Hercules Haralambides
Office: Professor, Maritime Economics at the Erasmus
ACKNOWLEDGEMENT
Within the available time for doing research, it would have been very hard to
complete and achieve a satisfactory result in my work without the following people.
First of all, I owe a special debt of gratitude to my supervisor, Professor Patrick
Donner, for constantly helping me to elaborate my research and make it much more
readable and for greatly assisting in various other ways.
I am overwhelmingly indebted to my brother, Kaseam Pintong, and my beloved
sister, Jittree Indra-payoong, who intellectually advised me on the matters of
computer programming and mathematical calculation. Thanks as well to my friends
at the World Maritime University, in particular the Thais, who have patiently cheered
me up during my research.
Finally, I would very much like to thank all members of my family, my sweetheart
and friends of mine staying in my homeland, who have given me indescribable love
ABSTRACT
Title of Dissertation: The measurement of maritime policy impacts on Thai economy
Degree Master of Science in Maritime Affairs
Since the economic crisis in the mid-1990s, the government of Thailand has made an
enormous effort to recover from the slowdown in economic sectors, in particular the
maritime sector, which plays a key role in developing the economy of the country.
This research introduces a quantitative method, input-output approach, to provide a
measurement of maritime policy impacts by considering both direct and indirect
effects on all other economic sectors.
Four scenarios of maritime policy are applied in a case study concerning the
maritime sector of Thailand: privatisation of the shipping and port sectors,
subsidisation of the shipping and port sectors, investment in maritime infrastructure
and promotion of international trade. The indicator of maritime policy impacts is
shown in terms of total national income.
The result indicates that the most appropriate maritime policy scenario is the
subsidisation of the port and shipping sectors, which shows the greatest sensitivity in
increasing the output of total national income. The change by one unit of government
expenditure will give a change in output of total national income of 72.32 per cent.
The government is, therefore, recommended to continue supporting the maritime
sector with limited expenditure and strict criteria for the granting of subsidies.
TABLE OF CONTENTS
Declaration ii
Acknowledgements iii
Abstract iv
Table of Contents v
List of Tables vii
List of Figures viii
1. Introduction
1.1 Background 1
1.2 Objectives of the research 2
1.3 Scope of the study 3
2. Literature review
2.1 Literature review 4
2.2 The development of the input-output table 6
2.2.1 The development of the input-output table in Thailand 6
2.2.2 Type of the input-output table 6
2.2.3 The procedure of constructing the input-output table 7
2.3 Shipping and port industries 8
2.4 Economic perspective in Thailand 11
2.4.1 Economic situation in previous year 11
2.4.2 Economic projection, 2001-2002 12
3. Research methodology
3.1 Understanding the input-output approach 15
3.2 Updating input-output table by RAS method 19
3.3 Research procedure 21
3.4 Data collection 22
3.5 Estimation of total intermediate input and output 2002 25
4. Measurement of effects of maritime policy
4.1 Measurement of effects of policy 29
4.2 Maritime policy review 30
4.3 Analysis of Leontief inverse matrix and output multiplier 32
4.4 Maritime policy impacts 32
4.4.1 Privatisation of the shipping and port sectors 34
4.4.2 Subsidisation of the shipping and port sectors 35
4.4.3 Investment in maritime infrastructure 36
4.4.4 Promotion of international trade 37
4.5 The selection of maritime policy framework 38
5. Conclusions and recommendations
5.1 Conclusions 41
5.2 Recommendations 42
References 44
Appendices
Appendix A The computer programme 46
Appendix B The calculation of the input-output table 51
LIST OF TABLES
Table 2.1 Thai trade and transport 9
Table 2.2 Thai maritime trade 9
Table 2.3 The number of Thai seafarers 10
Table 2.4 Maritime Operators in Thailand 11
Table 2.5 Forecast future of container transport (TEU) in main port of
Thailand 11
Table 2.6 Thai economic outlook 13
Table 3.1 The structure of the input-output table 16
Table 3.2 Total input 1980, 1985, 1990, 1995 and 2002 24
Table 3.3 Total intermediate input and output 2002 28
Table 4.1 The Leontief inverse matrix 2002 33
Table 4.2 The impacts of privatisation of the shipping and port sectors 35
Table 4.3 The impacts of subsidisation of the shipping and port sectors 36
Table 4.4 The impacts of investment in maritime infrastructure 37
Table 4.5 The impacts of promotion of international trade 38
LIST OF FIGURES
Figure 1.1 Framework of the research 3
Figure 3.1 Base matrix and estimated matrix 19
Figure 3.2 Research procedure 21
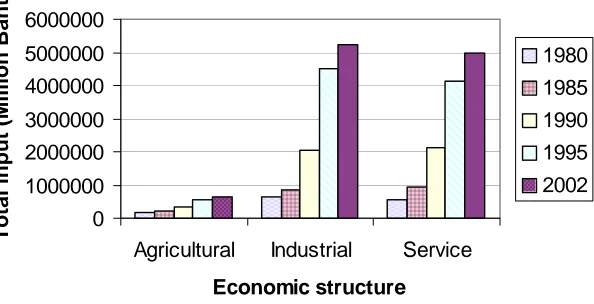
Figure 3.3 Total input classified by economic structure 25
Chapter 1
INTRODUCTION
1.1 Background
Thailand, an Asian country, is located in South-East Asia. The economic
development in Thailand during the past two decades has been remarkable.
Unfortunately, in the mid-1990s, the economic crisis among Asian countries has
dramatically affected the Thai economy. The Government of Thailand has, therefore,
made enormous efforts to recover economic sectors, particularly, the maritime sector,
both shipping industries and port sectors, which play a key role in developing the
economy of the country. With a large number of constraints, such as government
expenditure, limited resources, technological knowledge and so forth, the policy
makers should carefully take into account the outcome of the policy and carefully
select the policy that gives the highest profitability among numerous alternatives.
To decide on the policy in a developing economy, it is indispensable to have good
data for measuring the outcome of such a policy. If the policy makers use appropriate
data and techniques, the economic recovery will be ironed out efficiently; otherwise,
it will bring about many coming problems (Lewis, 1991, pp. 256-281). To issue the national policy, studying previous data, collecting new data, and analyzing the
relevant data is the first important basis of planning policy.
is inevitably costly to achieve the best result. The policy maker should thus plan
wisely and appropriately in order not to obtain the best way out but to get the
optimum outcome.
Economic models are employed to analyse and measure the effect of policy issues at
both national and regional level. Various approaches, both theoretical and empirical,
are used to measure a policy affecting the economy and to try to obtain completely
predictive effects from a change in policy. Input-output is one of the popular
methods to assess the interdependence of economic sectors (Miller & Blair, 1985, pp.
1-10).
The input-output analysis basically represents the flow of commodities and services
in a certain economic period by using the input-output table as an analytical tool. The
input-output method has widely been used in many developed countries, such as the
United States of America, Japan, Australia and so on (William, 1965, pp. 1-20). This
method is suitable for infrastructure planning and policy analysis.
This research will use the advantages of a 17×17 input-output table for Thailand for
the year 2002, updated from the base-year table 1990, so as to measure the impact of
maritime policy affecting the Thai economy, for example privatising the shipping
and port sectors, investing in national port and shipping projects and promoting
international trade by reducing and/or exempting the income tax. The details are
described in the following chapter.
1.2 Objectives of the research
A main objective of this dissertation is to develop the mathematical model,
input-output model, for measuring the impact of maritime policy on Thai Economy. This
Input-Output Model
gross national product (GNP), national income, production account, import-export
statistics, transport facilities, value added, etc.
The input-output model will be tested by varying the vector of final demand
composed of export, private and government consumption to measure the changes in
total output of the 17×17 economic sectors. The impacts of maritime policy will be
shown in terms of output multipliers.
1.3 Scope of the study
The study of maritime policy affecting on Thai economy will use the input-output
table 1975, 1980, 1985, 1990 and 1995 for updating the target-year table 2002. The
standard Thai 180×180 input-output table constructed by the National Economic and
Social Development Board, (2001) will be aggregated into the 17×17 table for this
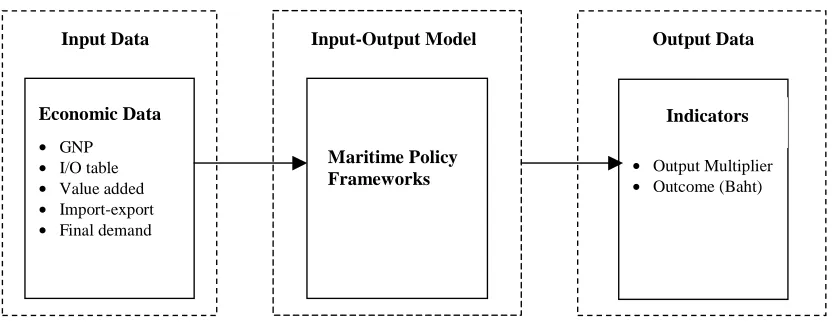
study. The framework of the research is depicted in figure 1.1
Figure 1.1 Framework of the research
Economic Data • GNP
• I/O table
• Value added
• Import-export
• Final demand
Maritime Policy Frameworks
Output Data Input Data
• Output Multiplier
• Outcome (Baht)
Chapter 2
LITERATURE REVIEW
2.1 Literature review
The development in maritime industries is a key factor to develop the economy of
the country. Generally speaking, a good national maritime industry will substantially
help to expand the economy of a country. In this chapter, the previous researches and
statistics relating to maritime policy are gathered as follows:
A lot of research has been conducted into maritime policy and management interest
at the macroeconomic level and also concentrating particularly on the economic
development of maritime transport infrastructure improvement. Lee (1996, pp.
311-325) described the major efforts to restructure the Korean economy and analysed the
structural reforms that impact on the Korean shipbuilding and port sectors.
Input-Output (I/O) analysis have widely been used in policy analysis and for evaluating
impacts of transport improvement such as the regional economic effects of
expanding a port facility (Stevens et al., 1981, pp. 1029-1038)
In regional input-output analysis, the multi-regional input-output models developed
by Leontief & Strout (1963, pp. 119-149) have been widely used to describe regional
economic activities, especially in their ability to describe interregional trade and
inter-industry transactions in regional and industrial detail. Normally, impact studies
value added structures of the shipping sector, the economic impact of three policy
scenarios were considered: the laissez-faire scenario, the conventional subsidisation
scenario and the new policy framework scenario.
Weisbrod & Treyz (1998, pp. 65-79) introduced the concept of bridging local and
global perspectives to measure the effects of transport investments at both micro and
macro level. Economic models are employed to analyse effects in transportation
planning. For example, Daluwatte & Ando (1995, pp. 213-233) proposed a model to
estimate effects of transportation plans at national and regional level by using
interregional input–output analysis. The Bureau of Economic Analysis (1997)
developed the regional input-output model to estimate the regional impacts of airport
construction and expansion. The results were showed in terms of earnings and
employment.
These models are also applied in analysis in the economic field, especially in freight
transportation. Freight flows relate directly to trade coefficients, which are
interesting in regional input-output models. For instance, Mizokami (1995, pp.
393-405) combined input-output analysis and price equilibrium to develop an
interregional trade model. The Marine Policy Centre (2001) developed the
input-output models to estimate the economic impacts of services produced in different
economic sectors, which are linked to a marine sector, such as commercial fishing.
The European Economic Impact Study for the European shipping sector (2001) used
the input-output model as a tool for quantifying both direct and indirect effects of the
shipping sectors to the European economies, in terms of value added, employment
and backflow to the government.
The consistency of the input-output models mentioned above has successfully been
achieved. Therefore, the input-output model can obviously be used for measuring
2.2 The development of the input-output table
2.2.1 The development of the input-output table in Thailand
The Thai 3×3 input-output table was first constructed in 1951. The table was then
developed into 11×11 economic sectors in 1954 by using the coefficient of
input-output production from India and Nigeria. In 1973, the standard 75×75 input-output
table was carried out by using industrial and economic data of the country.
In 1975, the National Economic and Social Development Board of Thailand
completely developed the standard 180× 180 input-output table namely; The Input-
Output Table of Thailand, 1975 under the Thailand input-output joint project in
cooperation with Japan Institute of Developing Economics. In general, the national
input-output table will be constructed every fifth year by the National Economic and
Social Development Board of Thailand.
2.2.2 Type of the input-output table
The input-output table basically comprises two types, which are:-
1. Purchaser’s price: measured by the real price of products in the economic
system, which includes transportation cost and market cost differential.
2. Producer’s price: measured by the price at the production unit in the
economic system, which does not include transportation cost or market cost
differential. The producer’s price shows the unit cost of the product.
To construct the input-output table, it is essential to develop three supporting
matrices.
- Transport cost matrix
Thus, the producer’s price input-output equation can be written as:-
Production (I/O) = Purchaser’s price table – market cost differential
- retail costdifferential - transport cost (2.1)
2.2.3 The procedure of constructing input-output table
The input-output structure basically consists of two major components. The columns
of the table describe input structure of commodities and services in various
economic sectors. The rows represent output structure to distribute to private
consumption expenditure, government consumption expenditure, import-export
sectors and stock sectors. The procedure of constructing the input-output table is
described as follows:
1. Reviews and preparation
The objective of this process is to review the existing input-output table, 1975, 1980,
1985, 1990, and 1995 and economic data in industrial sectors. This process is also to
improve the table regarding to economics condition. Furthermore, the production
cost, market cost differential and transportation cost will be surveyed to update the
input-output table in the target year.
2. Sector classification
According to the National Economic and Social Development Board of Thailand, the
standard input-output table is classified into three types: the 180 economic sectors,
3. Data survey
The survey method can be done in three different ways: direct interview,
questionnaire and calling interview.
4. Constructing the table
This stage is to fill in the data collected from various sources: production cost,
private consumption, government services, financial transactions, value added and
import-export value in the input-output table. Based on the basic input-output
analysis, the total input must equal the total output, total value added must be equal
to total final demand and total intermediate input must equal total intermediate
output. If the table does not balance, it is necessary to collect some more data in
order to balance such a table.
5. Balancing the table
The iteration technique will be used to balance the input-output table. Normally, the
iteration will process many rounds until balancing the table is achieved.
2.3 Shipping and port industries
Thai maritime industries have remarkably expanded over the past several years. Both
the port and shipping industries play an important role in economic development.
The statistics in table 2.1 show that Thai international trade and transport was mostly
carried out by sea transport, contributing more than 90 percent in cargo volume and
Table 2.1 Thai trade and transport
Unit 1995 1996 1997 1998 1999
Cargo volume by sea %
Export 95.20 93.32 93.77 94.20 95.65 95.83
Import 94.87 95.49 96.35 96.00 98.60 98.60
Both export and import 95.03 94.69 95.40 95.25 97.07 97.31
Cargo value by sea %
Export 71.11 69.30 70.00 71.03 71.01 71.05
Import 72.61 68.64 73.51 73.03 67.70 74.99
Both export and import 71.93 68.93 71.99 72.07 69.55 72.87 Source: Customs Department Estimated by Ministry of Transport (Transport Statistics 1995-1999)
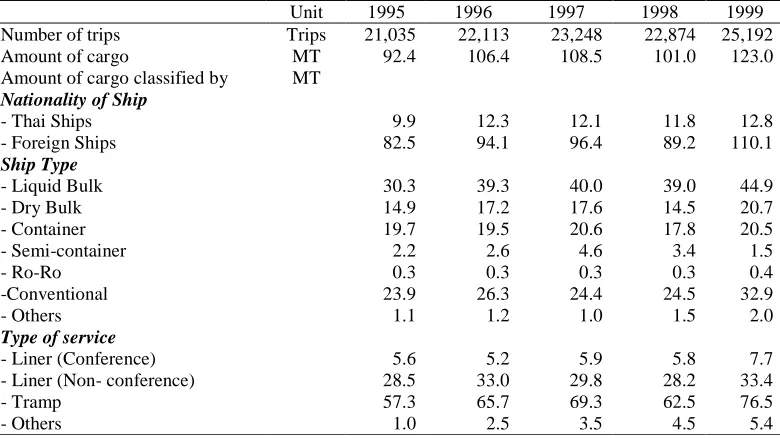
In order to grasp the whole picture of Thai maritime trade, one should take into
account components of the trade, such as nationality of ship, ship type, type of
service, cargo type and port areas. Although the statistics show that Thai maritime
trades have been increasing dramatically, approximately 90 per cent of the maritime
trade was carried on foreign flag vessels. The details are shown in table 2.2
Table 2.2 Thai maritime trades
Unit 1995 1996 1997 1998 1999
Number of trips Trips 21,035 22,113 23,248 22,874 25,192
Amount of cargo MT 92.4 106.4 108.5 101.0 123.0
Amount of cargo classified by MT Nationality of Ship
- Thai Ships 9.9 12.3 12.1 11.8 12.8
- Foreign Ships 82.5 94.1 96.4 89.2 110.1
Ship Type
- Liquid Bulk 30.3 39.3 40.0 39.0 44.9
- Dry Bulk 14.9 17.2 17.6 14.5 20.7
- Container 19.7 19.5 20.6 17.8 20.5
- Semi-container 2.2 2.6 4.6 3.4 1.5
- Ro-Ro 0.3 0.3 0.3 0.3 0.4
-Conventional 23.9 26.3 24.4 24.5 32.9
- Others 1.1 1.2 1.0 1.5 2.0
Type of service
- Liner (Conference) 5.6 5.2 5.9 5.8 7.7
- Liner (Non- conference) 28.5 33.0 29.8 28.2 33.4
- Tramp 57.3 65.7 69.3 62.5 76.5
- Others 1.0 2.5 3.5 4.5 5.4
Looking at the marine service sectors, the number of Thai seafarers has changed
slightly. Unfortunately, it has been predicted by the Office of the Marine Promotion
Commission that by the end of this decade, the number of Thai seafarers would
enormously decrease by up to 30 per cent, being replaced by foreign crews from
countries, such as Myanmar, the Philippines, India, etc. The number of Thai seafarers
classified by nationality of ship and ship type is shown in table 2.3
Table 2.3 The number of Thai seafarers
Unit 1995 1996 1997 1998 1999
Number of seafarers working in commercial ships
83,022 84,046 78,333 74,070 82,963
Number of seafarers working in commercial ships classified by Nationality of Ship
- Thai Ships 5,840 5,879 6,159 5,048 5,133
- Foreign Ships 77,182 78,167 72,174 69,022 77,830
Ship Type
- Liquid Bulk 13,059 14,330 14,478 13,222 15,368
- Dry Bulk 17,184 17,882 16,118 13,552 16,097
- Container 3,835 4,234 5,419 6,436 6,125
- Semi-container 3,052 3,073 3,760 2,377 1,748
- Ro-Ro 1,874 2,252 1,838 2,043 2,467
- Conventional 37,940 37,841 32,238 30,666 35,558
- Others 6,078 4,434 4,482 5,774 5,600
Source: Office of the Marine Promotion Commission 2001
Maritime operators include sea transport operators, port operators, dockyard owners,
multi-modal transport operators (MTO) and logistics providers. These operators
considerably support national maritime industries. The development in the numbers
of maritime operators was somewhat weak and the role of the maritime operators has
Table 2.4 Maritime operators in Thailand
Unit 1995 1996 1997 1998 1999
No. of registered operators
Sea transport operators 324 332 343 349 352
Port operators 116 125 131 113 111
Dockyard operators 18 21 24 27 27
The number of Ports Classified by
- General 67 69 69 61 61
- Chemical 10 11 12 11 14
- Oil 30 34 35 31 29
- Container 9 11 15 10 7
- Total 116 125 131 113 111
The number of Yards Classified by
- Dry dock 1 1 1 1 1
- Floating dock 2 3 4 4 4
- Lever 9 10 13 14 14
- Others 6 7 7 8 8
- Total 18 21 24 27 27
Source: Harbor department, Ministry of Transport and Communication, 1999
Because of both containerisation and logistics evolution facilitating the growth of
international trade, port operators perform their function as gateways or hubs of the
country. There are two major port authorities in Thailand: Bangkok port and Laem
Chabang port. As traffic and environmental problems are being regarded as serious
issues in Bangkok, in 1999 the Thai government decided to limit the container traffic
through Bangkok Port to 1.2 million TEU. As a result of this, Laem Chabang Port
will have to handle the rapidly increasing number of containers.
Table 2.5 Forecasted future of container transport (TEU) in main ports of Thailand
1996 2001 2006 2011
Bangkok port 1,295,267 1,200,000 1,200,000 1,200,000
Privat port 243,871 400,000 400,000 400,000
Laem Chabang port 710,094 1,537,617 3,214,179 5,401,568
Songkhla port 55,000 78,000 121,000 165,800
Phuket Port 5,000 6,000 7,000 8,000
Total (TEU) 2,309,232 3,221,651 4,942,179 7,175,368
Total (Ton) 23,173,796 32,005,993 49,669,376 73,062,741
Source: Estimated by Merchant Marine Institute, Chulalongkorn University, 1999
2.4 Economic perspective in Thailand
In 2000, the Thai economy expanded at a rate of 4.3 percent, which was attributed to
5.7 per cent growth in the first half and 3.0 percent in the second half of 2000. The
slowdown in the latter half can be described as follows (Ministry of Commerce,
2001).
a. The slowdown in the world economy caused by the slowdown in the US
economy, affected Thai exports. The export value growth of Thailand slowed
down in every major market, particularly in the US and Japanese markets.
b. Non-performing loans (NPLs) in the Thai economy remained high, which
was an obstacle for the business and financial sectors.
c. The unemployment rate remained high at approximately 3.6 per cent, which
was equivalent to 1.2 million unemployed people.
d. The stock market was still inactive. The daily volume of trade was 3,740
million Bath and the Stock Exchange of Thailand (SET) Index decreased by
44 per cent.
2.4.2 Economic projection, 2001-2002
a. Economic indicators of production will remain almost unchanged. Economic
indicators of expenditure such as sales of motorcycles, VAT, and import
value of consumer goods will slightly increase. However, sales of passenger
cars will decrease.
b. Economic indicators of private investment will moderately expand, such as
sales of cement, galvanized iron sheets, commercial vehicles, and imported
capital goods, but sales of steel bars will decrease.
c. Export value will decrease 3.9 percent, which will mainly be caused by a
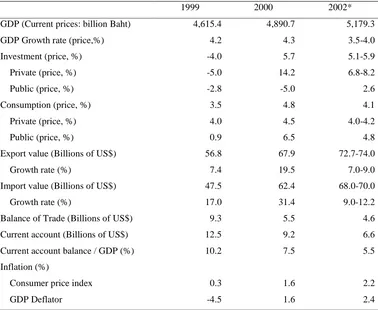
Table 2.6 Thai economic outlook
1999 2000 2002*
GDP (Current prices: billion Baht) 4,615.4 4,890.7 5,179.3
GDP Growth rate (price,%) 4.2 4.3 3.5-4.0
Investment (price, %) -4.0 5.7 5.1-5.9
Private (price, %) -5.0 14.2 6.8-8.2
Public (price, %) -2.8 -5.0 2.6
Consumption (price, %) 3.5 4.8 4.1
Private (price, %) 4.0 4.5 4.0-4.2
Public (price, %) 0.9 6.5 4.8
Export value (Billions of US$) 56.8 67.9 72.7-74.0
Growth rate (%) 7.4 19.5 7.0-9.0
Import value (Billions of US$) 47.5 62.4 68.0-70.0
Growth rate (%) 17.0 31.4 9.0-12.2
Balance of Trade (Billions of US$) 9.3 5.5 4.6
Current account (Billions of US$) 12.5 9.2 6.6
Current account balance / GDP (%) 10.2 7.5 5.5
Inflation (%)
Consumer price index 0.3 1.6 2.2
GDP Deflator -4.5 1.6 2.4
Source: Estimated by Ministry of Commerce 2001
2.4.3 Economic policy
Because of the slowdown in the world economy, exports will become less significant
to growth in 2001-2002. To promote the economic growth, the government will need
to issue stimulus programs to increase the domestic demand. In addition, promotion
of exports is important for the recovery of the Thai economy. The following are
examples of economic policies that could be implemented.
Increase consumption and investment
a. Reallocate the government budget of fiscal year 2002 to projects that generate
major contributions to the economy and reduce dependence on the foreign
sector.
b. Increase the budget deficit of fiscal year 2002. It should be noted that the
budget deficit will be financed by government bonds. The deficits in the
coming fiscal year should include a raise in salary of public servants and
employment of new graduates for at least one year.
c. Increase service and investment efficiency of state enterprises and encourage
potential state enterprises to invest without government support or guarantee.
Postpone a rise in VAT to 10 percent for two more years (until September 30,
2003) to maintain people’s purchasing power.
d. Accelerate restructuring of NPLs and debt negotiation through Thai Asset
Management Corporation, which will start to operate in August 2001, in
order to bring back valuable assets to the economy.
Promotion of exports
a. Improve efficiency of management in every stage of production. Eliminate
problems and obstacles of exporting, for example improve the quality of
infrastructure. Search for new export markets by pursuing negotiations
between trade partners to relax rules, which are obstacles for exporting
agricultural products.
b. Free trade for industries that can compete in the world economy, such as the
automobile, electric and electronic appliance industries. In addition, the
government should pursue bilateral co-operation to open new markets for
exports. Urge people to consume less of imported luxury goods, reduce
Chapter 3
RESEARCH METHODOLOGY
3.1 Understanding the input-output approach
The input-output table is constructed by collecting the economic data systematically.
The economic activities will then be classified into various sectors. The input-output
table illustrates the flow of commodities and services between each sector in an
economic system during a certain period, generally a year. The input-output structure
basically consists of two major components as shown in Table 3.1. Columns
represent the input structure of commodities and services in various production
sectors. Rows indicate output distribution to distribute to the household sector,
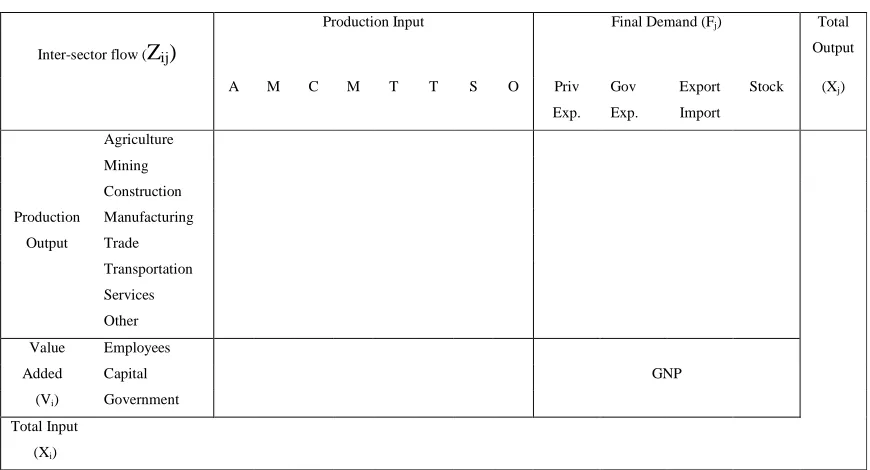
Table 3.1 The structure of the input-output table
Inter-sector flow (Zij)
Production Input Final Demand (Fj) Total
Output
A M C M T T S O Priv
Exp. Gov
Exp.
Export
Import
Stock (Xj)
Agriculture
Mining
Construction
Production Manufacturing
Output Trade
Transportation
Services
Other
Value Employees
Added Capital GNP
(Vi) Government
Total Input
(Xi)
Source: U.S. Department of Commerce, Bureau of Economic Analysis, 1979
Where,
Zij = Sales of sector i to sector j
Xj = Total (Gross) output of sector j
Xi = Total (Gross) input of sector i
Fj = Final demand
Vi = Value added
The rows of a table describe the distribution of a producer output throughout the
economy. Assume that there are n sectors, the output equation can therefore be
written as:-
å
n= + =j
j j
ij F X
Z 1
(3.1)
Similarly, the columns describe the composition of inputs required by a particular
sector to produce its output,
The ratio of input to output, denoted aij , can be found as follows: j ij ij X Z
a = (3.3)
Where, aij is an input-output coefficient (or intermediate transaction coefficient)
Equation (3.3) can therefore be written in terms of the input-output coefficient as
follows: n n n nn n n n n n n n n n X F X a X a X a X a X F X a X a X a X a X F X a X a X a X a X F X a X a X a X a = + + + + + = + + + + + = + + + + + = + + + + + ... ... ... ... ... 3 3 2 2 1 1 3 3 3 3 33 2 32 1 31 2 2 2 3 23 2 22 1 21 1 1 1 3 13 2 12 1 11
By rearranging and collecting terms, the above set of equations can be written as:-
The above set of equations can further be considered in matrix form, shown as
[
I A]
X F = −Therefore, X =
[
I−A]
−1F (3.4)Where,
[
I−A]
−1 is a Leontief inverse matrix (Leontief, 1949, p. 13).‘Leontief inverse matrixdescribes the flow of goods and services between all
the individual sectors of a national economy over a stated period of time, say
a year’
Nevertheless, the fact that the input-output model normally involves a large number
of economic sectors, certain simplifying assumptions are made as follows: (Chiang,
1974, pp. 186-187)
1. Each economic sector produces only one homogeneous commodity.
2. Each economic sector uses a fixed input ratio for the production of its output.
3. Economies of scale are ignored. As a result, production in every economic
sector is subject to constant return to scale.
To construct the input-output table, data collection is basically done by two major
techniques.
1. Survey-based method; this method requires both considerable surveying cost
and collecting time but, of course, accurate data will be achieved.
2. Non-survey method; this is to collect the economic data from various sources,
such as the input-output table from a previous year and then forecast the table
in the target year by calibrating with up-to-date data. This method has widely
3.2 Updating input-output table by RAS method
The RAS method, a bi-proportional technique, developed by Professor Stone and his
colleagues at Cambridge university in 1952 (Stone et al, 1963, pp. 56-63) is widely
used to update an existing input-output table (base year) to relate to a year for which
the total intermediate input-output are known (target year) but not the intermediate
deliveries themselves. The simple RAS method consists of finding a set of
multipliers to adjust the rows and columns of the base- year matrix.
The RAS method principally uses a bi-proportional iteration technique to adjust the
base matrix from total intermediate output in each row and total intermediate input in
each column. It then calculates the modified matrix, which is subject to total
intermediate output and input of estimated matrix. The procedure is shown in figure
3.1.
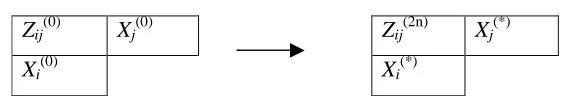
Zij(0) Xj(0) Zij(2n) Xj(*)
Xi(0) Xi(*)
Figure 3.1 Base matrix and estimated matrix
Where,
Zij(0) = The matrix of base year
Xi(0) = Total intermediate input of sector i
Xj
(0)
= Total intermediate output of sector j
Zij(2n) = The matrix of updating year
Xi(*) = Estimated total intermediate input of sector i
) 0 ( ) 0 ( (*) ) 1 ( ij j j ij Z X X Z ú ú û ù ê ê ë é
= (3.5)
) 1 ( ) 1 ( (*) ) 2 ( ij i i ij Z X X Z ú ú û ù ê ê ë é
= (3.6)
From equation (3.5) and equation (3.6) the n iteration will be calculated, thus
) 2 2 ( ) 2 2 ( (*) ) 1 2 ( − − − ú ú û ù ê ê ë é = n ij n j j n ij Z X X
Z (3.7)
(2 1) (2 1)
(*) ) 2 ( − − ú ú û ù ê ê ë é = n ij n i i n ij Z X X
Z (3.8)
The iteration will terminate at the point where the absolute value of the discrepancy
between X* and Xn is equal to an acceptable error (ε)
Xj(*)- Xj(2n-2) < (ε) (3.9)
Xi(*) - Xi(2n-2) < (ε) (3.9)
Similarly, the RAS method adjusts coefficient matrix (A) in the rows by matrix Rj
and in the columns by matrix Si
i ij j
ij R A S
A (*) = × (0)× (3.10)
where,
Aij(*) = the coefficient of inter-sector matrix of the updating year
Aij(0) = the coefficient of inter-sector matrix of the base year
Rj = Substitution matrix
‘The substitution effect is measured by the extent to which commodity (j) has
been replaced by other commodities as an intermediate input and the
fabrication effect is measured by the extent to which commodity (j) has
absorbed a smaller or greater ratio of intermediate to primary inputs.’
3.3 Research procedure
In order to assess the impact of maritime policy on the Thai economy, the
input-output table in year 2002 will be updated by using the RAS method. The research
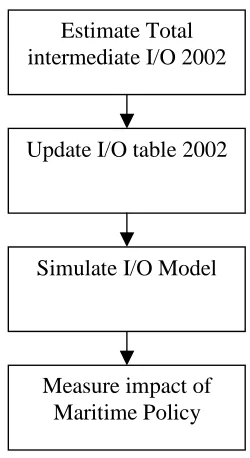
procedure is shown in four main stages in figure 3.2
Figure 3.2 Research procedure
Stage 1 Estimate total intermediate input and output in year 2002 by using
total output, value added, import-export and final demand data of the
previous year to forecast total intermediate input and output in year Estimate Total
intermediate I/O 2002
Update I/O table 2002
Simulate I/O Model
Stage 2 Update input-output table for year 2002 by bi-proportional iteration,
the RAS method. The input-output table constructed for year 2002
will be used for maritime policy analysis and the input-output table
year 1990 will be used as a base-year matrix.
Stage 3 Simulate the input-output model, in other words, ‘a Leontief inverse
matrix,’ to analyze the impact of maritime policy in terms of output
multiplier.
Stage 4 Assessment of maritime policy impacting on Thai economy. A
sensitivity analysis will be carried out by varying the vector of final
demand (Vj) that involves private and government consumption,
export, and so on to observe the change in total output (Xj) of the
various economic sectors.
3.4 Data collection
The input-output table for 1990 will be used as a base-year matrix, which is surveyed
and modified by the Department of the national input-output, the National Economic
and Social Development Board. The Thai standard 180×180 input-output table
(National Economic and Social Development Board, 2001) normally used as a tool
for national policy analysis and planning will be aggregated into a 16× 16 standard
input-output table. Since this study emphasises on maritime policy, it is, therefore,
better to split sector 14, transportation and communication, into sector 14,
transportation and sector 15, communication. As a result of doing that, the 17× 17
input-output table will be achieved, which is classified as follows:
Sector 3 Food, beverage and tobacco
Sector 4 Textiles and textile products
Sector 5 Manufacture of wood and wood products
Sector 6 Paper and paper products printing
Sector 7 Rubber, chemical and petroleum products
Sector 8 Non-metallic mineral products
Sector 9 Metal and metal products, machinery
Sector 10 Other manufacturing industries
Sector 11 Public utilities
Sector 12 Construction
Sector 13 Trade
Sector 14 Transportation
Sector 15 Communication
Sector 16 Services
Sector 17 Unclassified
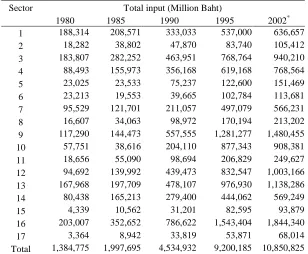
From all the economic sectors above, the total input in each economic sector in 1980,
Table 3.2 Total input in 1980,1985,1990, 1995 and 2002
Sector Total input (Million Baht)
1980 1985 1990 1995 2002*
1 188,314 208,571 333,033 537,000 636,657
2 18,282 38,802 47,870 83,740 105,412
3 183,807 282,252 463,951 768,764 940,210
4 88,493 155,973 356,168 619,168 768,564
5 23,025 23,533 75,237 122,600 151,469
6 23,213 19,553 39,665 102,784 113,681
7 95,529 121,701 211,057 497,079 566,231
8 16,607 34,063 98,972 170,194 213,202
9 117,290 144,473 557,555 1,281,277 1,480,455
10 57,751 38,616 204,110 877,343 908,381
11 18,656 55,090 98,694 206,829 249,627
12 94,692 139,992 439,473 832,547 1,003,166
13 167,968 197,709 478,107 976,930 1,138,286
14 80,438 165,213 279,400 444,062 569,249
15 4,339 10,562 31,201 82,595 93,879
16 203,007 352,652 786,622 1,543,404 1,844,340
17 3,364 8,942 33,819 53,871 68,014
Total 1,384,775 1,997,695 4,534,932 9,200,185 10,850,825 Source: National Economic and Social Development Board, Thai national income, 2000
* Estimated from Regression Analysis (See Appendix C)
In general, the economic structure can mainly be aggregated into three structures as
shown in figure 3.3
1. Agricultural structure represented by sector 1 (Agricultural)
2. Industrial structure grouped by sector 2 (Mining) to sector 10 (Other products)
0 1000000 2000000 3000000 4000000 5000000 6000000
Agricultural Industrial Service
Economic structure
Tot
al input
(
M
illion Baht
)
1980
1985 1990 1995
2002
Figure 3.3 Total input classified by economic structure
Figure 3.3 shows that there are small increases in the total input of the agricultural
structure in comparison with the industrial and service structures. The trend of the
Thai economy has been changing enormously from an agricultural structure to a
service structure. According to the Thai Eight National Economic and Development
Plan, the maritime industry, which is considered as one of industrial and service
structure, is being promoted to be an important key in economic development of the
country.
3.5 Estimation of total intermediate input and output, year 2002
In order to develop the input-output table for 2002 by the RAS Method, there are two
main compositions: the base year matrix (Zij), which is based on the existing
input-output table for 1990 and target-year table 2002, which total intermediate input and
output are known. Therefore, the requirements are both to find out the total
intermediate input and output and calculate their intermediate deliveries 2002. The
estimation procedure is shown below:
draw a trend line. As a result, a simple linear regression model in each sector
will be achieved. The result shows that the relationship between value added
and year development is quite obvious, with regards to a coefficient of
determination (R2) of each model not less than 0.8. The linear regression
models are shown in tables C-1and C-2.
b. Use final demand and net-export data (F+e) for 1975,1980,1985,1990 and
1995 to draw a trend line. By following the same procedure as above, the
final demand and net export data (F+e) for year 2002 can be calculated as
shown in tables C-3 and C-4.
c. Use the same procedure to determine the value of total input (Xi) for year
2002. The result is shown in tables C-5 and C-6.
d. Based on the basic input-output method, the total input must equal the total
output (Xi = Xj); it therefore gives:
å
å
= = =mi j n i i X X 1 1 (3.11)
e. Based on the input-output method, total value added (Vi) must equal the sum
of final demand and net export (Fj+ej)n . In practice, the calculation rarely
comes true. Thus, the proportional technique is used to balance both values
that can be written as in equation (3.12)
(
) (
) (
)
(
)
(
)
ïï þ ïï ý ü ï ï î ïï í ì ÷÷ø ö ççè æ + − × + + − + = +å
å
å
= = = m j n i i j j m j j j j j j j jj F e V
where,
(Fj+ej)*= Adjusted final demand and net export of sector i, 2002
(Fj+ej) = Final demand and net export of sector i, 2002
Vi = Value added of sector j, 2002
It is noted that in this study the value added is used as a base figure to balance
value added and the sum of final demand and net export because it is
considered as more consistent according to the coefficient of determination
(R2) of the regression model. The result is shown in table C-7.
f. The total intermediate input and output can finally be obtained as in equations
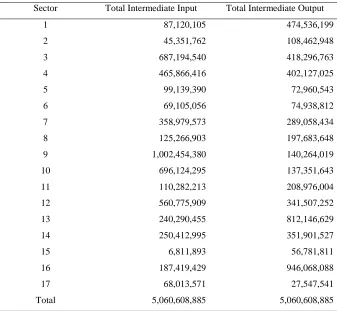
(3.13) and (3.14). The result is shown in table 3.3
Total intermediate input = ( Xi) - ( Vi) (3.13)
Table 3.3 Total intermediate input and output, 2002 (Thousand Baht)
Sector Total Intermediate Input Total Intermediate Output
1 87,120,105 474,536,199
2 45,351,762 108,462,948
3 687,194,540 418,296,763
4 465,866,416 402,127,025
5 99,139,390 72,960,543
6 69,105,056 74,938,812
7 358,979,573 289,058,434
8 125,266,903 197,683,648
9 1,002,454,380 140,264,019
10 696,124,295 137,351,643
11 110,282,213 208,976,004
12 560,775,909 341,507,252
13 240,290,455 812,146,629
14 250,412,995 351,901,527
15 6,811,893 56,781,811
16 187,419,429 946,068,088
17 68,013,571 27,547,541
Chapter 4
MEASUREMENT OF EFFECTS OF MARITIME POLICY
4.1 Measurement of effects of policy
To measure the impact of policy and planning depends on determining the objective
of such a policy. In general, indicators that can describe the impact of the policy can
be listed into seven issues (Lewis, 1991).
1. Employment distribution
2. Individual income distribution at various level
3. Output and income distribution in each region
4. Output and income distribution in each sector
5. Increase in efficiency
6. Increase in output in economy
7. Increase in individual standard of living level
The above indicators can be aggregated into two main objectives; to distribute the
economics activities (1 to 4) and to increase economics activities (5 to 7).
The increase in economic activity influences decision making in each policy.
Measuring output of an economic system arisen from implementation of a policy can
be analysed by using input-output analysis. The indicator of effect in economic
output or impact from implementing of a policy will be shown in terms of output
In analysing input-output of the economy, the impact on the economic system will be
shown in the form of a Leontief inverse matrix. This matrix can describe the direct
and indirect relation of each economic sector affecting the whole economic system.
The output multiplier can be calculated from the Leontief inverse matrix that shows
the impact of change in final demand of each sector of the economic system. The
output multiplier describes the change of total output arisen from the change of final
demand by one unit.
4.2 Maritime Policy Review
According to the Eighth National Economic and Social Development Plan
(1997-2001), the Office of Maritime Promotion Commission, 2001 has promoted
four-major maritime policies as follows:
1. Creation of free and fair international shipping market
The policy of the Thai government provides for free market access for the
international shipping market. However, cargo reservation on government and state
enterprise imports to be loaded by Thai flagged vessels on specific routes is the only
exception to the liberalised policy.
2. Prevention of flagging out
There are no direct measures to prevent flagging out. However, the Government of
Thailand provides a number of promotional programmes to attract Thai operators to
fly the Thai flag. They are administrative, fiscal and funding programmes.
Even though the Thai fleet is the smallest amongst the Asian countries, the number
of Thai flagged vessels has increased significantly during the last decade through the
promotional programme. Protection of the shipping industry is done through cargo
reservation policy. Nevertheless, such a policy is less effective since the shipping
market in Thailand is liberalised and privileges granted by the policy have already
ended in December 1998.
4. Review and deregulation of existing regulations in maritime transport related
areas.
In order to promote maritime activities, the Thai government has already deregulated
some measures, which are;
a. Transport operators who buy ships from other countries are able to have
their ships registered without bringing their ships to Thai territories.
b. The Department of Labour has deregulated rules on crew member
training courses established by the Department and, at the same time,
allowed on board crews exemption from third-country working permit
processes. However, the Department of Labour has given authority to
immigration to issue working permits by using the seaman’s book
together with a company authorized-letter as evidence to get third-country
working permit.
c. The Department of Communications has given full authority to the
Harbor Department to be permanently in charge of full calling signals
when ship operators apply for ship registry. However, ship operators must
complete informing their calling signal together with ship registry within
4.3 Analysis of Leontief inverse matrix and output multiplier
Shown in Table 4.1, the coefficients of the Leotief inverse matrix give the quantity of
direct and indirect inputs of commodities and services (i) needed to produce one unit
of commodity and service (j) (Amachee, 1988). The matrix is a result of an infinite
chain of inputs as each economic sector requires input from every sector, which
requires inputs from all other sectors and so on. This is computed by a computer
programme developed for this study as well as the MATLAB software for processing
matrix operations as shown in Appendix A.
The configuration of the Leotief inverse matrix shows that all the diagonal elements
are greater than or equal to unity. This is because the production of one unit of
commodity and service in a particular economic sector not only requires one unit of
input from that sector but also additional units from the other sectors supplying it.
Afterwards the output multipliers are calculated by summing up the figure of input
form each economic sector.
In general, the study of policy impacts uses multiplier analysis derived from the
Leotief inverse matrix. The output multiplier is the change of total output derived
from the change of final demand of one unit, for example the change of final demand
of one unit in the economic sector 1 (Agricultural) will affect the output of all
economic sectors 1.2313 times.
4.4 Maritime Policy Impacts
This section gives some examples of measuring the impact of maritime policy on the
economy of Thailand. Using the input-output model, the measurement of policy
impacts will simply be obtained by changing the vector of final demand (17×1
Table 4.1 The Leontief inverse matrix 2002
Sector 1 2 3 4 5 6 7 8 9 10 11 12 13 14 15 16 17
maritime policy are assumed for this study to show obvious results of
implementation of each policy, which are;
• Privatisation of the shipping and port sectors
• Subsidisation of the shipping and port sectors
• Investment in maritime infrastructure
• Promotion of international trade
4.4.1 Privatisation of the shipping and port sectors (non-subsidisation policy)
In order to assess the direct and indirect impacts of privatisation of the shipping and
port sectors, the policy should first be quantified in terms of private and government
consumption expenditure, in other words, the total final demand. The privatisation of
the shipping and port sectors mainly involves economic sector 14 (Transportation) in
the 17×17 input-output table. However, the composition of the transportation sector
includes rail transport, land transport, air transport, and water transport. To focus on
the effect of maritime policy, a maritime sector must be separated from other
transport sectors. Based on statistics of the Ministry of Finance 1999, a national
expenditure of the maritime sector is allocated 18 percent of all transportation sectors.
According to Table 4.1, the change of final demand by one unit in the economic
sector 14 (transportation) will affect all economic sectors 1.7231 times. Suppose that
the privatisation of the shipping and port sectors will cut private and government
expenditure by 20 per cent. To obtain a variation of the policy, the private and
government expenditure will be varied from 0 to minus 40 percent. Using the
input-output analysis, the results of direct and indirect input-output multipliers can be calculated
Table 4.2 The impacts of privatisation of the shipping and port sectors
Percent Expenditure Impacts (Million Baht)
Changed (Million Baht) Direct Indirect Total
Gov. expenditure 217347 238321 136190 374511
Maritime Sec. 0 39123 42898 24514 67412
-10 35211 38609 22063 60672
Gov. Policy -20 31298 34318 19611 53929
-30 27386 30029 17160 47189
-40 23474 25739 14709 40448
4.4.2 Subsidisation of the shipping and port sectors (subsidisation policy)
In contrast, the subsidisation of the shipping and port sectors is referred to as a
traditional subsidisation policy. The government decides to support and protect the
shipping and port sectors by subsidies. Nowadays, this policy is considered as an
inefficient policy because the huge amount of expenditure spent by the government
is not likely to create an innovative and competitive sector. The subsidisation policy
seems to serve neither the aim of the government nor the sector in the long run.
Implementing a subsidisation policy assumes that in the fiscal year 2002, the
government will have to add 20 per cent to private and government expenditure. The
policy impacts are shown in table 4.3
Table 4.3 The impacts of subsidisation of the shipping and port sectors
Percent Expenditure Impacts (Million Baht)
Changed (Million Baht) Direct Indirect Total
Gov. expenditure 217347 238321 136190 374511
Maritime Sec. 0 39123 42898 24514 67412
+10 43035 47188 26966 74154
Gov. Policy +20 46948 51478 29418 80896
+30 50860 55768 31869 87637
4.4.3Investment in maritime infrastructure
Because of traffic and environmental problems in Bangkok, the Thai government has
decided to limit the container traffic through Bangkok Port to 1.2 million TEUs. As a
result, Laem Chabang port, located in the eastern region of Thailand, will have to
handle the year by year rapidly increasing number of containers, which exceed the
existing capacity of phase 1 (Port Authority of Thailand (PAT), 1998). Therefore,
PAT will have to construct stage 1 of phase 2, so that the terminal will have
sufficient capacity for container handling in the coming year. PAT has signed a
contract hiring the Italian-Thai Co., Ltd. to undertake the construction of Laem
Chabang port, phase 2, stage 1, the total cost of which amounts to 4,400 million Baht
plus VAT (five years estimated construction period).
In addition, the new government has revitalised the ship breaking industry at
Bangsaphan, 200 kilometres south of Bangkok, with facilities for demolition of
larger vessels. The estimated cost will be 1,274 million Baht (two and half years
estimated construction period).
The investment in shipping and port infrastructure will mainly contribute to
economic sector 12 (Construction) in the 17×17 input-output table. Regarding the
fiscal year 2002, an amount of expenditure for both projects will be portioned for the
year 2002. As a result, the government of Thailand will have to add 1,390 million
Table 4.4 The impacts of investment in maritime infrastructure
Percent Expenditure Impacts (Million Baht)
Changed (Million Baht) Direct Indirect Total
Gov. expenditure 661659 715121 474013 1189134
Gov. Policy 1390 1502 996 2498
+10 1529 1653 1095 2748
+20 1668 1803 1195 2998
+30 1807 1953 1295 3248
+40 1946 2103 1394 3497
4.4.4 Promotion of international trade
According to the Ministry of Finance, 1999 concerning the methods on solving the
economic problems, a number of economic facilitation programmes will be made,
such as reduction and/or exemption of the income tax related to international trade,
reduction and/or exemption of custom tariffs for imported goods, reduction of import
duty for parts and spare parts for all types of automobiles, reduction of the cost of
export production and compensation of tax and duty paid on domestic goods for
export.
To measure the direct and indirect impact of promotion of international trade, this
policy framework will be defined as economic sector 13 (Trade) in the 17×17
input-output table.
It is noted that the economic facilitation programmes mentioned above intend to
reduce an element of import and export cost. On the other hand, the government will
have to add a national expenditure in the trade sector. Based on statistics of the
Ministry of Finance 1999, the national expenditure of international maritime trade
Consequently, by varying the increase of national expenditure in the international
maritime trade from 10 to 40 percent, the result of policy impacts will obviously be
obtained as shown in table 4.5
Table 4.5 The impacts of promotion of international trade
Percent Expenditure Impacts (Million Baht)
Changed (Million Baht) Direct Indirect Total
Gov. expenditure 326140 330608 88743 419351
Maritime Trade 0 88058 89264 23961 113225
+10 96864 98191 26357 124548
Gov. Policy +20 105670 107118 28753 135871
+30 114475 116043 31149 147192
+40 123281 124970 33545 158515
4.5 The selection of maritime policy framework
Using the input-output analysis and simple quantitative method, the measurement of
effects of maritime policy can be achieved. However, because of differentiation
amongst polices, one policy to another policy, a comparative analysis will be
introduced to solve such a problem. Using a simple proportional technique, the
apparent output of the national income affected by each policy framework will be
seen in Table 4.6
Table 4.6 The effects of maritime policy framework (Million Baht)
Policy Framework Expenditure Income output (Million Baht)
(Million Baht) Direct Indirect Total Changed (%)
Privatisation -7825 -8580 -4904 -13484 -72.32
Subsidisation 7825 8580 4904 13484 72.32
Inv. of Infrastructure 1390 1502 996 2498 79.71
The maritime policy frameworks are compared in terms of output of the national
income they generate, both the direct and indirect effect to the national economic
sectors. Evidently, the promotion of international trade gives the highest output of
the total national income amounting to 22,646 million Baht. However, it should not
be considered as the best alternative because the expenditure spent is considerably
greater than for the other alternatives.
Hence, the comparison of policy frameworks should basically rely on the output of
the total national income in terms of percentage changed. The privatisation and
subsidisation policy give the same figure, which is 72.32 per cent because they both
represent the transportation sector. The investment in port and shipping infrastructure
generates 79.71 per cent and the promotion of trade gives 28.58 per cent output of
the total national income generated.
As considered above, the investment in maritime infrastructure policy seems to be
the best alternative compared to the others as it gives the highest percentage of the
total national income. Nevertheless, because of a dramatic change in the construction
industry in the mid-1990s, this is very likely to make the prediction of the
construction sector not reliable and consistent.
Disregarding the policy framework of investment in maritime infrastructure, the
privatisation and subsidisation of the shipping and port sectors would result in great
reduction and increase of the government expenditure respectively. Because of the
slowdown in the economy of Thailand, the privatisation policy is being taken into
account so as to decrease the national expenditure. However, implementing such a
policy will also generate an enormous reduction in output of the national income.
In summary, the maritime policy framework for 2002 should be laid down in a
shipping and port sectors are able to compete or survive on the basis of economic
efficiency.
Chapter 5
CONCLUSIONS AND RECOMMENDATIONS
5.1 Conclusions
This study focuses on measuring maritime policies affecting the economy of
Thailand. The total intermediate input and output 2002 are first predicted by using
the proportional technique and regression method. Afterwards a computer
programme, based on the RAS method, is used to conveniently update the 17×17
base year input-output table of 1990 to relate to the 17×17 target year input-output
table 2002 for which the total intermediate input and output are already known.
The Leotief inverse matrix and the output multiplier are then employed to test
maritime policy scenarios. The analysis gives the output in terms of the total national
income.
The measurement of policy impacts is tested by changing the vector of final demand
(17×1 matrix), which are private and government consumption expenditure, to the
changes, both direct and indirect, in output of the various economic sectors. The
scenarios of maritime policy are: privatisation of the shipping and port sectors,
subsidisation of the shipping and port sectors, investment in maritime infrastructure
and promotion of international trade.
Having deeply analysed the frameworks of maritime policy, the subsidisation of the
sector (Transportation) will affect the output of the whole economy 1.7231 times.
Regarding the matter of the maritime policy proposed, the change by one unit of the
government expenditure will change the output of total national income by 72.32 per
cent, amounting to 13,484 million Baht. In conclusion, it is obvious that the selection
of subsidisation of the shipping and port sectors is the most appropriate policy
framework for the Thai economy.
5.2 Recommendations
Even though the major merit of this research is that it eliminates a subjective
decision of the policy maker, there remains room for further development as follows:
First of all, a measurement of broad conceptual policy scenarios should be elaborated
and developed further. For instance, the investment in maritime infrastructure, falling
under the construction sector, had much better be categorised in detail, such as
residential construction, non-residential construction, public construction, etc.
However, it is hard to achieve such a goal and some difficulties still unavoidably
arise. The further research should be designed very well regarding both method and
data collection.
Considering the RAS method, the accuracy in updating data depends upon the
primary data. Because of the lack of data and inconsistent information, the
input-output table for 1990 is ponderously selected as a base year to fill up the intermediate
input-output table for 2002. However, it should be noted that the economic crisis in
the mid-1990s has enormously affected the industrial sector of the country. Since
then most companies have started minimising their investment cost in terms of
logistics concept so as to survive in the economic battle. As a result, this has changed
the structure of the intermediate input and output of the country. Therefore, in order
and output, the base-year matrix should be up-to-date and calibrated with additional
survey-based data.
Unlike RAS, time series and other techniques simply evaluating their models by
using a number of preceding year data, an evaluation of the input-output model has
not successfully been achieved and most researchers have neglected to delve deep
into this point. This may be due to the fact that the input-output model fundamentally
simulates the flow of commodities and services between each sector in economic
transactions in an economic system during a certain period, generally a year. As a
result, it is very hard to evaluate the model while the real economic data have not yet
happened. Therefore, further research may iron out the problems by performing the
input-output model on a small part of the economy and afterwards enlarging it to a
national scale.
This study aims at a national level, which merely simulates the flow of commodities
and services within the Thai economy. Since maritime industries are mainly involved
in regional and global environments, the maritime policy of the country should also
be made based on the international concern. Consequently, the further study may
combine and develop the input-output model at an international level so as to assess