World Maritime University
The Maritime Commons: Digital Repository of the World
Maritime University
World Maritime University Dissertations Dissertations
2000
Cost reduction in the commercial operations of the
Ethiopian shipping lines : a response to global
competition
Tessema Bogale Kaleayu World Maritime University
Follow this and additional works at:http://commons.wmu.se/all_dissertations
This Dissertation is brought to you courtesy of Maritime Commons. Open Access items may be downloaded for non-commercial, fair use academic purposes. No items may be hosted on another server or web site without express written permission from the World Maritime University. For more
Recommended Citation
Kaleayu, Tessema Bogale, "Cost reduction in the commercial operations of the Ethiopian shipping lines : a response to global competition" (2000).World Maritime University Dissertations. 291.
WORLD MARITIME UNIVERSITY
Malmo, Sweden
COST REDUCTION IN THE COMMERCIAL
OPERATIONS OF THE ETHIOPIAN SHIPPING
LINES-A RESPONSE TO GLOBAL
COMPETITION
By
Kaleayu Tessema Bogale
The Federal Democratic Republic of Ethiopia
A dissertation submitted to the World Maritime University in partial fulfilment of the requirements for the award of the degree of
MASTER OF SCIENCE
in
SHIPPING MANAGEMENT
2000
DECLARATION
I certify that all materials in this dissertation that is not my own work has been identified, and that no material is included for which a degree has previously been conferred on me.
The contents of this dissertation reflect my own personal views, and are not necessarily endorsed by the University.
………. Kaleayu Tessema Bogale October 2000.
Supervised by: ……… Mr. R. Prasad Lecturer
World Maritime University.
Assessor: ……… Mr. P. Donner
Associate Professor
World Maritime University.
Co-assessor: ……….. Mr. J. Ifwarsson
ACKNOWLEDGMENTS
My deepest gratitude in preparing this dissertation goes to all that contributed by providing me with information, suggestions and aspiration. In particular my special thanks go to:
Mr. Ambachew Abraha, general manager of Ethiopian Shipping Lines for providing me the opportunity to study at World Maritime University.
The Norwegian Shipping Academy and International Maritime Organisation for having sponsored me. Special thanks should go to Mr. Tony Noonan for facilitating the sponsorship, his regular visit and encouragement during my stay at World Maritime University.
Mr. Rajendra Prasad, for his advice and supervision of this work.
The large number World Maritime University lecturers and staff members from whom I have gained invaluable wealth of knowledge.
World Maritime University students, especially Rajnesh from India, for providing me assistance whenever I had difficulties with computers.
ABSTRACT
Title of Dissertation: Cost reduction in the commercial operations of the
Ethiopian Shipping Lines-a response to global competition
This dissertation looks at the possible cost saving areas in the commercial operations of the Ethiopian Shipping Lines (ESL). In the present competitive market, small shipping companies like ESL will be able to survive and grow only if they establish proper cost control and look for a potential savings by implementing cost effective measures.
In this paper, attempts are made to examine and analyse the current situation of the company and look for savings from port related expense, in particular from time dependent wharfage/berthing dues, cargo handling and container related expenses. Moreover, detailed comparison is also made on the feasibility of chartering-in vessels vis-à-vis running own vessels, for one specific service route, namely the Persian Gulf and Mumbai service route. A brief look is taken at the unfavourable situation for the national and regional niche players because of the ongoing global trends. Due to the on going global trend most of the national and regional small liner operators; in particular those from the developing countries are on the verge of disappearing from the liner trade. Apparently ESL has already started facing severe financial constraints. Various data and statistics including operational reports of ESL fleet and financial performance from the annual reports of the company are used during the analysis.
Finally, the concluding chapter summarises the most important points and analysis discussed under the different chapters.
TABLE OF CONTENTS
Declaration ii
Acknowledgements iii
Abstract iv
Table of Contents v
List of Tables vii
List of Figures viii
List of Abbreviations ix
Chapter I. Introduction 1
Chapter II. Background 4
2.1 Fleet expansion 4
2.2 Service routes 6
2.3 Organisation 6
2.4 Analysis of current situation 8
2.4.1 Depressed freight rate levels 9
2.4.2 Operational performance 12
2.4.2.1 Capacity utilisation 13
2.4.2.2 Time in port 15
2.4.2.3 Scheduling 15
Chapter III. Cost control 18
3.1 Design of a cost control system 21
3.2 Ship costs- an overview and a brief introduction 21
3.2.1 Operating costs 21
3.2.2 Voyage costs 23
3.2.3 Capital costs 24
3.2.4 Cargo handling costs 25
3.3 Cost control in shipping 25
Chapter IV. Possible cost saving areas 28
4.1 Port charges 29
4.1.1 The need for operational planning and standard setting 33
4.2 Cargo handling costs 40
4.2.1 Stevedoring contracts 42
4.3 Chartering-in /an alternative strategy 47
4.3.1 Cost comparison 50
4.4 Container costs 55
Chapter V. The effect of global trends 59
5.1 Globalisation 59
5.2 Alliances, mergers and acquisitions 61
5.3 Deregulation 62
5.4 Increasing vessel size 64
5.5 Logistics management 64
5.6 The challenges for ESL 66
Chapter VI. Conclusion 68
LIST OF TABLES
Table 2.1 ESL fleet in 2000 5
Table 2.2 Advertised service schedule 7
Table 2.3 ESL fleet capacity utilisation during 1997/98 & 1998/99 14
Table 2.4 Balance sheet as of June 30, 1999 17
Table 4.1 Voyage cost breakdown 30
Table 4.2 Berthing due tariffs of representative North continent ports 31
Table 4.3 Surcharges of representative ports 32
Table 4.4 Operational reports of representative vessels 34
Table 4.5 Weekend calls at North continent ports 36
Table 4.6 Time related berthing due of selected ports 38
Table 4.7 Estimated savings from berthing dues during 1998/99 40
Table 4.8 Cargo handling cost break down in the 2nd half of 1998/99 44
Table 4.9 Sailing schedule variance in 1998/99 46
Table 4.10 Extra charges in the 2nd half of 1998/99 47
Table 4.11 Particulars of vessels operating in the Gulf route 49
Table 4.12 Daily running (operating) cost of own vessels 51
Table 4.13 General cargo vessels (7500-15000dwt) time charter rate development 1995/98
52
Table 4.14 Daily bunker consumption of own vessels 53
Table 4.15 Typical general cargo (5000-10000 dwt) fuel consumption 53
LIST OF FIGURES
Figure 2.1 Organisational chart of ESL 8
Figure 2.2 9 months out bound cargo 10
Figure 2.3 9 months in bound cargo 10
Figure 2.4 Gross revenue 11
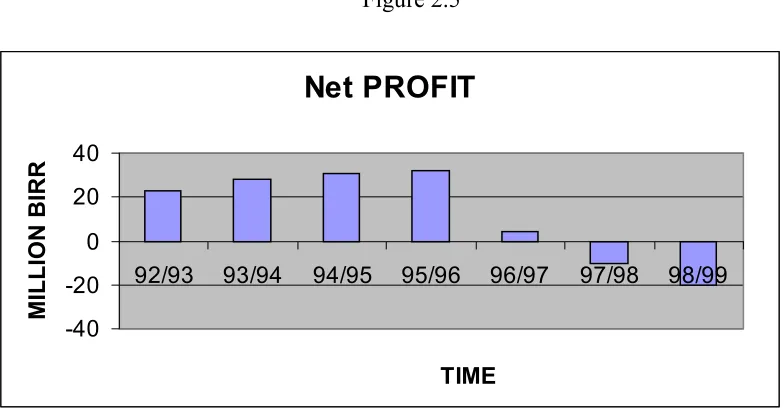
Figure 2.5 Net profit 16
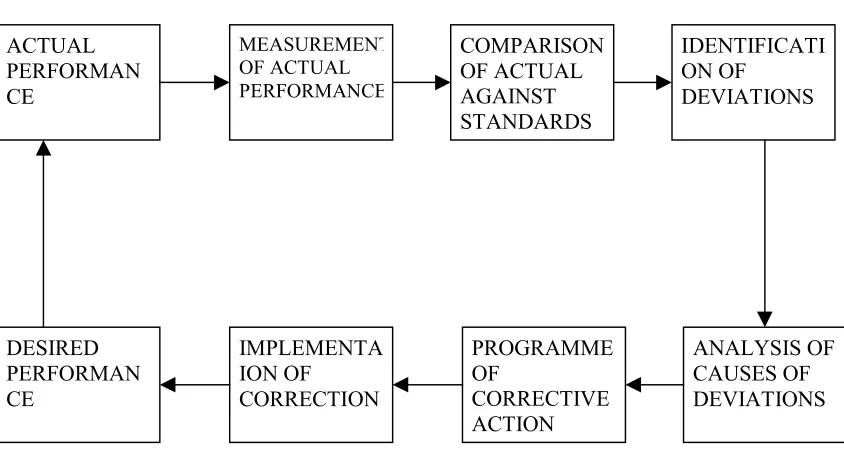
Figure 3.1 The process of controlling 19
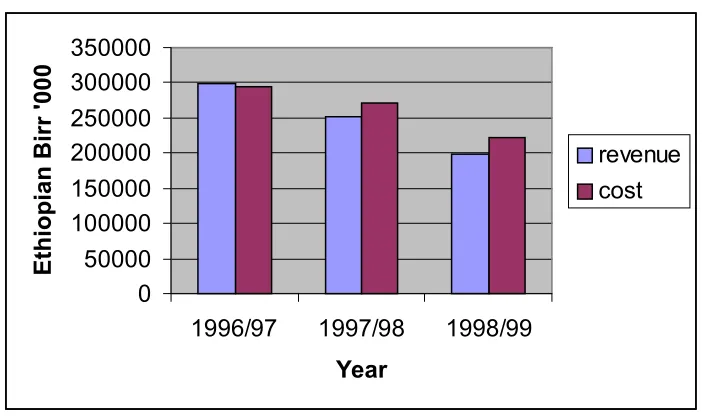
Figure 4.1 Revenue verses cost during the last 3 years 29
Figure 4.2 Cost breakdown during 1998/99 42
LIST OF ABBREVIATIONS
APL American President Line
BF Belgium Franc
DWT Dead weight
ESL Ethiopian Shipping Lines
FIO Free in out
GT Gross tonnage
H&M Hull and Machinery
HFO Heavy Fuel Oil
ISL Institute of Shipping Economics and Logistics
K-LINE Kawassaki Kisen Kaisha Line
LOA Length Overall
MDO Marine Diesel Oil
MISC Malisian International Shipping Corporation
MOL Mitsui OSK Line
NOL Neptune Orient Line
NT Net Tonnage
NYK Nippon Yusen Kaisha
OOCL Orient Overseas Container Line
P&I Protection and Indeminity
RO/RO Roll on Roll of
SCL Safmarine Container Line
SEK Swedish Kroner
TEU Twenty Equivalent units
UASC United Arab Shipping Company
Chapter I Introduction
Historically, it is probably true that the costs involved in running ships were modest when compared with the revenue from freights. Nowadays it is no more the case. In the present day shipping, freight rates are in general dominated by downward trend whilst ship costs are still increasing. In view of this, the liner shipping is being dictated by the need to reduce costs.
State owned shipping companies from the developing countries, like the Ethiopian Shipping Lines, are facing all financial problems that states have. Due to the limited resources, most developing countries are not in a position to inject capital to their shipping companies to keep abreast with the latest developments in the shipping industry. In the face of increasing competition and downward trend in freight rates, there is little the Ethiopian Shipping Lines can do on the revenue part of its operation. The success and survival of the company is highly dependent on how cost efficient it is.
Presently, the Ethiopian Shipping Lines is operating under a competitive environment. The existing government as a result of the change in the economy policy has waived the protection ESL used to enjoy in the form of cargo reservation. Therefore, cost reduction is one of the most critical requirements for the survival of ESL. The commercial operation of ESL appears to suffer from lack of proper voyage and operational planning and execution of plans. Often schedules are not adhered to. Among other things, the liner shipping requires strict maintenance of schedule and regularity. To this effect, it is vital for ESL to adhere to advertised schedules in order to remain in the business.
During the last two years ESL has declared negative operating results from its liner operation. As freight rates are not expected to improve significantly for the foreseeable future, it is high time for ESL to focus on minimising its overall costs. The author of this dissertation has no reason to doubt about the need and possibility of reducing costs in the technical operation of the company. However, due the author’s limited knowledge in the technical operations and the difficulties to gather data, this paper was made to focus on the commercial operations of the company. The goal of this dissertation is to pinpoint possible cost saving areas in the commercial operations and assess the extent of savings.
Chapter II describes about the establishment, service routes, organisational structure, fleet expansion and analysis of the current situation and the difficulties faced by ESL. The analysis comprises the effects of the continued downward trend in freight rates and the change in the port of entry for the Ethiopian trade. Moreover, it also comprises analysis of the operational performance of the fleet which includes capacity utilisation, time in port, scheduling and the financial performance of the company.
budgeting and standard costing. It also looks at the different ship costs namely, operating costs, voyage costs, capital costs and cargo handling costs.
Chapter IV deals with detailed analysis of the possible cost savings from port charges, cargo handling and container expenses. The fleet performance and port operation reports of some representative ports have been considered for the purpose of analysis. Furthermore, efforts have been made to show the extent of savings from the proposed cost saving areas. It also looks at the feasibility and possibility of chartering-in vessels for the Red Sea/Persian Gulf service route as an alternative strategy.
Chapter V examines the global trends and their effects on the liner shipping in general and the national and regional niche players in particular. The global trends under discussion include globalisation, alliances, mergers, acquisitions, deregulation, increasing vessel size and logistics management. It also examines the challenges for ESL vis-à-vis the global trends.
Finally chapter VI summarises the most important points and analysis discussed in the previous chapters.
Chapter II Background
The Ethiopian shipping lines (here after called as ESL) was established in 1964, as a joint venture, with 51% owned by an American company and 49% by the Ethiopian government. It started operation in 1966 with three newly built ships, consisting of two general cargo ships of 6550 dwt each and one oil tanker of 34075 dwt capacity. Subsequently the American Company sold its share to the ministry of finance and ESL became fully Ethiopianised in 1969. The emergence of ESL has the following objectives
- To facilitate the nation’s external trade by providing reliable maritime transport. - To earn and save foreign exchange that would have been paid out to foreign ship
owners.
- To create job and opportunities to acquaint young Ethiopians with marine
technology and tradition.
- To promote self-sufficiency and self-reliance.
The dry cargo vessels were deployed on a liner service between Red Sea and Northwest European ports while the tanker was chartered out.
2.1Fleet expansion
meet the country’s demand for maritime transport and was forced to charter-in additional tonnage to supplement its shipping service.
The profitability of ESL was adversely affected during the first seven years due to the long voyage via the Cape and various other factors. However, this situation reversed and the company started showing reasonable profits in 1974 which it has been able to maintain there after. In1974, the then government re-established the Ethiopian Shipping Line by writing off the accumulated loses and adopted supportive measures in the form of cargo reservation. ESL had enjoyed cargo reservation policy until the downfall of the military government in 1991. The present strength of the fleet is eleven cargo ships and one product tanker.
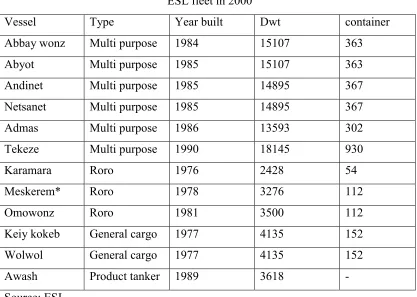
Table 2.1 ESL fleet in 2000
Vessel Type Year built Dwt container
Abbay wonz Multi purpose 1984 15107 363
Abyot Multi purpose 1985 15107 363
Andinet Multi purpose 1985 14895 367
Netsanet Multi purpose 1985 14895 367
Admas Multi purpose 1986 13593 302
Tekeze Multi purpose 1990 18145 930
Karamara Roro 1976 2428 54
Meskerem* Roro 1978 3276 112
Omowonz Roro 1981 3500 112
Keiy kokeb General cargo 1977 4135 152
Wolwol General cargo 1977 4135 152
Awash Product tanker 1989 3618
-Source: ESL
In May 1991, the present government took power from the Marxist military government and Eritrea got separated from Ethiopia with the two ports, Assab and Massawa. At present Ethiopia is one of the land locked countries in the continent. The present government had adopted free market economy policy and ESL is no more in a position to enjoy the protectionist policy, which it used to have during the previous regime.
2.2Service routes
Thirty four years ago ESL launched its first service along the UK/ North West Europe, which was then the major sector of the country’s import and export trade. In the course of its development ESL has further expanded its service routes to include the Mediterranean and Adriatic Sea regions, the Far East areas and the Persian Gulf region in view of the growing traffic movements on these routes.
In the Red Sea areas too, ESL provides coastal services mainly to the port of Jeddah and is also engaged in petroleum product transfer operation. At present ESL uses the port of Djibouti as its base and provides liner services to specific ports abroad on regular sailing schedules. Subject to sufficient inducement, ESL ships also call at other ports enroute. Table 2.2 presents advertised ports of call and service frequency.
2.3 Organisation
The Ethiopian shipping line is managed by a general manager who is responsible to the board of directors. He is responsible for carrying out the board’s directions dealing with all major policy issues including finance, senior executive appointments, introduction of new services and major decisions of capital expenditure including acquisition of new and second hand tonnage.
Tianjin and Djibouti. At present the total number of shore based and sea-going personnel stands at about 530. The organisational chart is presented in figure 2.1.
Table 2.2
Advertised service schedule
Service route Ports of call Service frequency
Red Sea/North Europe Lehavre
Antwerp Rotterdam Bremen M’brough Hamburg Uddevalla Gdynia
Every 3 weeks
Red Sea/Mediterranean Livorno
Barcelona
Every 3 weeks
Red Sea/F. East/E. Africa Yokohama
Osaka Kobe Bussan Tianjin Singapore Mombassa
Every 4 weeks
RedSea/PersianGulf& Indian sub continent
Sharjah Mumbai
Every 2 weeks
Red Sea/Adriatic On inducement
Figure 2.1
Organisational chart of ESL
Source: ESL
2.4 Analysis of current situation
Under the existing government the national cargo preference which ESL used to enjoy in the past, have been removed and ESL is required to be efficient and profitable and improve its capability to operate in a competitive environment. In the face of, increasing competition on all its service routes, declining freight rate levels, escalating operating costs and the need of having to replace the greater part of its ageing fleet with in the next few years, the company appears to be at a critical stage of its development.
CONTROLLER CONSULAR
MGMT SERVICE
Q.ASSURANCE OVERSEAS OFFICE
OPERATION
CGO BOOKING & SALES
CUSTOMER SERVICE MARKETING
MAINT & REPAIR
SUPPLY & STORES
SAFETY& PREVENTION TECHNICAL
PLANNING
RESEARCH & ROUTE DEVT
MGMT INFORMATION PLANNING
TREASURY
GEN ACCOUNTS
FIN ANALYSIS & BUDGETS FINANCE
HUMAN RESOUCE ADMN
GEN SERVICE HUMAN RESOURCE GENERAL MANAGER
2.4.1 Depressed freight rate levels
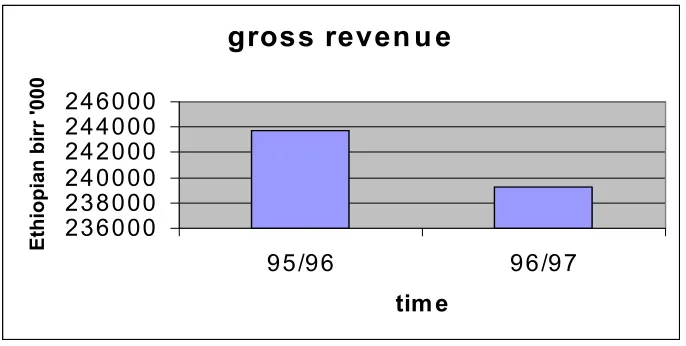
Due to the globalisation and liberalisation of world trade as well as the introduction of free market economy policy in the country, situations became more challenging for ESL because of increasing competition. In the last few years freight rates have been pushed down to their lowest level. For instance, prior to 1996 the sea freight for one twenty-foot container from the port of Assab to Yokohama was USD 2300. However, in 1996, in order to match the competition, ESL was forced to revise its rate to USD 1350, a decrease by about 59%. Similarly the freight rate from Assab to various ports in the North continent and Mediterranean region has decreased from US$ 1950 to US$ 1350 for 1x 20 container. Substantial rate decrease has also been noted on the inward cargo during the same period.
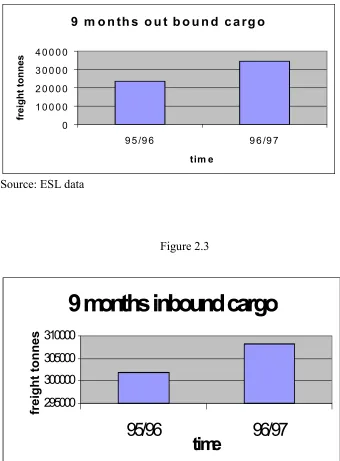
The effect of the decrease in freight rates can easily be seen by comparing the line’s nine months performance during the 1996/97-budget year (July 1st 1996 to march 31st 1997) against the same period of 1995/96-budget year. During the 9 months of 1996/97, the Ethiopian shipping line transported a total of 342703 tons of cargo comprising 34513 tons of export and 308190 tons of import cargo. While in 1995/96 the total cargo carried by ESL stood at 325411 tons, comprising 23571 tons of out bound and 301840 tons of inbound cargo. The total cargo lifted during the nine months in 1996/97 has increased by about 5.3%.
In addition to the shift in base port, the 1998 Asian crisis has also contributed to the decrease in the revenue to a certain extent.
Figure 2.2
Source: ESL data
Figure 2.3
Source: ESL data
9 m o n th s o u t b o u n d c a rg o
0 1 0 0 0 0 2 0 0 0 0 3 0 0 0 0 4 0 0 0 0
9 5 /9 6 9 6 /9 7
tim e
fr
eight
t
onne
s
9 months inbound cargo
295000 300000 305000 310000
95/96
96/97
time
Figure 2.4
Source: ESL data
Prior to May 1998, the Eritrean ports of Assab and Massawa used to serve as the main gateway for the Ethiopian trade. Assab and Massawa have no dedicated container terminal. The fact that they are conventional ports equipped with shore mounted cranes, has made these ports suitable for the type of vessels ESL operates. While the competitor lines mainly container operators, serve Assab and Massawa mainly through the hub ports of Djibouti and Jeddah.
The shifting of Ethiopian trade from the ports of Assab and Massawa to Djibouti has brought ESL in to direct competition with the bigger international container operators who provide regular sailing frequency from Europe and Asia to the port of Djibouti. Due to the shift in port of entry for the Ethiopian trade, all competing lines, which used to serve the Ethiopian trade through Assab and Massawa by way of transhipment, have managed to save about USD 400 to 500 from the container handling alone. That is,
-Loading on to the feeder vessel at Djibouti USD 115/teu -Terminal handling and tallying at Djibouti about USD 115/teu -Discharging from the feeder vessel at Assab USD 100/teu -Shore handling at Assab USD 100/teu
gross reven u e
236000 238000 240000 242000 244000 246000
95/96 96/97
tim e
Ethiopia
n
bir
r '0
The above estimated saving is computed on the assumption that containers will be connected to the feeder vessel within the allowed free storage time. In addition to the savings from the container handling, the operators have also managed to save:
♦ All costs connected with the running of feeder vessels. That is, operating, capital or daily charter hire and voyage costs of feeder vessels.
♦ Costs connected with the repositioning of empty boxes from Assab and
Massawa to Djibouti, as the number of containers on the inward leg by far exceeds the number of out bound boxes from Assab and Massawa.
Therefore, due to the cost reduction and that of exploiting economies of scale by handling large volumes, the competitor lines have been able to provide a higher quality service at lower competitive container rate than ESL. As a result, the need to compete with the big container operators has seriously affected ESL’ financial performance.
In view of the above, the freight rate of one teu from north European ports to Djibouti has gone down from USD 1400 to about USD 800. Moreover, the shift in the port of entry to Djibouti with its container terminal, has assisted the trend of containerisation of general cargo bound to Ethiopia which gives competitor lines higher competitive advantage over ESL. The situation was further aggravated by the 1998 Asian crisis. Unsurprisingly, the effect of economic turm oil in Asia has manifested it self in decreasing freight rates and lower charter revenues. Therefore, competitor lines operating in the main east/west trade were willing to accept very low freight rate from European ports to Djibouti during their eastbound leg.
2.4.2 Operational performance
about 84% of the fleet capacity in terms of dead weight, was built in the mid 80s and early 90. This part consists six multi purpose vessels.
The operational flexibility in terms of the range of cargo they can carry has made these vessels the corner stone for ESL. The remaining are two late 70s built general cargo vessels, three similar age small ro/ro ships and one late 80-built product carrier. Out of the three ro/ro vessels, ro/ro Meskerem, has been put up for sale and is at Djibouti anchorage since June 1998 waiting for suitable candidate to buy her.
The fleet has a total container loading capacity of 3274 teus. The flexible nature of the fleet has made ESL capable of handling a wide range of cargoes. The larger multi purpose vessels (namely Netsanet, Tekeze, Abbay wonz, Andinet, Admas, Abyot) are equipped with cranes which enable them to handle loaded twenty foot and forty foot units from most holds. The smaller general cargo vessels have lower capacity cargo handling equipment in line with non-containerised parcel requirements. The ro/ro vessels have limited general cargo handling equipment as they were originally designed for handling wheeled cargo.
The designed service speed of the larger vessels is around 15 knots and that of other ships is around 10 knots. With the exception of m/v Tekeze, the remaining vessels though generally in good condition, are requiring increased maintenance. Currently ESL owns about 2500 twenty equivalent units. The company also leases a varying number of boxes to meet operational requirements.
2.4.2.1 Capacity utilisation
and about 1000 tons during their northbound leg. Under the cost reduction scheme, the Mediterranean service is presently covered by the vessels operating in the north continent ports during their north and southbound legs.
The Far East service is provided through the switching of an appropriate number of the north continent scheduled multi purpose vessels on to a Far East route. In 1998/99 westbound parcel size per ship averaged 7150 tons consisting of break-bulk shipments, containers and vehicles, where as the east bound was almost nil. The Persian Gulf and Indian sub continent service has been maintained using the four smaller vessels. Westbound shipment averaged 2000 tons of combined cargo where as the east bound cargo averaged 200 tons per vessel.
Table 2.3
ESL fleet capacity utilisation during 1997/98 & 1998/99
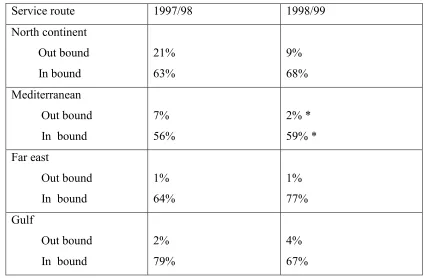
Service route 1997/98 1998/99
North continent Out bound In bound 21% 63% 9% 68% Mediterranean Out bound In bound
7% 56% 2% * 59% * Far east Out bound In bound
1% 64% 1% 77% Gulf Out bound In bound
2% 79%
*Shows six months performance by m/v Keiy Kokeb and Wolwol in the first half of the year. In the second half of the year, these two vessels were pulled out and the service route was covered by the North continent vessels.
2.4.2.2Time in port
One of the disadvantages in operating general cargo and multi purpose vessels is the relatively longer stay in ports. In view of this, the Ethiopian shipping line service seems to suffer from a high level of port related delays. The ships on north continent and far east services, on an average spent equal time in port and at sea. Those on the gulf service spent about 65 percent of the service time in port and the balance 35%, at sea.
2.4.2.3Scheduling
One of the operational features of liner shipping is to be able to provide transport services with fixed sailing schedules. The norm of the present day liner shipping has in fact become fixed day weekly service. Hence adherence to the advertised sailing schedule is very critical for the reliability of a liner company. In 1998 the average arrival variance for the different service routes was as follows:
-- North continent trade route about 6 days - Mediterranean trade route about 4 days - Far east trade route about 7 days
- Gulf service about 4 days
Average arrival variance at Djibouti during 1998 has been 5 days while the average sailing variance was noted to be about 8 days. The low productivity and concentration of calls at Djibouti has significantly increased the departure variance.
2.4.3 Financial performance
showed its first disappointing result. Figure 2.5 presents the net profit/loss of ESL in the past seven years.
Figure 2.5
Source: ESL data
As can be seen from the above figure, ESL made a loss of about USD 1.5 million in1997/98 and about 2.5 million USD in 1998/99. (As the exchange rate varies from time to time, an average rate of Ethiopian birr 7 & 7.6 to US dollar has been considered for both years respectively). Table 2.4 shows the balance sheet of the company as of June 30 1999.
Having seen the balance sheet it seems the company is in a critical financial condition. The current and quick ratios clearly indicate that the company is not in a position to meet its immediate obligations.
Current ratio = 0.64 Quick ratio = 0.60
Net PROFIT
-40 -20 0 20 40
92/93 93/94 94/95 95/96 96/97 97/98 98/99
TIME
Table 2.4
Balance sheet as of June 30, 1999 Cash Receivables inventory 65699000 46420000 8000000
Long term loan current maturity Provision and accruals Other acc.payables 88075000 31649000 68169000
Total current asset 120119000 Total current liab 187893000
Net fixed asset Investment Deferred charge
229135000 30000 23891000
Long term loan State capital Un-appropriated surplus 86412000 81867000 17003000
Total fixed asset 253056000 185282000
Total asset 373175000 Total laib&equity 373175000
Source: ESL
With the on going decreasing trend in freight rate and escalating operating costs the future looks consequently bad. Hence it is high time for ESL to look at its financial performance. There are two alternatives to improve the financial status
A. increase the revenue B. reduce the costs
Chapter III Cost control
A paper presented by Patrick Donner on the Essential Maritime Transport, Cost Control defines cost as “The price we pay for making or producing goods and services or the price we pay for obtaining goods and services”. Among other things, the primary concern of any business enterprise is to maximise its profit in order to grow and expand. Profit can be maximised by either increasing the revenue or decreasing the cost or applying both simultaneously.
Profit = Revenue - Cost
Cost can be characterised by the word sacrifice and is in the management’s interest to control and reduce the sacrifices involved in achieving desired results where possible. In the broader sense costs are equivalent to sacrifices of various types as:
♦ Non financial costs: costs which are not directly traceable through the company’s cash flow statement, for instance lowering of morale of employees due to dissatisfaction.
♦ Non cash costs: costs, which are financial sacrifice that do not involve cash out lays. E.g. depreciation.
♦ Cash costs: costs that are reflected in actual cash out lays.
key success factors in today’s business environment is cost leadership. In view of this, business enterprises have to make use of their limited resources in a more efficient and effective way in order to remain competitive. In order to ensure maximum efficiency and effectiveness, managers need to plan, organise, implement and control. Controlling is a vital managerial function and is concerned with such tasks as setting goals and objectives, drawing plans and assessing their accomplishment, measuring actual performance against established targets and standards and identifying and rectifying as required, any deviations between actual and desired performance. The existence of control process helps management to know the position of the organisation in relation to a predetermined future position.
Henri Fayol defines control as “ In an undertaking, control consists of verifying whether everything occurs in conformity with the plan adopted, the instructions issued and principles established. It has an objective to point out weaknesses and errors to rectify them and prevent recurrence. It operates on everything, things, people and actions”.
Figure 3.1
The process of controlling
Source: principles of management handout
In short, cost control is concerned with keeping costs at their planned level. That is, conforming in so far as possible to the existing standards and plans. Hence control and planning are complementary to each other. Information is the basis and prerequisite for the success of effective cost control. With respect to this, accounting reports shall be presented in such a way that those related with cost incurrance could understand them fully and react to them as may be appropriate. More over, all concerned with cost incurrance and cost control should be able to get the right information at the right time and in the right place. Information pertaining to actual results should be related to a yardstick of performance, a predetermined plan, budget or standard. In the absence of this comparison there can be no meaningful basis for evaluating achievements and hence no effective way of controlling.
How ever the term right information does not necessarily or always mean that the information must be 100 percent correct. Information is right when it has the right effect at the time of decision for the person who is to decide. There are different types of cost control techniques applicable in different organisations. Such techniques include responsibility accounting, cost accounting, differential costing, discounting techniques, budgeting, standard costing, etc. However, the most widely spread and commonly used tools of cost control are budgeting and standard costing.
Budgeting is an essential management tool used for short term planning and control. Traditionally budgeting was intended for restricting expenditure. But a much more useful and constructive way of looking at is to treat the budgeting process as a means for achieving the most effective and profitable use of the company’s resources through planning and control. The following are the steps involved in budgeting in order to secure control over performance and cost.
♦ Preparing of budgets.
♦ Comparing actual cost and achievement against budgets.
Standard costing or standard costs are costs that should be achieved under efficient operations. They are predetermined costs, which can be used as a benchmark against the actual costs.
3.1 Design of a cost control system
There is no standard or specific system of cost control that can be applied for all organisations. The system designed should perfectly fit the organisation for which it is intended. However, the following points need to be considered at the time of designing and installing a cost control system.
♦ Priority to be given to the speed of information. Unless the right data are
available in time to influence results, one does not have management at all.
♦ The system should be adapted to the size, structure and operation of the
organisation and must be simple and easy to operate.
♦ The cost of installing and maintaining the system.
♦ The system must be fully supported by the top management.
♦ The system must be integrated with other systems in operation.
♦ The system should consist clear and detailed procedures and include reporting to various levels directly or indirectly concerned with the problems.
3.2Ship costs- an overview and a brief introduction
So far there is no internationally accepted standard of cost classification in shipping. There are various criteria of cost classification. However the most commonly used approach is to classify ship costs into four categories.
3.2.1Operating costs
♦ Manning costs: manning costs are mainly influenced by the type of vessel, the degree of automation, the regulations of the flag registry, the nationality of the crew and how much on-board maintenance is required. The minimum crew requirements are set by the safety aspects of sailing a ship as defined by the International Maritime Organisation. Apart from that, flag states that is, countries under whose flag a ship is registered may impose additional requirements. The nationality of the crew is another important issue in determining manning costs. American or European crew are more expensive than their counter parts from the developing counties. The degree of automation and the amount of maintenance required on-board are also important factors affecting the manning cost. That is, the more automated the less number of crew required. The size of the crew is directly related to the amount of maintenance required on-board. Crew costs are generally divided into three groups:
Wages: basic pay, overtime, special work payments, leave pay, social security, bonuses, etc.
Travel costs: fares, perdiem subsistence allowance, baggage etc. Other costs: medical expenses, training, clothing, etc.
♦ Stores and lubricants: stores can be divided into deck, engine and catering or victuals. They are expenditures necessary to maintain the ship and to feed the crew. Apart from victuals they are mainly ropes, wires, paints, grease and spares. Lubricating oils are an essential part of the engine room stores. They are expensive and dependent upon the sailing periods of the ship. Lubricating oil costs tend to increase with the age of the ship.
♦ Maintenance and repair costs: Maintenance can be categorised into routine
stringency of checks on older vessels. During low freight rates, this is the area in which ship owners first start to cut the corners, as some of the expenditures are only required for preventive maintenance.
♦ Insurance cost: a ship has to be insured against all sorts of risks. The factors, which most affect the cost of insurance, are the actual value of the ship and the scope of coverage. Premium paid by the ship owner is the cost of insurance. The ship owner’s most basic insurance covers are hull & machinery (H&M) and protection and indemnity (P&I). In special circumstances the ship owner may insure the ship against war risks, loss of hire, etc. The hull and machinery insurance covers all the physical aspects of the ship; hull, equipment and machinery. In which the owner has a direct insurable interest. The risks are placed with underwriters in the insurance market. The premium depends on various factors such as the flag of the ship, age, type, size, claim history, crew, management, trading area, etc. P & I covers the shipowner for liabilities emanating directly from the operation of the ship. This invariably tends to be third party claims from cargo owners, crew, port authorities or environmental agencies, etc. Traditionally, P&I has been covered by mutual insurance between shipowners handled by the P&I clubs.
♦ Overhead costs: the shipowner has to manage the technical operations,
commercial operations, crewing and other administrative functions which are required to run a ship. The whole of these management functions are called administration or overhead and the expenditures as overhead costs.
3.2.2 Voyage costs
♦ Bunker costs: Fuel is the most dominant single cost item in the running of ships. The fuel consumption of a ship is dependent on various factors such as the size of the ship, the condition of ship’s hull, the laden condition, the speed of the ship, the weather, the type and capacity of the main engine and auxiliaries, the type of fuel and the quality of fuel. Bunker costs depend on the quantity of fuel consumed and the price of the fuel oil. The price of fuel is determined by the world oil price and the location where the fuel is taken on-board. As the volume of oil varies with the temperature, the ship owner has to keep on monitoring the temperature of the fuel while bunkering. Moreover, the quality of the fuel oil has to be specified and tested to ensure optimum engine performance.
♦ Port charges: port charges comprise berth dues, towage, pilotage, light dues,
wharf dues and many other costs connected with arrival, port stay and departure of the ship. These charges are mainly dependent on the time spent in ports, ship’s size and the applicable tariff rate in a particular port and vary widely from port to port. There is little a shipowner can do about these charges, as he cannot avoid them. However, a fast turn-round service and proper scheduling of voyages to avoid unnecessary waiting in ports can reduce the amount of these costs significantly.
♦ Canal dues: canal dues are paid when ships are transiting through the canal. The most important and commonly used are the Suez and Panama canals. Canal dues are charged according to the size of the vessel, the laden condition (whether in ballast or laden) and the cost of alternative routes for the canal.
3.2.3 Capital costs:
♦ The new building or second-hand price of the ship, which is highly influenced by the freight market condition and other costs related to acquisition of the ship.
♦ The financing arrangement that is, how much money is borrowed and how much
is the owner's own capital.
♦ The interest rate for borrowed money which depends on the size of the loan, the solidity of the owner, the collateral offered and the general level of interest rates.
♦ The opportunity cost for own capital, that is, the return that would have been generated by investing the capital in some other projects.
♦ The economic life of the ship.
In short, capital costs are determined by the depreciation, interest payment and return on owner’s equity.
3.2.4 Cargo handling costs
Cargo handling costs are expenses incurred in loading, discharging, stowing, trimming, lashing, securing, weighing, etc. These costs are determined by such elements as the type of commodity, the quantity, the ship type, the terminal and port characteristics. Labour is the principal element of cargo handling cost. Its costs vary from port to port and are usually higher in ports with skilled and efficient work forces than in poorly equipped ports.
3.3 Cost control in shipping
disappointing operating results. The following expression taken from the monthly Containerisation International highlights the situation in a more profound manner.
“The liner shipping industry has been lamenting abysmal financial performance since the age of clipper ships. During testimony before the US congress in May 1999 on anti-trust aspects of the ocean shipping reform act of 1998 evidence was presented that the return on equity of the liner shipping industry was only about 2% on average from 1993 through 1997.” (Containerisation International, September 1999).
As we are living in a time of dynamic global growth and development, shipping companies have to establish strategies on improving the basic service to the customer at a lower cost to the operator. The success of a shipping company will largely depend on how best it can utilise its resources and cost control is an essential tool to achieve better utilisation of resources. Moreover, shipping is an industry of international character; a huge percentage of earnings are spent abroad for running ships. Therefore, it is of a vital importance for a shipping company to analyse and adjust its cost elements. What is required is not only a preventive action (cost control) but a corrective action (cost reduction). In view of this it is necessary to:
♦ Examine all costs related to the acquisition and operating of ships.
♦ Review standards for operating cost.
♦ Review standards for operating performance.
♦ Identify areas of operation where the standards are not achieved.
♦ Take corrective actions based on variances from desired performance.
technique of cost control. A planned programme of cost control is an invaluable aid to the industry in increasing its efficiency and effectiveness.
Chapter IV
Possible cost saving areas in the commercial operations of ESL
In chapter III we looked at the various types of ship costs in brief. Namely, capital, voyage, cargo handling and operating costs. Unlike tramp shipping, in liner trade almost all ship costs except those of cargo handling are fixed costs. A liner operator is committed to provide fixed service at regular intervals between named ports. Hence fixed itinerary in a regular service, to sail whether filled or not, on the date specified on the schedule are what distinguish liner shipping from tramp. In this respect, expenses such as bunker cost, port charge and canal dues which fall under the variable cost in the tramp shipping are fixed costs under the liner shipping. Due to this fact the organisational requirement and cost structure of a liner operator is quite different from a tramp operator.
Establishing a cost control system is not an end objective by it self. What is important in the present day shipping is to be able to provide quality service to the customer at a lower cost to the operator. In the present competitive market situation, cost reduction and cost leadership are very vital for the survival and success of a shipping company. Therefore, it is high time for ESL to exert maximum degree of control over its operating, voyage and cargo handling costs in order to achieve positive operating results and ensure its survival and long term growth.
services are often required to come together to form alliances. During the last few years ESL made disappointing operating results due to low freight rates and escalating costs. Figure 4.1 below presents the poor operating results during the last three fiscal years.
Figure 4.1 Revenue verses cost
Source: ESL data
This chapter looks at some possible cost saving areas in the commercial operations of ESL.
4.1 Port charges
Expenses incurred with in a port fall into one of the two categories, those attributable to the vessel and those related to the cargo. In tramp shipping the responsibility for cargo related costs depends on the charter arrangement under which the ship is being employed, very often concluded on free in free out (FIO) basis. However, in liner shipping, all cargo related costs come under the operator. Port charges include wharfage or berthing dues, light dues, mooring/unmooring, towage or provision of tug assistance, pilotage, lock entry/exit costs, etc.
0 50000 100000 150000 200000 250000 300000 350000
1996/97 1997/98 1998/99
Year
Ethiopian Birr '000
It is probably true that there is little a shipowner can do on port tariffs as they are official tariffs levied against some ship measure which could be related to dwt, gt, nt, etc. Very often, items such as berthing or wharfage dues are charged as a rate per day or fraction thereof. Nevertheless in privately owned and operated berths the tariffs for berths and other related services such as tug assistance and mooring/unmooring could still be open for negotiation.
In 1998/99 fiscal year, ESL paid Birr 17,380,000 (USD about 2,286,842) for port related expenses, out of which about 50% is estimated to be wharfage or berthing due expenses. Table 4.1 below presents break down of the voyage cost during the 1998/99 fiscal year.
Table 4.1
Voyage cost breakdown during 1998/99
‘000 BIRR
Bunker cost 21323 34.6%
Port charge 17380 28.2%
Canal due 22934 37.2%
Total voyage cost 61637 100%
Source: ESL data
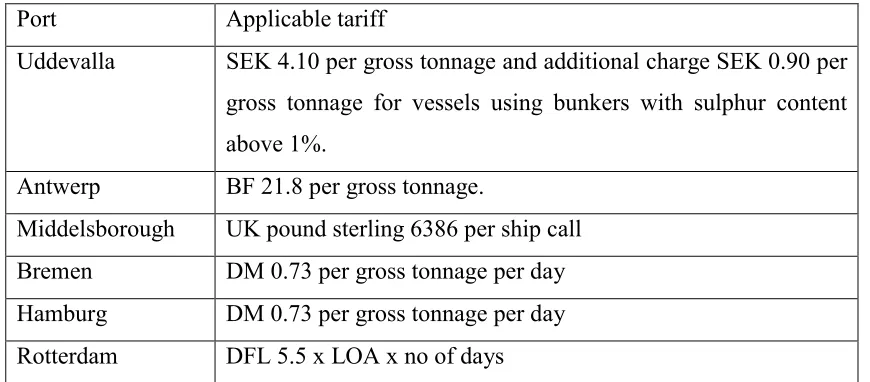
The structure of port tariffs in the North continent ports vary from port to port significantly. In ports like Antwerp, Uddevalla and Middlesborough the berthing fee is fixed, irrespective of the time vessels stay in port. Where as in others like Hamburg, Bremen and Rotterdam the berthing fee is directly proportional to the vessels stay in port. Table 4.2 below shows berthing due tariffs of North continent ports applicable for ESL vessels.
Table 4.2
Berthing due tariffs of representative North continent ports
Port Applicable tariff
Uddevalla SEK 4.10 per gross tonnage and additional charge SEK 0.90 per
gross tonnage for vessels using bunkers with sulphur content above 1%.
Antwerp BF 21.8 per gross tonnage.
Middelsborough UK pound sterling 6386 per ship call
Bremen DM 0.73 per gross tonnage per day
Hamburg DM 0.73 per gross tonnage per day
Rotterdam DFL 5.5 x LOA x no of days
Source: ESL data
port of Tianjin berthing charge is a fixed sum based on the vessel’s net tonnage. In the Red Sea port of Djibouti and Mumbai the berthing charges are time dependent, based on the vessels gross tonnage and the duration of stay in berth. In addition to the normal tariffs, the various ports do apply surcharges for the services and work done during the weekends, night hours and outside the normal weekday working hours. Applicable surcharges of some representative ports are presented in table 4.3 below.
Table 4.3
Surcharges of representative ports
Port Type of service Over time Surcharge
Yokohama Pilotage, Towage &
Mooring/Unmooring 1630-2200hrs 2200-0600hrs 0600-0830hrs Holidays + 60% + 110% + 70% + 50%
Bussan Pilotage, Towage &
Mooring/Unmooring
Night time Holidays Noon off hours 2400-0400hrs
+ 50% + 50% + 50% + 100%
Tianjin Pilotage, Towage &
Mooring/Unmooring
Holidays, normal working days night shift
Holidays night hours
+ 50%
+ 100%
Rotterdam Towage
“
Mooring/Unmooring
Friday 1700hrs till Monday 0700hrs
1700hrs the day before holiday till 0700hrs the day after such holiday
Weekends & holiday
+ 25%
+ 25%
4.1 The need for operational planning and standard setting
In depressed freight markets, erosion of earnings by port charges could be significant and provide unpleasant operating results. With no sign of freight rate improvement, they may be en route to becoming a serious concern. “The best way to make money is to stop losing it” appears to be a good proverb in particular for small national shipping companies like ESL.
As cost control is a key to survival, ESL needs to properly plan the cargo operations of its vessels, set out performance standards and evaluate actual performance against standards. The company’s scheduling procedures should be based on the performance standards established and any variations need to be analysed and timely corrected.
It is worth noting that the duration of vessels’ stay in respective ports is a vital element in the company’s cost structure. In order to achieve quick turnaround of vessels and reduce wharfage dues it is imperative to properly plan and prepare pre stowage of vessels. Information about cargo composition should be made available to ships’ command to facilitate preplanning in time. Occasionally it is not uncommon to note that, cargo on board has to be discharged first prior to commencing loading operations into same hatch which has a negative effect on port expenses.
Table 4.4 Operational report
Vessel Voyage Port Day Shift No of gangs Tons
Friday 1st 1 210
Monday 1st 1 205
Monday 2nd 176
Tuesday 1st 2 202
Abbay Wonz 53 Hamburg
Tuesday 2nd 1 385
Friday 1st 1 86
Monday 1st 2 704
Monday 2nd 1 113
Tuesday 1st 1 128
Abbay Wonz 53 Bremen
Tuesday 2nd 1 339
Monday 1st 1 107
Monday 2nd 1 121
Tuesday 1st 1 232
Tuesday 2nd 1 246
Wednesday 1st 1 257
Wednesday 2nd 1 124
Thursday 1st 1 198
Thursday 2nd 1 106
Abyot 50 Hamburg
Friday 1st 1 442
Monday 1st 1 317
Monday 2nd 1 231
Tuesday 1st 1 140
Tuesday 2nd 2 154
Admas 11 Bremen
Wednesday 1st 1 339
Having seen the above operational reports, one finds that a lot has to be done with regard to proper planning of cargo operation. Surprisingly, one can hardly see any of the above vessels operating with three gangs at a time, despite the fact that all of them have seven hatches and five holds. For ships trading in German ports which are more or less similar in size with the exception of M/V Tekeze, the average daily wharfage due is about DM 8500. Therefore, for every single day delay in these ports about DM 8500 is always at stake.
It seems there is every reason to believe that the cargo operations of above vessels could have been facilitated if adequate number of gangs were deployed instead of slowing down with one gang per shift. Presumably, at least about 50% of the wharfage or berthing dues would have been saved if the vessels were made to work with adequate number of gangs. It is true that unforeseen events such as weather conditions, technical assistance required by vessels or late arrival of cargo may interfere into loading or discharging programmes, but nevertheless by increasing the number of gangs per shift a fast turnaround of vessels with desired savings in cost structure could be realised.
between the Red Sea and North continent ports, it takes about 15 days from the last Red Sea port mainly Djibouti to the first North continent port.
After considering all the external factors such as the sea and weather conditions, if a vessel’s expected time of arrival at the first European port fall into the weekend the proper action would be to adjust the expected time of arrival by slowing down and steaming at economic speed. This helps not only to minimise the wharfage due by avoiding weekend call but to make savings from the bunker consumption as well. It is estimated that about four to five tons of fuel oil per day can be saved by steaming at economic speed which in turn would be a saving of about USD 500 to 700 per day depending on the bunker price. Table 4.5 below shows weekend calls at North continent ports in 1999.
Table 4.5
Weekend calls at North continent ports in 1999
Vessel Voy Port Berthing date Remark
Abbay Wonz 64 Hamburg Sunday 28/11 1st European port
Abbay Wonz 63 Bremen Saturday 25/9 1st European port
Abbay Wonz 63 Rotterdam Sunday 3/10
Abyot 57 Bremen Saturday 1/5 1st European port
Abyot 58 Bremen Sunday 17/7
Admas 21 Bremen Saturday 24/7 1st European port
Andinet 56 Rotterdam Sunday 17/1
Andinet 56 Hamburg Saturday 23/1
Andinet 58 Hamburg Saturday 3/7
Netsanet 55 Bremen Saturday 20/3 1st European port
Netsanet 55 Hamburg Sunday 28/3
Netsanet 56 Hamburg Saturday 5/6
Netsanet 58 Hamburg Saturday 13/11
Tekeze 2 Bremen Saturday 2/10
As can be seen from the above table, it seems that with proper voyage and operational planning in place, there is a potential for cost saving from port related expenses. In ports like Antwerp, where the wharfage due is fixed irrespective of the duration of stay, surcharges that are payable to such ports could be reduced by minimising weekend calls. Where as in ports like Bremen in addition to the surcharges the daily wharfage dues could also be avoided. After all no cargo operation is carried out during the weekends. Based on historical data, ESL seems to suffer from port related delays mainly in its North continent service. In 1998/99 the average port stay for vessels trading in the major North continent ports was around four to five days. The range varies from 2.5 days in Uddevalla to about 5.5 days in Antwerp. During the same period the average berth stays in Rotterdam, Bremen and Hamburg were 5.3, 5.1 and 3.7 days respectively. In the Mediterranean service the average stay was about two days. For the vessels trading in the Persian Gulf and Indian subcontinent service the average stay was about 7 days.
Table 4.6
Time related average wharfage due of some selected ports
PORT Average wharfage due per
day
Vessels
Hamburg DM 8500 Abyot, Abbay Wonz,
Admas, Tekeze, Andinet, Netsanet
Bremen DM 8500
-do-Rotterdam DFL 791
-do-Mumbai USD 546 WelWel, Kei Kokeb,
Karamara, Omo Wonz
Djibouti (1) USD 338 Abyot, Abbay Wonz,
Admas, Tekeze, Andinet, Netsanet
Djibouti (2) USD 195 WelWel, Kei Kokeb,
Karamara, Omo Wonz Source. ESL data
M/t Awash has been excluded from the table because very often the cargo operation is completed in less than 24 hours implying that there is little or no room for cost saving. Above figures are computed on the basis of the size of vessels calling at the respective ports and the prevailing tariffs applicable to each port. However, as all the vessels calling at each port are not identical in size, an average of the various ships size relevant to the particular port has been considered for the purpose of computing the figures.
between 2 to 2.5 days. That is, with a proper voyage and operational planning which includes increasing the number of gangs per shift and avoiding weekend calls when ever possible, the average duration of stay could come down from 3.7 and 5.1 days to around 2.5 days each at Hamburg and Bremen. Consequently the wharfage/berthing due paid could have been reduced to DM 326774 resulting a saving of DM 220170. For most practical reasons, the average duration of stay in Rotterdam could be set at 2 days, as it is very often the last port of call in the North continent ports. In 1998/99 ESL paid DFL 66572 for wharfage/berthing due in the port of Rotterdam. In the same manner, a saving of DFL 41450 could have been made if the average duration of stay was decreased to a bare minimum of 2 days.
With proper operational planning and cargo co-ordination the average duration of stay in Mumbai could probably be reduced from 7 to 3.5 days. In 1998/99 ESL paid USD 87643 for wharfage dues in the port of Mumbai. Based on the 3.5 days stay about 50% of the total amount paid during 1998/99, that is, about USD 43821 could have been saved. During the same period ESL paid USD 210178 for wharfage dues at Djibouti. Out of which USD 117499 was paid for the bigger vessels (Djibouti (1) table 4.7) and the remaining USD 92679 for the smaller vessels (Djibouti (2) table 4.7). Nevertheless, with a proper planning the average duration of stay for the smaller vessels could reasonably be reduced from 13 to 7 days while the bigger vessels’port stay could come down to about 10 days. In line to this, the wharfage due could have been reduced to USD 69117 and 49904 for the bigger and smaller vessels respectively.
the ships’ command for their view and comment during the commencement of each voyage.
Table 4.7
Estimated savings during 1998/99
Port Average duration of stay per vessel (days) in 1998/99 Actual wharfage due paid in 1998/99 Duration of stay based on performanc e standard setting (days) Estimated wharfage due as per standards
Saving
Hamburg 3.7 DM 316282 2.5 DM 213704 DM 102578
Bremen 5.1 DM 230662 2.5 DM 113070 DM 117592
Rotterdam 5.3 DFL 66572 2.0 DFL 25122 DFL 41450
Mumbai 7 USD 87642 3.5 USD 43821 USD 43821
Djibouti(1) 17 USD
117499
10 USD 69117 USD 48382
Djibouti(2) 13 USD 92679 7 USD 49904 USD 42775
Source: ESL data
4.2 Cargo handling costs
Cargo handling costs comprise all kinds of costs attributable to the cargo, such as loading/unloading, tallying, storage and other logistical elements relating to the cargo. Cargo handling costs are dependent on a number of factors, such as the type of commodity, the quantity, the ship type, the terminal and port characteristics. They may be divided in to two groups.
by the authorities. The tariff will also specify which operations are included in the rates and which are considered as extras and what charges in that case will be. In the traditional liner shipping most stevedoring contracts stipulate the basic rate per ton or per unit for normal handling of cargo during normal working hours. For any work out side of the normal working hours extra charges are stipulated on the contract.
B) Extra costs not covered under A:- The most commonly known extra charges in
the traditional liner shipping
are:-♦ Overtime: - with the exception of some container terminals where the rates cover round the clock work, most stevedoring contracts are based on normal working hours. Any work out side the normal hours will be subject to additional surcharges. The applicable surcharges may vary from 10% to 100% depending on the geographical location and the timing of the work such as holiday, Sunday, night shift, etc.
♦ Waiting time: - Very often the stevedoring contract is based on normal conditions what ever that may be. If the work is interrupted for reasons beyond the stevedore’s control, waiting time charge will be levied on the ship. The main causes for waiting time charge are late arrival of cargo, break down of cranes and equipment, bad weather and late arrival of vessel.
♦ Un used time: - Some stevedoring contracts stipulate minimum guaranteed
working hours for their dockers. Hence it is essential to properly plan in such a way that the working period could be utilised in the best possible manner.
♦ Extra equipment & labour: - In many ports the use of equipments such as cranes, forklifts, slings, etc are included in the basic rates. Where as the use of mobile cranes and heavy lifts might be considered extras and are billed for whenever used. In the same manner when extra men are needed for some cargo operations extra labour charge is levied on the ship.
shippers. So far very few door to door services have been undertaken by the company. The existing fleet structure has enabled the company to be able to provide a flexible combination of break bulk and container shipments in all its service routes. The type of break bulk shipments handled by ESL range from the traditional bagged cargo to various kinds of project cargoes.
In 1998/99 ESL paid Birr 37,731,000 (USD about 4,964,605) for cargo handling in all its service routes. This amount accounted for about 18% of the total cost incurred by ESL during the same period. Figure 4.2 presents cost breakdown of the company during 1998/99.
Figure 4.2 Cost breakdown
Source: ESL data
4.2.1 Stevedoring contracts
In ports where stevedoring tariffs are issued by government bodies such as the port authority, there is little that can be done to reduce the official tariffs by way of negotiating. However, in most ports of the world, stevedoring tariffs are subject to negotiation between the shipping company and the stevedoring company. As a huge
Cost breakdown during 1998/99
10%
42% 30%
18%
capital cost
operating cost
voyage cost
care. It is worth noting that the level of tariffs might, to a large extent, depend on the ability to negotiate. To this effect, it is very important to have the required knowledge and operational details of the port prior to commencement of negotiations. Moreover, negotiating on the level of the basic rate alone may not be enough, what is more important is what operations are included there in. It is worth to recall the old saying “ what you don’t make on tonnage, you make on dunnage”. Suffice to say that, what matters is the total cost per ton not the basic rate per ton.
The following are some of the operations that need to be negotiated along with the stevedoring contracts.
- Quay dues on cargo
- Tallying and delivery of goods
- Overtime charges
- Idle time
- Extra labour
- Equipment
- Lashing and securing cargo
- Opening and closing of hatches
According the report compiled by the finance department, ESL has paid USD 2,282,208.66 for cargo handling in all its service routes during the second half of 1998/99 (January 1st to June 30 1999). This figure is by far lower than the amount paid during the first half mainly because the quantity of cargo transported during the first half was higher than the second half. Breakdown of the cargo handling cost paid during the second half is presented in table 4.8. There is no reason to doubt that with proper voyage and operational planning, some of the costs such as early finish, idle time, storage, shifting and stevedoring over time would have been avoided or at least reduced to a bare minimum.
Table 4.8
Cargo handling cost breakdown during the second half of 1998/99
Cost item USD
Cargo watchman 589.59
stevedoring 1,833,034.87
Early finish 5,618.86
Equipment hire 35,639.47
Idle time 12,666.22
Storage 33,030.98
Lashing and securing 4,852.30
Tally 81,348.30
Receiving/delivery 97,277.33
Shifting 30,759.85
Stevedoring overtime 135,285.28
Trucking 12,105.61
Total 2,282,208.66
Source: ESL
instance, if the minimum guaranteed period per gang per shift is seven hours and if any one or all gangs complete their work with in four hours, the vessel pays for the remaining three hours as per the rate agreed in the contract. Presumably uneven distribution of cargo is one of the reasons that lead to such extra charges. That is, some of the holds could be heavy and others light resulting in one hold completing early, where as another hold had to work over time. Therefore, in order to avoid an early finish surcharge cargo stowage need to be planned properly. Moreover, depending on the circumstances, attempts should be done to switch gangs from one hold to the other whenever the work on the later hold does not justify having a full shift gang. In fact, ESL needs to exert maximum efforts to avoid such surcharges during the negotiation of stevedoring contracts.
♦ Idle time: - Idle time charges include for delays caused by weather, crane
operation. Apparently proper planning would also assist to avoid unnecessary shifting costs.
♦ Storage: - In general all ESL contracts provide free storage of cargo for certain specified time. The free storage period varies from one port to another. For instance, the free storage for full containers in Hamburg is 7 days while it is 14 days in Rotterdam and so on. Apart from attempts to increase the storage time ESL needs to maintain its sailing schedule in order to avoid such charges. In 1998 arrival times at North continent ports were on average 5 to 8 days later than originally scheduled. Table 4.9 shows the average variance for major destination ports between their first advertised estimated time and the actual arrival date.
Table 4.9
Sailing schedule variance in 1998
Port Average arrival variance Cancelled calls (numbers)
Antwerp 5 1
Barcelona 8 5
Bremen 5 0
Hamburg 8 1
Middlesborough 6 2
Rotterdam 6 1
Uddevalla 7 0
Source: ESL data
the kind of operations presented in tables 4.4 and 4.5 indicate that there is a need for proper operational planning. Once again the core point will be to properly plan the voyage and cargo operations of the fleet and compare performance with the plan. Planning and measuring performance against plans needs to be conducted continuously. Furthermore, it is worth noting that in order to cope with the unemployment situation caused by containerisation and other labour saving devices, there is a trend that many ports are trying to extend their normal working shifts. Therefore, ESL should try to convince stevedoring companies to extend their normal working time. At least efforts need to be done to include Saturdays as a normal working day in particular in the North continent ports.
From the fore goings, at least about 50% of the extra costs paid by ESL during the second half of 1998/99 could have possibly been saved if not avoided at all. The extra charges paid by ESL during the second half of 1998/99 is shown in table 4.10 below.
Table 4.10
Extra charges during the second half of 1998/99
Cost item Amount paid (USD) 50% saving
Early finish 5,618.86 2,809.43
Idle time 12,666.22 6,333.11
Storage 33,030.98 16,515.49
Shifting 30,759.85 15,379.92
Stevedoring overtime 135,285.28 67,642.64
Total 217361.19 108,680.60
Source: ESL data
4.3 Chartering-in /an alternative strategy
As mentioned in the previous chapters, the ESL fleet consists twelve vessels out of which the four vessels operating in the Persian Gulf are relatively older and smaller than the other vessels. The Persian Gulf service route mainly connects Djibouti with Sharjah in the United Arab Emirates and Mumbai in India. This part compares the performance of ESL vessels currently deployed in the Persian Gulf with an alternative strategy, which is maintaining the service by chartering other vessels. Currently this service route is served by M/v Keiy Kokeb, M/v Wolwol, Ro/Ro Karamara and Ro/Ro Omo Wonz. Except Ro/Ro Omo Wonz which is closer to 20 years, the remaining three vessels are over 23 years old. In addition to their ageing, their limited cargo handling capacity has made these vessels apparently unsuitable for the trade they are intended to serve. Table 4.11 shows cargo handling gears, speed and other relevant particular of these vessels.
Basically the cargo traffic in this service route consists various types of loose merchandise goods, drums, iron bars, steel sheets and containers. In order to cope up with the trade requirements it is imperative to have self sustained vessels. Apparently none of the vessels deployed in this trade route seem to be able to lift heavy cargo, in particular containers, with their own gears. In view of this expensive shore mobile cranes have to be used to accommodate such heavy cargoes. During the second half of 1998/99, ESL has paid USD 35640 for equipment hires in all its service routes, about 75% of which are estimated to be incurred in the Persian Gulf trade route.
factors. Nevertheless, Ro/Ro Karamara is still comparatively better equipped than Ro/Ro Omo Wonz as far as this service route is concerned.
Table 4.11
Relevant particulars of vessels operating in the Gulf route
VESSEL YEAR BUILT DWT GEAR SPEED*
Karamara 1976 2428 2 x 10t cranes 8.5
Omo Wonz 1981 3500 1 x 35t lift
2 x 3t lifts
9
Wolwol 1977 4135 2 x5/10t cranes
2 x10t derricks 8
Keiy Kokeb 1977 4135 2 x5/10t cranes
2 x10t derricks 8
* Average actual speed made good by respective vessels Source: ESL data