Response of Influence of Internal and External Factors
in the Latitudinal Sea Ice Edge Displacement in the Arctic Basin
A.E. Bukatov, A.A. Bukatov, M.V. Babii
Marine Hydrophysical Institute, Russian Academy of Sciences, Sevastopol, Russian Federation
e-mail: [email protected]
Inter-annual climatic response of the sea ice edge latitudinal displacement in the Arctic to variability of the large-scale atmospheric circulation (the Arctic Oscillation and North Atlantic Oscillation), location of the Gulf Stream northern boundary and solar activity in 1969–2012 is studied. It is noted that the most significant ice edge latitudinal displacements in the intra-annual cycle were observed westward of Novaya Zemlya and in the Bering Strait area. It is shown that, depending on the longitudinal sector, response of the edge geographical position to changes of the atmospheric circulation and the Gulf Stream indices can be manifested both quasi-synchronously and with a delay. Exceptions are the Greenland Sea and the Norwegian Sea areas as well as the Barents Sea western part where ice edge displacements advance the Gulf Stream index variation. The correlation between the edge latitudinal displacement along its perimeter and the Wolf numbers variation is assessed. It is received that the oscillations of cross-correlation functions with a period which is close to 11-year one (Schwabe Cycle) are observed on each longitude at that. In the variations of cross-correlation functions from their average position, solar activity variation is manifested in the edge position displacement with up to two-year delay.
Keywords: Arctic, sea ice, sea ice edge, dynamics of edge position.
DOI: 10.22449/1573-160X-2016-6-24-31
© 2016, A.E. Bukatov, A.A. Bukatov, M.V. Babii © 2016, Physical Oceanography
Introduction. Sea ice cover is an important component of global climatic
system. The dynamics of its condition in the Arctic Ocean is a key factor and indicator of climatic changes in the Arctic [1]. This condition is determined by the ice area, its thickness, concentration and other characteristics. They are affected by the atmosphere and hydrosphere processes which are due to both internal and external factors. Hydrometeorological processes caused by atmospheric circulation belong to internal factors, solar variability determined by the processes that take place inside the Sun and are accompanied by the changes of ultraviolet radiation, corpuscular fluxes and solar magnetic field [2] – to external ones.
Sea ice area oscillations in the Arctic Region are related to the change of its edge position [3]. Therefore, in the given paper the investigation of climatic response of the sea ice edge latitudinal displacement to the Arctic Oscillation (AO) and the North Atlantic Oscillation (NAO), as well as to the Gulf Stream northern boundary dynamics location and Wolf numbers of solar activity variation is carried out.
Data and methods. In the given work ВАDС [4] (1969 – 1981) and NCEP [5]
For investigation of sea ice edge dynamics (the first occurrence of ice with ≥15% concentration) a series of average monthly values of latitude of its location for each longitude degree from Greenland to North America along the northern shores of Eurasia was generated. Ice edge position intra-annual variability was determined by this data. Ice edge latitudinal displacement correlation with the Arctic Oscillation and North Atlantic Oscillation atmospheric circulation indices, as well as with Gulf Stream North Wall index (GSNW) and Wolf numbers, was assessed.
Intra-annual dynamics of ice edge position. Regional distribution of the
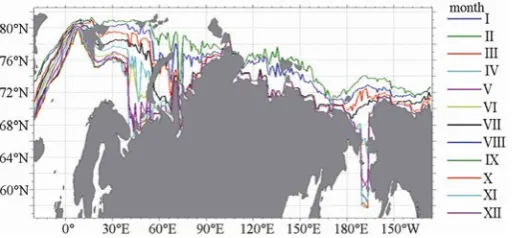
obtained monthly average climatic positions of sea ice edge from Greenland to North America along the coast of Eurasia (21 – 126° W counterclockwise) is illustrated by colored lines in Fig. 1. It is evident that edge position depends not only on the season but also on the region of the ocean. The most significant ice edge latitudinal displacements in the intra-annual cycle are observed westward of Novaya Zemlya (20 – 55° E) and in the Bering Strait area. These areas are located in the zones which border on the open ocean (the Atlantic and the Pacific). In the area of ~42° E the edge may be displaced northwards up to 82° N. It should be pointed out that the edge displacements so far to the North were previously observed in the history of the Arctic Region. In particular, similar significant displacement to the North in August was mentioned in [6].
Fig. 1. Monthly average climatic positions of the sea ice edge
Correlation between ice edge position and Arctic Oscillation and North
Atlantic Oscillation atmospheric circulation indices. To assess a correlation
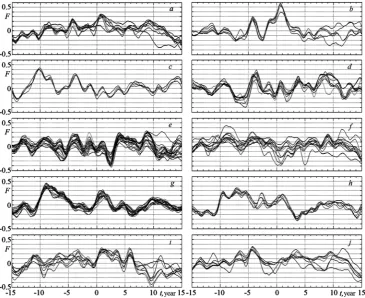
Fig. 2. The ensemble of cross-correlation functions which links latitudinal ice edge with the Arctic Oscillation index
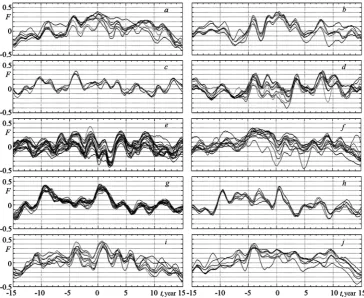
The analysis of these curves reveals the fact that at the Laptev Sea Northern part (Fig. 2, a) ice edge response to the AO index variation appears in about a year with 0.35 correlation coefficient. The edge responses to NAO variation in a quasi-synchronous way with 0.4 coefficient (Fig. 3, a).
In the East Siberian Sea the edge position response to AO index appears with 0.59 coefficient in 8 months (Fig. 2, b); the coefficient correlation of edge position and NAO index does not exceed 0.4 (Fig. 3, b). The reaction of events with the maximum coefficient value is quasi-synchronous at that.
In the Chukchi Sea – the Bering Strait area quasi-synchronous coordination of ice edge dynamics and AO (Fig. 2, c) is recorded only at –0.21 coefficient level, and coordination with 4 years shift emerges with 0.3 coefficient. The edge response to NAO (Fig. 3, c) with 0.4 coefficient emerges at the same time shift.
Fig. 3. The ensemble of cross-correlation functions which links latitudinal ice edge displacement with North Atlantic Oscillation index
For the Beaufort Sea the behavior of cross-correlation functions which link the edge displacement and variation of AO and NAO indices is qualitatively similar (Fig. 2, e and 3, e). In both cases ice edge response emerges with about 2.5 years delay. Correlation coefficient is negative and it does not exceed 0.41 in modulus.
The graphs of cross-correlation functions have qualitatively similar structure for most longitudes in the Davis Strait. The maximum value of ice edge position cross-correlation coefficient in modulus with AO index (Fig. 2, f), which is reached at half-year and 5 year shift, is equal to 0.39. Cross-correlation coefficient with NAO is equal to –0.4 at a zero shift and to –0.45 at the edge position response in 5 years (Fig. 3, f).
In 12° W – 2° E area, cross-correlation function distributions linking the edge position with AO (Fig. 2, g) and NAO (Fig. 3, g) have the minimum differences for all the longitudes in comparison with distributions in other areas of the Arctic. The edge response to AO index variation is recorded with 0.31 coefficient at about one year shift and edge position response to NAO emerges in 6 months with 0.42 coefficient.
eastern part of the sea (Fig. 2, i; 3, i) edge response to AO and NAO emerges in a year with 0.31 and 0.45 correlation coefficients, respectively.
Cross-correlative functions for 79 – 87° E area of the Kara Sea reveal that the edge displacement changes outpace the variation of AO and NAO indices for about 4 years. Cross-correlation coefficients are equal to 0.35 for AO (Fig. 2, g) and 0.4 for NAO (Fig. 3, g) at that.
Correlation of ice edge position and Gulf Stream index. Cross-correlative
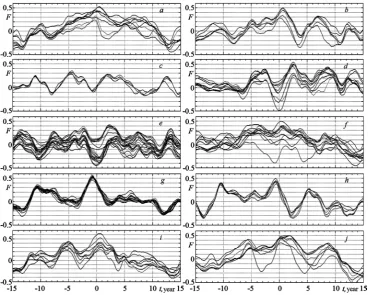
functions characterizing the relation between ice edge latitudinal displacement for each longitude along its perimeter and GSNW index are depicted in Fig. 4. The analysis of the mentioned graph behavior indicates that in the Laptev Sea western part (Fig. 4, a) within the range of considered longitudes edge position response occurs quasi-synchronously or with a half-year shift. Correlation coefficient is in 0.2 – 0.51 range.
Fig. 4. Ensemble of cross-correlation functions linking the ice edge latitudinal displacement with Gulf Stream North Wall index
The ice edge responses to GSNW quasi-synchronously in the Chukchi Sea eastern part, the Beaufort Sea western part (Fig. 4, d) and in the Beaufort Sea (Fig. 4, e). Correlation coefficient varies within 0.1 … –0.5 range at that.
In the Davis Strait ice edge position will response to GSI variation in 6 months (Fig. 4, f) with up to 0.5 coefficient value.
In the Greenland and Norwegian Seas region (Fig. 4, g) as well as in the Barents Sea western part (Fig. 4, h), the edge displacement precedes the GSNW index variation. Time advance interval is about a year and correlation coefficient does not exceed 0.55. In the Barents Sea eastern part (Fig. 4, i) the edge responses to GSNW variation with 6 months delay and 0.61 correlation coefficient, which is the maximum one for the considered region.
In the Kara Sea eastern part (Fig. 4, j) ice edge response to GSNW variation is recorded at time shift from half-year to 2 years, correlation coefficient does not exceed 0.5.
Correlation of ice edge displacement with Wolf numbers of solar activity.
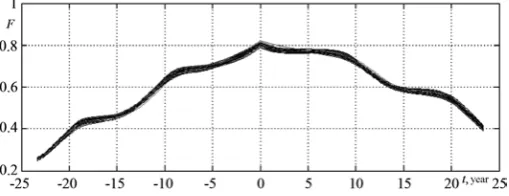
To assess sea ice edge displacement dynamics dependence on variation of Wolf numbers (which reflect the variation of sunspot numbers on the surface of the Sun) the analysis of cross-correlation functions characterizing the considered relationship was carried out. The functions were calculated by average monthly values of edge position latitude on each longitude, smoothed annual sliding average and by smoothed set of Wolf numbers. The ensemble of graphs of cross-correlation functions F(t) (where t is a time shift) characterizing the relation between the set of Wolf numbers and the set of values of edge displacement at a selected longitude is represented in Fig. 5. It can be seen that the behavior of F(t) functions on all the longitudes is almost similar both qualitatively and quantitatively.
Fig. 5. Ensemble of cross-correlation functions linking the ice edge latitudinal displacement and Wolf numbers
It should be pointed out that F(t) functions were obtained with regard to trend component in the initial data in the set of ice edge displacement and Wolf numbers. That has resulted in the high coefficient which was equal to 0.8. The oscillations with a period which is close to 11-year one (Schwabe Cycle), though with a small amplitude, are traced in all the graphs.
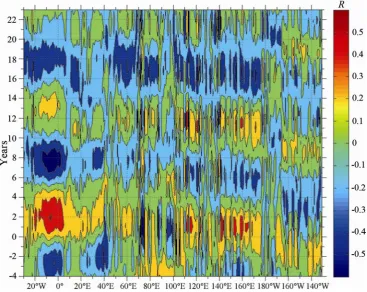
alternate with the period which is close to the one of Schwabe Cycle. The most significant correlation with correlation coefficient R ~0.6 (color scale) with two-year shift (in relation to Wolf numbers) occurs in the area between the Greenland Sea and the Norwegian Sea. Correlation coefficient for the Laptev Sea makes up 0.45 with ice edge response delay from 6 months to two years. In the East Siberian Sea region both quasi-synchronous relation and the one with up to two-year delay with 0.42 correlation coefficient are observed.
Fig. 6. Longitudinal distribution of cross-correlation functions linking latitudinal displacement of ice edge and Wolf numbers with no regard to trend component
Conclusions. On the basis of monthly average data on ice concentration from
1969 to 2012 a set of edge position latitude values for each longitude degree in the Arctic basin was formed. The analysis of intra-annual climate variability of ice edge regional distribution was carried out on its basis. The most significant ice edge latitudinal displacements in the intra-annual cycle were observed westward of Novaya Zemlya and in the Bering Strait area.
The investigation of cross-correlation functions linking the ice edge latitudinal displacement with Arctic Oscillation and North Atlantic Oscillation atmospheric circulation indices was carried out. The edge position response to the variation of Gulf Stream index and Wolf numbers of solar activity was also considered.
longitude sector, the response manifests itself quasi-synchronously or with a delay that makes up from 6 months to 5 years. At the same time, in the area situated between the Chukchi Sea eastern part and the Beaufort Sea western part the manifestation of edge displacements advances the response in Arctic Oscillation index variation for 3.5 years.
The ice edge latitudinal displacement response to Gulf Stream index variation manifests itself along its perimeter quasi-synchronously or with a delay from 6 months to 2 years. Exceptions are the Greenland Sea and the Norwegian Sea areas as well as the Barents Sea western part where ice edge displacements advance the Gulf Stream index variation. Time interval of the advance makes up about a year and correlation coefficient does not exceed 0.55. A direct correlation with correlation coefficient 0.8 occurs between the edge latitudinal displacement and variation of Wolf numbers. The oscillations of cross-correlation functions with a period which is close to 11-year one (Schwabe Cycle) are observed on each longitude at that. In the variations of cross-correlation functions from their average position solar activity variation is manifested in the edge position displacement with up to two-year delay.
The research was carried out within the framework of state order on the theme no. 0827-2015-0001 “Fundamental research of the processes in the ocean – atmosphere – lithosphere system determining spatiotemporal variability of the environment and climate of global and regional scales”.
REFERENCES
1. Khon, V.Ch., Mokhov, I.I., 2010, “Klimaticheskie izmeneniya v Arktike i vozmozhnye usloviya arkticheskoy morskoy navigatsii v XXI veke [Arctic climate changes and possible conditions of Arctic navigation in 21st century]”, Izv. RAN., Fizika atmosfery i okeana, vol. 46, no. 1, pp. 19-25 (in Russian).
2. Frolov, I.E., Gudkovich, Z.M. & Karklin, V.P. [et al.], 2007, “Klimaticheskie izmeneniya ledovyh usloviy v arkticheskih moryah Evraziyskogo shel'fa [Climate changes of ice conditions in the Arctic seas of the Eurasian shelf]”, Problemy Arktiki i Antarktiki, no. 75, pp. 149-160 (in Russian).
3. Alekseev, G.V., Radionov, V.F. & Aleksandrov, E.I. [et al.], 2015, “Izmenenie klimata Arktiki pri global'nom poteplenii [Arctic climate change under global warming]”, Problemy Arktiki i Antarktiki, no. 1 (103), pp. 32-41 (in Russian).
4. http://badc.nerc.ac.ukldata/hadisst. 5. http://nomad1.ncep.noaa.gov.