A b s t r a c t. The large number of intersecting surfaces in a volume divides the latter into small sub-volumes. Each of the sub-volumes is outlined or nearly outlined by parts of the intersecting surfaces. A number of simple geometrical conditions to be imposed on the intersecting surfaces determine a certain size distribution of the outlined sub-volumes. The approach based on these prerequisites was previously successfully applied to the multiple cracking and fragmentation of rocks, naturally and by blasting, as well as to soil fragmentation by shrinkage cracks. In both cases the intersecting surfaces are cracks, and sub-volumes are rock or soil fragments. The first application of the approach to the pore structure of soils was related to modelling the clay matrix pores and their size distribution. In this case the plate-like clay particles play the part of the intersecting surfaces, and the pore volumes play the part of the sub-volumes. The approach leads to the scale-invariant fragment- and pore-size distributions and permits one to take into account the superposition of the intersecting surfaces of a different physical nature and scale, the connectedness and tortuosity of the intersecting surfaces, the shape characteristics of sub-volumes, and the swelling-shrinkage of a system of clay particles. In general, soils contain, besides clay matrix pores, such sub-volumes as silt-sand grains and different types of clay aggregates and pores. The boundaries of the silt-sand grains and aggregates, along with cracks and clay particles, play the part of the intersecting surfaces. The objective of this work is to generalize the approach to model the different size distributions in sand and aggregated soil (in the last case we only consider the interaggregate,iestructural porosity). This development follows a brief summary of the approach including its previous applications as well as a consideration of the differences between such inter-secting surfaces as cracks, plate-like clay particles, boundaries of sand grains and aggregates. A comparison between the model predicted size distributions and relevant available data shows satisfactory agreement.
K e y w o r d s: surface- and volume-like objects, pores, grains, aggregates
INTRODUCTION
Soil structure plays a key part in modelling different properties of the soil including those which are mechanical, hydraulic, and shrink-swell. Quantitatively, the soil structure is characterized by size and shape distributions of different pore types, size and shape distributions of different solids forming the soil, as well as connectedness and tortuosity of pore walls and channels. Geometrically, soils consist of volume-like objects (V-objects – blocks, fragments, aggregates, silt and sand grains, and 3D pores) and surface-like objects (S-objects – boundaries of V-objects as well as cracks, slits and clay particles). In the following this aspect will be discussed in more detail.
There are a number of approaches to modelling pore-size distributions (as a part of functions describing soil structure). The statistical approach has been used to represent the distribution of the pore and aggregate sizes. For instance, Gardner (1956) and, more recently, Kosugi (1994, 1996) considered a lognormal distribution as a con-venient mathematical representation to be justified empirically. In the frame of this approach there are also other probability laws (Brutsaert, 1966; Rice, 1995). Arya and Paris (1981) constructed the pore size distribution based on already known grain size distribution. The approach inclu-des a number of assumptions relative to pore characteristics such as the length of a pore and pore opening. Rieu and Sposito (1991a, b) proposed a fractal model of soil porosity of aggregated soils including pores and aggregates of only one type. Nimmo (1997) introduced a division of pore space into ‘texture’ and ‘structure’ ranges. For testing the model predicted pore size distributions one usually uses data of the soil water retention curve (Perrieret al., 1996) or the data of
Intersecting-surfaces approach to soil structure
V.Y. Chertkov
Agricultural Engineering Division, Faculty of Civil and Environmental Engineering, Technion, Haifa 32000, Israel Received September 7, 2004; accepted November 3, 2004
© 2005 Institute of Agrophysics, Polish Academy of Sciences Corresponding author’s e-mail: [email protected]
w w
porosimetry (Newman and Thomasson, 1979; Fies and Bruand, 1990). Interpretation of such data includes an assumption about effectively cylindrical pores and their filling in up to a certain radius.
It is worth noting that the above approaches only deal with pore and aggregate size distributions,iethey come to a non-total set of expressions from the viewpoint of the quantitative aspect of soil structure eg pore shape distributions are not considered. This remark, the above mentioned understanding of soil structure, and analysis of indicated approaches enable one to formulate the following conditions, the observance of which is desirable at the derivation and validation of expressions quantitatively describing the soil structure.
1. S- and V-objects as a basis. It is preferable to construct different size distributions of a soil structure based on physical considerations, but not simply as convenient empirically justified mathematical representations. Below we refer to such a distribution as the physical one. One of the major (and obvious) physical factors which should be taken into account is the co-existence in a soil of the networks of S-objects and corresponding systems of V-objects (of different scale and nature).
2.V-objects of a different type on equal rights. Pore size distributions should be constructed not based on already known grain (or aggregate) size distribution but jointly with the latter. That is, a model should describe the size distributions of V-objects of different types on equal rights and for the type number equal to or more than two,egsand grains, clay aggregates, and pores.
3.The modes of V-objects of a given type. V-objects of a given type,egpores, can include a number of modes with different maximum dimensions. One can consider the ‘texture’ and ‘structure’ ranges of a pore space (Nimmo, 1997) as a particular case of such modes
4. Distribution validation of solids is simultaneously that of corresponding pores. For validation of a model predicted pore size distribution along with water retention and porosimetry data one can use the validation of the corresponding model predicted aggregate and grain size distributions based on the data of the distributions. Such validation is also direct because theoretically these distributions are obtained jointly (see condition 2).
In light of these conditions one can assume that the geometrical aspect of a soil structure connected with S- and V-objects (see above) should play a key part. An approach for modelling different fragment and pore size distributions in soils and rocks was initially applied to cracks and clay particles as S-objects and to blocks and clay matrix pores as V-objects (Chertkov, 1986; 1991; 1995; 2000; 2003; Chertkov and Ravina, 1998; 1999). For the reader’s convenience, a brief summary of the intersecting-surfaces approach (ISA) is given below (based on indicated works). The gist of the approach is as follows. The large number of
intersecting surfaces (S-objects) in a volume divides the latter into small sub-volumes (V-objects). Every one of the sub-volumes is outlined or nearly outlined by parts of the intersecting surfaces. A certain size distribution of the outlined V-objects originates from a number of simple geometrical conditions imposed on the S-objects.
The objective of this work is to generalize the intersecting-surfaces approach and, using the generalized ISA, to model the different size distributions in a sand and aggregated soil. The generalization should account for the simultaneous presence in a soil volume of a number of types of S- and V-objects and a number of modes of S- and V-objects of a similar type. Except for this novelty, the applications of the generalized ISA for sand and aggregated soil are new since they are based on considering the S-objects of another nature than cracks and clay particles (see ‘Peculiarities of different S- and V-objects in soils’). Note that the aggregated soil is considered here at a given water content,ieshrinkage-swelling is beyond the scope of this work.
The development of the applications for a sand and aggregated soil follows a summary of major concepts and relations of ISA as well as brief consideration of differences between such S-objects as cracks, plate-like clay particles, boundaries of sand grains and aggregates. This consideration aims to preliminarily show the place of ISA applications to be developed in this work relative to existing ISA applications. After the development of the new applications, the model predicted size distributions of pores, sand grains, and aggregates are compared to relevant available data.
MAJOR CONCEPTS AND RELATIONS OF ISA (Brief summary from Chertkov (1986, 1991, 1995, 2000, 2003),
Chertkov and Ravina (1998, 1999)) The concept of S- and V-objects
To define the three sizes of a V-object we consider the two sizes of its largest face and the size normal to the latter, and we designate them in order of decreasing values as x³y³z. By definition the size distribution of V-objects is the distribution with respect to their maximum size,x.
The condition of V-object formation at S-object connection: at least part of the S-objects outline V-objects totally or nearly totally. The V-objects have sizes in a range, 0<x£xm and constitute a volume fraction fm£1 of the soil (rock) volume.
The size distribution of V-objects
If the S-objects fulfill the above geometrical conditions, the physical size distribution of V-objects (see Introduction, condition 1) is assumed to originate from the division of a volume by a large number of intersecting S-objects. Then, the size distribution of V-objects, F x x( / m) (a volume fraction of V-objects of size <xof their total volume) is given
as:
F x x( / m)= f x x( / m) / fm, 0< £x xm (1)
f x x( / m)= -1 exp (-I x x( / m)), 0< £x xm (2)
I x x( / m)=Cln (K*+1 4) ( x x/ m) exp (4 -4x x/ m), (3)
xm=4 ,d (4)
and
fmº f( )1@ -1 exp (-8 4. C) (5)
(the coefficient 8.4 originates from Eqs (2) and (3) atx=xm andK*=5).I x x( / m) is the average S-object number ofx size in ~x3 volume, f x x( / m) is the volume fraction of V-objects of size <xof the soil (rock) volume, and fmis the volume fraction of V-objects of the soil (rock) volume. If C=1, the entire soil (rock) volume is divided by S-objects into V-objects (the case offm= 1). If C<1, the soil volume is not completely divided by S-objects (fm<1). There are also similar expressions for the 2D case.
The maximum size of V-objects,xmand connectedness, Cof S-objects,egof a crack network, are two independent parameters of the distribution. These parameters can depend on variables specific for a particular system of S-objects and on spatial coordinates.
The features of the intersecting-surfaces approach
The characteristic dimension xmsimultaneously plays the part of the scaling factor as the denominator of thex x/ m ratio (Eqs (1)-(3)). That is, for different scales the form of the distribution (Eqs (1)-(5)) does not change. In this meaning the distribution is scale-invariant.
Connected S-objects outline V-objects. Hence, the F
function and the shape of V-objects being known, one can
estimate the specific surface area, L3, of connected
S-objects (per unit volume of the soil). The specific length,
L2, of connected traces of the S-objects at a cross-section can
be similarly estimated for the 2D case.
3Dtortuosity,T3of intersecting (or connected) S-objects along a given direction is defined as a ratio:
T3=L3/L2. (6)
The tortuosity is expressed in terms of the f x x( / m)function and its 2D version. For the total S-object system (when x=xm) the connectedness and tortuosity of the system are interconnected.
In connection with the soil heterogeneity and variability of a different type,xmandCparameters become functions of spatial coordinates and time (locality).
The approach enables one to consider an actual soil as asuperpositionof S-objects of a different physical nature, egclay particles, and cracks, and a different scale,egcracks of essentially different sizes.
The probabilityP x y z( , , )d d d that a V-object willx y z have three sizes in intervalsd d dx y z, , ,eventually flows out of the same regularity ( ( /f x xm)):
P x y z f
f x x
x f x x
f y x
m
m
m
m
( , , ) ( / )
( / )
( / )
= 1 d 1
d
d dy
1 f y x
f z x
m
m
( / )
( / )
. d
dz (7)
In the simplest case the restrictions imposed on the three sizes of a V-object have the form:
z£ £ £y x xm. (8)
The P function being known, one can estimate any
shape characteristicof V-objects.
Thus, the approach leads to the scale-invariant fragment and pore size distributions and permits one to take into account the superposition of the S-objects of different physical nature and scale, the connectedness and tortuosity of the S-objects, the shape characteristics of V-objects, and the swelling-shrinkage of a system of clay particles.
Additional remarks
Part of the actual S-objects (cracks, slits, and clay particles) has small, but finite (non-zero) thickness (or aperture) and volume. Corresponding modifications can be introduced to the dimension distribution of V-objects given by Eqs (1)-(5) if the small thickness (aperture) is found by an independent way.
Existing applications
The intersecting-surfaces approach (ISA) based on these general geometrical prerequisites was applied to
multiple cracking and fragmentation of rocks (Chertkov, 1986, 1991), as well as to soil fragmentation by shrinkage cracks (Chertkov, 1995; Chertkov and Ravina, 1998). In both cases the intersecting surfaces (S-objects) are cracks, and V-objects are rock or soil fragments. As an example, let us consider the soil fragmentation by shrinkage cracks. The data relate to clod size distribution in artificially dried thin soil samples of Italian Fluvisol clay soil (Fig. 1b) from Guidi
et al. (1978). The soil samples were formed by stacking aggregates of the 1-2 mm fraction of the original soil. The
method of clod size distribution measurement (Guidiet al., 1978) was based on electro-optical determinations. The
experimental data (histogram inFig. 2) are shown together
with the theoretical size distribution (solid curve in Fig. 2)
corresponding to connectednessC=1 and the mean clod size
d=6.62 mm (Eqs (1)-(5)). Agreement between the
theore-tical curve and the data is quite satisfactory.
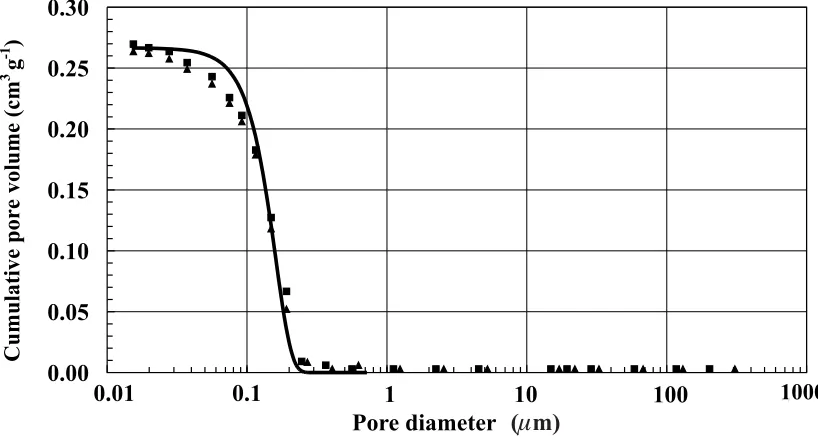
The first application of the approach to soil structure related to modelling the clay matrix pores and their size distribution (Chertkov, 2000; 2003). In this case plate-like clay particles play the part of the intersecting surfaces (S-objects), and the pore volumes play the part of V-objects. The data relate to the pore size distribution (squares and
triangles inFig. 3) in Macon kaolinite, Georgia (Diamond,
0 5 10 15 20 25
0 2 4 6 8 10 12 14 16
Mean width of clods (mm)
P
er
ce
n
to
ft
h
e
to
ta
la
re
a
o
fc
lo
d
s
Fig. 2.Histogram of area distribution of 2D clods in the Fluvisol samples (Guidiet al., 1978) and theoretical solid curve (Chertkov, 1995).
0.00
0.05
0.10
0.15
0.20
0.25
0.30
Cumulative
por
e
volume
0.01
0.1
1
10
100
1000
Pore diameter
1000
Cumulative
pore
volume
(cm
3
g
-1)
1970). Pore size distribution (after oven drying) was studied by the mercury intrusion method. Model predicted distribution (solid curve in Fig. 3) corresponding to the
connectedness of clay particles, C=1 and the maximum
diameter of pore tubes, ~0.72mm (Eqs (1)-(5)) was found by
the least-square criterion. Agreement between the data and model is also satisfactory.
PECULIARITIES OF DIFFERENT S- AND V-OBJECTS IN SOILS
The above existing applications relate to systems of S-objects of two types: cracks (of different origins) in soil (rock) and clay particles. In general, soils, besides fragments outlined by cracks and clay matrix pores outlined by plate-like clay particles, contain such V-objects as silt-sand grains, clay aggregates, and pores of different types. The boundaries of the silt-sand grains, aggregates, and pores of different types along with cracks and clay particles, play the part of S-objects. Different S-objects (and corresponding V-objects) in soils have a number of peculiarities that are important from the viewpoint of ISA applications.
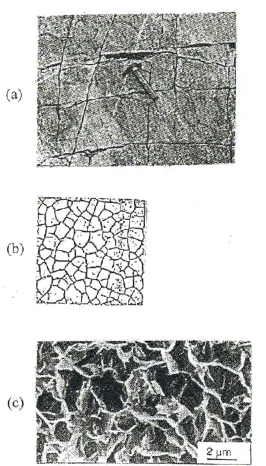
1. Cracks, unlike other S-objects, can appear and enlarge. Other S-objects exist retaining their size. Accor-dingly, soil (rock) fragments can divide into smaller frag-ments (see Fig. 1a and b). (Size changes by swelling-shrinkage are not considered here).
2. Cracks and clay particles, unlike other S-objects, outline V-objects of a single type. Cracks outline soil (rock) fragments (Fig. 1a and b). Clay particles outline clay matrix pores (Fig. 1c). In other words, every crack (clay particle) is between two fragments (clay matrix pores). For this reason, soil (rock) fragments and clay matrix pores (unlike other V-objects) can form the total V-object system,iefragments can occupy the total fragmented volume, and clay matrix pores can occupy the total clay matrix volume (see section ‘Additional remarks’ for a reservation about the non-zero thickness of clay particles).
3. Boundaries of soil aggregates outline two types of V-objects: aggregates and interaggregate (or structural) pores. The total system of the V-objects (the total volume) includes both aggregates and structural pores (unlike the case of soil fragments and clay matrix pores). Boundaries of structural pores separate the pores of aggregates. The surface area of the boundaries of structural pores is always a part of the surface area of aggregate boundaries. Therefore, the formal transition in the model to the limitP®0, where:P is structural porosity is possible unlike to the limitP®1.
4. Boundaries of sand grains also outline two types of V-objects: sand grains and pores of a sand skeleton. All that was said in point 3 about the soil aggregate system is the same for the sand grain system after changing “aggregates” by ‘sand grains’ and ‘structural pores’ by ‘pores of sand skeleton’.
5. From the viewpoint of texture, clay matrix and sand skeleton are different structures. However, unlike soils of more complex texture and structure, their pore systems are the simplest because they include only one type of pores, clay matrix pores and sand skeleton pores, respectively. This feature also relates to the aggregated soil that contains only structural pores (here aggregates are considered to be ‘structureless’, ie sand grains, clay particles and matric pores inside aggregates are ignored). The essential dif-ference from the ISA viewpoint between a clay matrix on the one hand and sand and aggregated soil on the other, is as follows. Solids of a clay matrix are plate-like clay particles, ie S-objects. Solids of sand and aggregated soil are sand grains and aggregates, respectively,ieV-objects.
THE ELEMENTARY SIZE DISTRIBUTION OF V-OBJECTS The V-object size distribution to be expressed by Eqs (1)-(3) and (5) can be written as:
F x x P P
P x x
m
I o x xm
m
( / , ) ( ) ,
( / )/ .
=1- -1 0< £
8 4
(9)
where:Io( )x is the function from Eq. (3) atC=1:
Io( )x =ln (K*+1 4) ( x) exp (4 -4x), ( *K =5)(10)
andPº fm is a volume fraction of V-objects.Pis coupled with connectednessCfrom Eq. (5):
Pº fm@ -1 exp (-8 4. C) . (11)
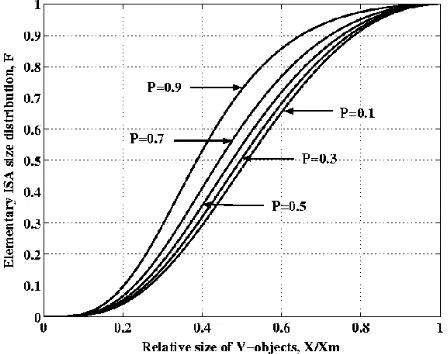
In the presentation of Eq. (9) the V-object size distribution is characterized by xm and P parameters instead ofxmandC. We will refer to the distribution of Eq. (9) as an elementary ISA distribution of the V-objects of a given type. Figure 4 shows the numerical presentation of the elementary ISA distribution at differentPvalues.
It is worth reiterating (see Section: Additional remarks) that the elementary ISA distribution of V-objects,ieobjects that fulfill the abovementioned geometrical conditions, is a universal function of V-object size, x x/ m (Fig. 4). The view of the function (Eqs (9) and (10)) does not depend on V-object type,egsoil (rock) fragments or clay matrix pores (Fig. 1), and their methods of preparation. Materials and methods can only influence values of theP(orC) andxm parameters.
GENERALIZATION: THE CASE OF SEVERAL TYPES OF S-OBJECTS AND CORRESPONDING V-OBJECTS
matrix pores),iethe case is possible when the maximum volume fraction of the V-objects,Pmax=1. However, a soil can contain more than one type of S-objects (see ‘Peculiarities…’) and more than one type of V-objects (eg pores, sand grains, aggregates). In this case, the volume fraction of V-objects of every type (Pp– for pores;Ps– for sand grains;Pa– for aggregates) should be less than unity. Then, ISA model can be applied to volume parts that are only divided by S-objects of a given type and are only occupied by corresponding V-objects. As a result, we come to the same elementary ISA distribution (Eqs (9) and (10)) for every type of V-objects with replacements P®Pp, P®Ps,P®Pa, andxm ®xmp,xm®xms, andxm ®xma for pores, sand grains, and aggregates, respectively. With that the following obvious condition should be fulfilled:
Pp+ + =Ps Pa 1. (12)
GENERALIZATION: THE CASE OF SEVERAL MODES OF S-OBJECTS AND CORRESPONDING V-OBJECTS
OF A SIMILAR TYPE
Note that the elementary distribution (Eqs (9) and (10)) relates to a certain pair of xm and P values. However, V-objects of a given type (pores, or sand grains, or aggregates) can be a component mixture with several different pairs ofxm andPvalues. Such components of the mixture we will refer to as modes. The volume fraction of the modes in such a mixture meet the obvious condition of:
P Pi i
I
= å
=1
(13)
where:Iis the mode number of the V-objects of a given type; Piis the volume fraction of thei-th mode (of the total soil volume). In the case of poresPºPp,PiºPpi, andIºIp. In the case of sand grainsPºP Ps, iºPsi, andIºIs. In the case of aggregates PºPa,PiºPai andIºIa. The size distribution of the mixture of V-objects of a given type (pores, or sand grains, or aggregates) can be presented as the sum of I terms of corresponding elementary ISA distributions (Eqs (9) and (10)) multiplied by the weights
Pi Pi i
I /
= å
1 :
F x Pi I o x xmi P
i I
i i
I ( )= å[- -( ) ( / )/ . ] / å
= 1 1 =
8 4
1 1
, 0< £x xmI
(14)
(in the case of I=1 we return to Eq. (9)). We accept that 0<xm1<xm2< <... xmI. The i-th term of Eq. (14) (in square brackets) is equal toPi in the rangexmi£ £x xmI. If
theF(x) function gives a pore size distribution, Pi P i
I
= å =
1 ,
where Pis the total porosity (cf. Eq. (13)), and Pi is the volume fraction of pores of the i-th mode (of the soil volume). If the F(x) function gives the solids-size
distribution (sand grains or aggregates), Pi P i
I
=
å =
-1
1 ,
where: P again is the total porosity, andPi is a volume fraction of solids ofi-th mode (of the soil volume).
One should emphasize thatF(x) distribution (Eq. (14)), as the elementary ISA distribution (Eqs (9) and (10)), is a universal function of the ratios x x/ mi (i= 1,…,I) for V-objects meeting the geometrical conditions of ISA. Materials and methods can only influence values of thePi (i=1,…,I) andxm1,... ,xmI parameters.
DATA TO BE USED Materials and methods
There are many data on the size distributions of pores, sand grains, and aggregates. To illustrate and test the generalized ISA model as applied to pores, sand grains, and aggregates as V-objects, we considered three examples of available data sets relating to sand skeleton pores (Day and Luthin, 1956), sand grains (Mualem, 1976), and aggregates (Wittmuss and Mazurak, 1958). These data are presented as points in Figs 5-7.
The cumulative pore size distribution of Oso Flaco fine sand (the points in Fig. 5) was calculated (Brutsaert, 1966) based on the data for sand-water retention curve (Day and Luthin, 1956) (one of two methods, noted in the Introduction, for finding data on pore size distribution). Fig. 4.The numerical presentation of the elementary ISA
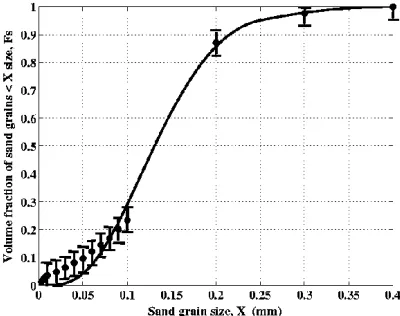
The cumulative sand size distribution from Mualem’s (1976) Fig. 2a (the points in Fig. 6) corresponds to the averaged data of silty fine sand obtained by sieving.
Finally, the cumulative aggregate size distribution (the points in Fig. 7) of Sharpsburg silty clay loam (a member of the Brunizem great soil group, from the Agronomy Farm, Lincoln, Nebraska) was determined by sieves, elutriation, sedimentation, and centrifugation (Wittmuss and Mazurak, 1958).
Data analysis
The objective of the data analysis is to show that the above indicated size distributions (the points in Fig.5-7) as functions of sizex, can be presented by theF(x) dependence that is characteristic for an ISA distribution (Eq. (14)) despite the differences in the V-object nature, scale, dynamic properties, and preparation methods.
In all three cases (sand skeleton pores, sand grains, and aggregates) we considered the simplest case of two modes, iewe approximated the experimental size distributions (10, 20, and 11 points in Figs 5-7, respectively) by the weighted mixtures of two modes. That is, F(x) from Eq. (14) transforms (atI=2 andxm1<xm2 ) to:
F x( )ºF x x( / m1, /x xm2,P P1, 2) 0< £x xm2. (15)
The model was checked by the least squares criterion providing the minimum of the sum of squares, S of the differences between calculated ( (F xk /xm1,xk /xm2,P P1, 2) and measured (Fk, see Figs 5-7) values of the size distribution across a range ofk=1, ...,Jvalues ofx(J=10, 20, and 11 in Figs 5-7, respectively):
[
]
S F xk xm xk xm P P Fk k
J
º å
-= ( / 1, / 2, 1, 2)
2
1
. (16)
Analysis of the experimental size distributions (both of pores and solids) using the presentation of Eq. (14) atI=2 permits one to estimateP1andP2 (and the total porosity Fig. 5.Data (10 points) of the pore-size distribution of Oso Flaco
fine sand from Day and Luthin (1956) (quoted by Brutsaert (1966)) and the fitted distribution curve (solid line) for two elementary pore modes (Eq. (14) atI=2):xm1=0.084 mm,P1=0.375 andxm2=0.105
mm, P2=0.03 (at actual porosity valueP=P1+P2=0.405 from Day and Luthin (1956)). Goodness of fit isr2=0.96. Estimated standard deviation ofFp(vertical bars) iss=0.08.
Fig. 6.Data (20 points) of the silty fine sand-size distribution from Mualem’s (1976) Fig. 2a and the fitted distribution curve (solid line) for two elementary sand grain modes (Eq. (14) at I=2): xm1=0.25 mm,P1=0.37 andxm2=0.4 mm,P2=0.07 (at actualxm2=0.4
mm). Predicted sand porosity isP=1-P1-P2=0.56. Goodness of fit isr2=0.99. Estimated standard deviation ofFS (vertical bars) is
s=0.04.
Fig. 7. Data (11 points) of the aggregate-size distribution of Sharpsburg silty clay loam from Wittmuss and Mazurak (1958) (quoted by Rieu and Sposito (1991b)) and the fitted distribution curve (solid line) for two elementary aggregate modes (Eq. (14) at I=2):xm1=1 mm, P1=0.28 and xm2=9.25 mm, P2=0.2 (at actual xm2=9.25). Predicted interaggregate porosity isP=1-P1-P2=0.52.
Goodness of fit isr2=0.99. Estimated standard deviation ofF
a
P= +P1 P2orP= - -1 P1 P2) as well asxm1andxm2. IfP and/orxm2 are known in advance (the usual situation), this simplifies the analysis, especially in the cases ofI=1 orI=2. If the standard deviations,sk for a number ofFkvalues are similar and may be considered as a constant,sthe method of the least squares allows one to obtain an independent estimate ofs(Hamilton, 1964) (in addition to the estimates ofxm1,xm2,P1, andP2) as:
s @(Smin / (J-3))1 2/ (17)
where Smin is the minimum of S as a function of three independent parameters ofxm1,xm2,P1, andP2.
RESULTS AND DISCUSSION
Figures 5-7 show fitted size distributions and estimated
svalues (vertical bars). Found values ofxm1,xm2,P1,P2 andPas well as goodness of fit,r2are also indicated in the captions of Figs 5-7. All three examples presented in Figs 5-7 are characterized by high r2 values. For all three examples, the maximum discrepancies between the experimental points and fitted curve are within the limits of a little more than one standard deviation (s). These results demonstrate the good agreement between the generalized ISA model and available data despite the differences in the V-object nature (sand pores, sand grains, and aggregates), scale (hundredths of mm in Fig. 5; tenths of mm in Fig. 6; and millimeters in Fig. 7), dynamic properties, and preparation methods.
It is worth emphasizing that the elementary ISA distribution (Eqs (9) and (10)), as well as the generalized distribution (Eq. (14)), is not an empirical one like lognormal or similar distributions. The ISA distributions flow out of the statistics of intersecting surfaces (see Brief summary of ISA). For simplicity we used fitting parameters in the above testing (with the xm1,xm2,P1, and P2 parameters). In general, however,Pandxmparameters (Eqs (9) and (10)), and in the generalized case P1, ...,PI and xm1,xmIparameters (Eq. (14)), have a clear physical meaning and can be measured independently of the data on size distribution (unlike parameters of lognormal and similar empirical distributions). Independent measurement of the P1, ..., PI and xm1,xmIparameters (unlike fitted parameters of empirical distributions) enables one to estimate the size distribution for these parameter values without expensive testing.
According to the ISA approach (see Brief summary), the presentation of Eq. (14) is an analytical basis for the quantitative description of the shape distribution of pores or solids (Eqs (7) and (8)) and the tortuosity of pore channels as a function ofP1, ...,PIandxm1,xmI (Eq. (6)). In turn, (pore) size distribution (Eq. (14)), (pore) shape distribution, and tortuosity are necessary for physically based modelling of
the soil water retention curve and hydraulic conductivity function (as an example of such development as applied to the water retention of a clay matrix see (Chertkov, 2004)).
CONCLUSIONS
1. An available approach, connecting the networks of such surface-like objects (S-objects) as cracks and clay particles in soils to the size distribution of corresponding volume-like objects (V-objects) such as blocks and clay matrix pores (the intersecting surfaces approach - ISA), is generalized to the case of different pores, sand grains, and aggregates as V-objects and their boundaries (along with cracks and clay particles) as S-objects. The generalization is based on accounting for the simultaneous presence in a volu-me of a number of types of S- and V-objects and a number of modes of S- and V-objects of a similar type.
2. For model illustrating and testing we used three examples of available data on the size distributions of sand skeleton pores, sand grains, and aggregates. The model was checked by the least squares fitting of the theoretical distribution curve to the experimental data (in general, the distribution parameters can be found independently). Comparison between the model and available data (based on high values of the goodness of fit and small values of the standard deviations) speaks in favour of the generalized approach.
3. According to the intersecting surfaces approach, the size distributions obtained permit one to construct the shape distributions of pores, sand grains, and aggregates, and calculate the tortuosity of pore channels. All these functions (the size and shape distributions, and tortuosity) are necessary for physically based modelling of soil hydraulic properties.
REFERENCES
Arya L.M. and Paris J.F., 1981.A physicoempirical model to predict the soil moisture characteristic from particle size distribution and bulk density data. Soil Sci. Soc. Am. J., 45, 1023-1030.
Brutsaert W., 1966.Probability laws for pore-size distributions. Soil Sci., 101(2), 85-92.
Chertkov V.Y., 1986.Chip development during multiple crack formation in a brittle rock. Soviet Mining Sci., 21, 489-495. Chertkov V.Y., 1991.Characteristics of the shape of blasted rock
fragments. Soviet Mining Sci., 27(6), 528-532.
Chertkov V.Y., 1995.Mathematical simulation of soil cloddiness. Int. Agrophysics, 9, 197-200.
Chertkov V.Y., 2000.Modeling the pore structure and shrinkage curve of soil clay matrix. Geoderma, 95, 215-246. Chertkov V.Y., 2003.Modelling the shrinkage curve of soil clay
pastes. Geoderma, 112, 71-95.
Chertkov V.Y. and Ravina I., 1998.Modeling the crack network of swelling clay soils. Soil Sci. Soc. Am. J., 62(5), 1162-1171. Chertkov V.Y. and Ravina I., 1999.Tortuosity of crack networks in swelling clay soils. Soil Sci. Soc. Am. J., 63, 1523-1530. Day P.R. and Luthin J.N., 1956.A numerical solution of the
differential equation of flow for a vertical drainage problem. Soil Sci. Soc. Am. Proc., 20, 443-447.
Diamond S., 1970.Pore size distributions in clays. Clays and Clay Minerals, 18, 7-23.
Fies J.C. and Bruand A., 1990.Textural porosity analysis of a sil-ty clay soil using pore volume balance estimation, mercury porosimetry and quantified backscattered electron scanning image (BESI). Geoderma, 47, 209-219.
Gardner W.R., 1956. Representation of soil aggregate-size distribution by a logarithmic-normal distribution. Soil Sci. Soc. Am. Proc., 20, 151-153.
Guidi G., Pagliai M., and Petruzzelli G., 1978.Quantitative size evaluation of cracks and clods in artificially dried soil samples. Geoderma, 19, 105-113.
Hamilton W.C., 1964. Statistics in Physical Science. Ronald Press, New York.
Hudson J.A. and Priest S.D., 1979.Discontinuities and rock mass geometry. Int. J. Rock Mechanics, Mining Science and Geomechanical Abstracts, 16, 339-362.
Kosugi K., 1994.Three parameter lognormal distribution model for soil water retention. Water Resour. Res., 30(4), 891-901. Kosugi K., 1996.Lognormal distribution model for unsaturated
soil hydraulic properties. Water Resour. Res., 32(9), 2697-2703.
Mualem Y., 1976.A catalogue of the hydraulic properties of unsaturated soils. Research Project No. 442, Technion, Israel Institute of Technology, Haifa, Israel.
Newman A.C.D. and Thomasson A.J., 1979.Rothamsted studies of soil structure. III. Pore size distributions and shrinkage processes. J. Soil Sci., 30, 415-439.
Nimmo J.R., 1997.Modeling structural influences on soil water retention. Soil Sci. Soc. Am. J., 61, 712-719.
Perrier E., Rieu M., Sposito G., and de Marsily G., 1996. Models of the water retention curve for soils with a fractal pore size distribution. Water Resour. Res., 32(10), 3025-3031. Rice J.A., 1995.Mathematical Statistics and Data Analysis. 2nd
edition. Duxbury, Boston, Massachusetts.
Rieu M. and Sposito G., 1991a. Fractal fragmentation, soil porosity, and soil water properties. I. Theory. Soil Sci. Soc. Am. J., 55(5), 1231-1238.
Rieu M. and Sposito G., 1991b. Fractal fragmentation, soil porosity, and soil water properties. II. Applications. Soil Sci. Soc. Am. J., 55(5), 1239-1248.
Scott G.J.T., Webster R., and Nortcliff S., 1986.An analysis of crack pattern in clay soil: its density and orientation. J. Soil Sci., 37, 653-668.
Verhoogen J., Turner F.J., Weiss L.E., Wahrhaftig C., and Fyfe W.S. 1970. The Earth, an Introduction to Physical Geology. Holt, Rinehart and Winston, New York.
Wilding L.P. and Tessier D., 1988. Genesis of Vertisols: shrink-swell phenomena. In: Vertisols: Their Distribution, Properties, Classification and Management (Eds Wilding, L.P., Puentes, R.), 55-81. Technical monograph No.18. Soil Management Support Services. College Station, Texas 77843. Texas A&M University Printing Center.
Wittmuss H.D. and Mazurak A.P., 1958.Physical and chemical properties of soil aggregates in a Brunizem soil. Soil Sci. Soc. Am. Proc., 22, 1-5.