BIABAN
BIABAN (Desert Journal) Online at http://jbiaban.ut.ac.ir
BIABAN 12 (2007) 7-15
An estimation of the temperature of Lut desert using
MODIS sensor data
G. Azizi
a*, S.K. Alavi Panah
a, N. Goodarzi
b, M. Kazemi
ba
Associate professor, Dept.of Physical Geography, Faculty of Geography, University of Tehran, Iran b
M.S.in Physical Geograph, Faculty of Geography, University of Tehran, Iran
Received 16 October 2005; received in revised form 5 May 2007; accepted 17 June 2007
Abstract
Temperature is considered as the basic element of climate and also the environmental limiting factor in Lut Desert. In this research, in order to identify the temperature of Lut Desert located in east of central Iran, using remote sensing data, six series of MODIS sensor images related to June 24th & December 23rd 2002, and also January 22nd, March 22nd, June 22nd & September 24th 2003 were employed. The temperature rates have been estimated by using band numbers 31 and 32 with locative separation power of 1000 meters and considering the Sebal algorithm. According to the results of temperature evaluation, the mean for land surface temperature in Lut Desert within the mentioned images at 6 o clock Grinwich mean time have been; 49.6, 18.2, 22.0, 36.4,55.7 and 54.2 C, respectively. Setting relation between calculated surface temperatures and recorded temperatures by meteorology stations indicated a meaningful correlation at 0.001 level. The rate of calculated determinant coefficients has been ranging from 0.91 to 0.72 per hour. Hence, the linier algorithms within surface soil temperatures of the six studied images and the recorded temperatures through meteorology stations were determined. According to these algorithms, the highest calculated air temperature in the area with respect to images was 49.7 C (at 12:00) in June 22nd 2003 and the lowest 11.5 C (at 03:00) Jan 22nd 2003. The results of this survey indicate that using MODIS sensor images seems to be suitable for estimating the Lut Desert temperature as well as temperature in other similar areas.
Keywords: Lut Desert; MODIS Sensors; Sebal Algorithm; Surface soil temperature
1. Introduction*
Lut pit in south-east of Iran, is one of the vastest, lowest lying, hottest, and driest pits in Iran plateau (Kardavani, P. 1972). According to Agricultural Jehad Economic Organization's division of the country into whole zones, Lut
Desert Locates between 23 56 32.33 -
34 07 13.97 N and 55 17 41.86 -
61 11 03.83 E. The whole area of Lut Desert is
197347 km2 which covers about 12% of Iran's
whole area. Lut Desert extends to parts of some four provinces of: Southern Khorasan, Yazd, Kerman, Sistan & Ballochestan. Based on
*
Corresponding author. Tel.: +98 21 61112938, 09123841192
E-mail address: [email protected]
G. Azizi et al. / BIABAN 12 (2007) 7-15
8
studying suitable climatic conditions for the regions residents, tourism, better and more efficient control of water resources, applying cumulative architectural principals for suitable residence as well as determining the agricultural products compatible with the climate in this region. Regarding the limitation in the number of meteorological stations, along with the high costs of collecting terrestrial information through point gathering method in the area, employing thermal bands of satellite images is a suitable and low-cost measure to collect temperature information from almost all zone surfaces.
So far, few surveys using the remote sensing technique, have been done through which, the temperature of land surface has been estimated. The researches made by J.E. Nickol (1998), Fered Prata (2000), Kim Morris et al, (2004), general statictics and agriculture organization (1996), Akbari (2000), Sabz Abadi (2006), Tavakkoli Saboor (2001), Alavi Panah et al (2002), Moofati (2003) and Seradjian (2004) can be referred to as some examples. But a research which seems to have a close relation to the subject matter of this study was done by Tawn Kumar Sen (2004) under the title of: Identifying rain water source using some satellite sensors and technique of Geographic
Information system in which land surface
temperature has been measured by using MODIS sensor images.
2. Materials and Methods
MODIS sensors images of TERRA s satellite with BIL format were used for estimating Lut Desert temperature. The reason for selection of this sensor was its high band penetration, having got six thermal band limitations, day to day images, include several locative powers, and suitability of pixel dimentions. Six path images of recorded information were employed here by MODIS sensor. In line with the research subject, the images were such tried as to select the first days in each season. Therefore, 28
MODIS sensor bands were used in June 24 (7:11), December 23 (6:35) 2002 as well as in January 22 (6:45), March 22 (6:27), June 22 (6:50), and September 24 (7:02) 2003. In addition to the above-mentioned images, topography maps of scale 1:250000 and entirely covered soil maps of scale 1:1000000 were employed. The technique of creating color images was chosen to recognize the cloudy spots and the surface soil material of Lut Desert. In order to determine the representative algorithm, the manner of relating surface data, attained from sensor with hourly recorded air temperatures at six meteorological stations (for calculating area air temperature from the recorded information at the meteorological stations) of Birjand synoptic, Khoor-e-Birjand, Tabas, Robat-Posht Badam, Shahdad, and Bam during the study days were used. All the research processes were performed in ILwis 3.2, Arcview 3.2, R2v, and Spss soft wars.
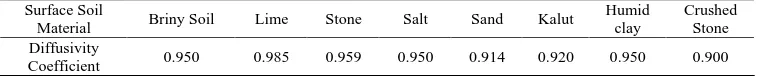
For a preparation of the primary information, from available received images (through use of 26 land control points and under geometric correction), the limit of Lut Desert was distinguished. It should be noted that the atmospheric corrective operations were not preformed on the images. For a determination of the radiance power and estimating the region surface temperature (by using the images obtained from bands combination), entire soil covering map (scale 1:1000000), the area topography map (scale 1:250000), the entirely covering geomorphology map (scale 1:250000) as well as results of available reports and researches were digitalized. So, a cover of the region dominative surface soil, classified within eight classes, along with radiance power related to each class were also extracted with respect to the type of the region soil and available resources. It should be mentioned that different radiance powers of wet soil was taken in to view for the salty and desert plots of the region. The rates of radiance power related to each temperature class have been presented in table (1).
Table 1. The rates of radiance power in different surface soils in Lut Desert (Alavipanah 1382) Surface Soil
Material Briny Soil Lime Stone Salt Sand Kalut
Humid clay
Crushed Stone Diffusivity
Coefficient 0.950 0.985 0.959 0.950 0.914 0.920 0.950 0.900
To identify the cloudy spots over heading the area and their masks, benefit was made a combination of different bands at several stays. In this article, energy balance algorithm for land surface (Sebal) was used for determining land surface temperature. Sebal algorithm is a
multi-stage surface energy algorithm, based on
physical relations which uses surface
G. Azizi et al. / BIABAN 12 (2007) 7-15 9
items change the reflective and dispatched energies, measured by satellite, to the surface energy balance and earth s humidity indexes. Presently, this model has been accepted by the UN and is being employed in different parts of the world (Bastiaanssea et al, 1988). According to this, an estimation of the air temperature is performed within two stages:
A) calculating the surfsce soil temprature: In this stage, firstly spectrum radiance for bands 31
and 32 that cover the spectrum limit from 10.78 to 12.27, was calculated by using the following relation: (Xi-Hangjie 2003)
L =Scale-Radiance(SI-Offset-Radiance) (1) Where:
SI: stands for bright degrees of image pixels
Scale-Radiance and Offset-Radiance: are
constant coefficients for bands 31 and 32, respectively. The rates of these coefficients
(W/M2/Mm/st) are indicated in table (2).
Table 2. Coefficient Rates of Offset-scale, Radiance-scale in bands 31 and 32 on MODIS sensor Radiance_Scale Offset _Scale
Band Number 31 0.00084002 1577.339722
Band Number 32 0.0007297 1658.221191
Then, Brightness temprature is calculated by using the reversed Planck relation (relation (2)) (Vidar, 1989): 1 1 2 C K Ln K
D (2)
Where:
D: the Brightness temperature of each band
C: Planck s constant. K1 and K2 are constant
coefficients for the studying bands. With regard to the fact that atmospheric temperature is less than that of the earth surface, the atmosphere absorbs it leading to a lower temperature sensed by the sensor.
Then the Brightness temperature got from relation (2) which is separately calculated for bands 31 and 32, should be less than that of the earth surface temperature which improves the atmospheric effect. Hence, the calculation of surface temperature has been done based on the relation used by Kumar-sen (2004).
T=0.39D2+2.34D-0.7DD1-1.34D21+0.56 (3)
Where:
T: the earth surface temperature (Kelvin) D: Brightness temperature of band 31
D1: Brightness temperature of band 32
Finally, the resulted temperature is changed in to degrees centigrade and classified into eight temperature classes.
B) Air temprature calculation: For calculating the air tmprature in the area at different day and night hours, a correlation was initially
established between surface temperatures
obtained from images and recorded
temperatures from meteorological stations (available in the region). Then, based upon the meaningful level of the resulted correlation coefficients, the representative algorithms
(relationship between calculated surface
temperatures and the hourly air temperatures of meteorological stations) were obtained.
Later, and based on the resulted algorithms, the hourly air temperatures of the whole Lut desert area were presented through temperature images.
3. Results
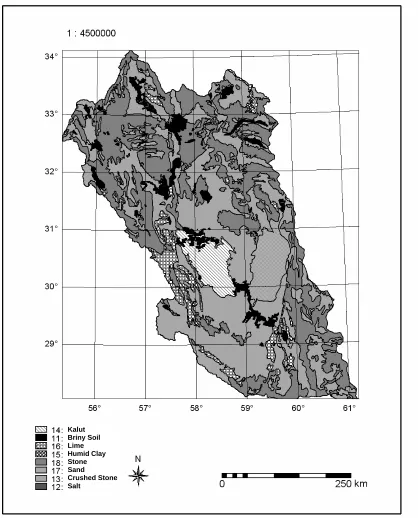
Using the available information the surface soil of the area was classified in to 8 major classes. Feature (1) shows the obtained surface soil map and table (3) shows the area that covers each class of available surface soil in the region.
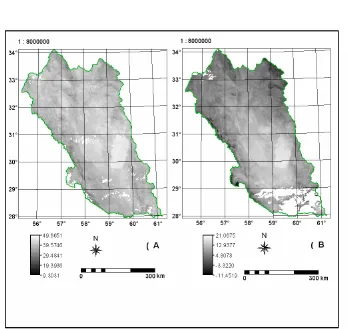
The surface soil temperature in the whole region has been determined for all images, with the rate of the 6 images and a pattern of classified map from surface soil temperature presented in Featured (2). The minimum, maximum, mean, and standard deviations of resulted temperatures are presented in table (4).
In table (5), the geographic coordinates of the hottest and coldest pixels are presented. The distinguishing coefficients that show the degree of coordination among the temperatures during the studied days are given in table (6).
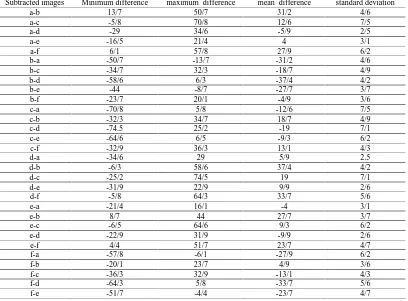
Table (7) reflects the minimum, maximum and different standard deviation rates within the intended days.
These are presented to demonstrate the temperature ranges at the first and beginning of each season. The rates of distinguishing coefficients between surface soil temperature and recorded air (through meteorology stations) were also determined, and presented in table
(8). Based on the t student test, these
coefficients are meaningful at a level of 0.001. Representing algorithms of relationship among these rates have been calculated and presented in table (9). Finally, hourly air temperature for the whole area of Lut Desert has been obtained by using the established algorithms. Feature (3)
shows some examples of hourly air
G. Azizi et al. / BIABAN 12 (2007) 7-15
10
Fig. 1. Surface soil map of Lut Desert
Table 3. The area pertaining to each class of surface soil material in Lut Desert
Crushed stone Sand
Stone Kalut
Lime Briny soil, Salt, Humid clay
Area
10564 70157
89885 7510
9826 9076
(KM2)
Kalut Briny Soil Lime
HumidClay
G. Azizi et al. / BIABAN 12 (2007) 7-15 11
Fig. 2. Surface soil temperature in Lut Desert using Sebal algorithm on days (A) June 24th 2003, (B) December 23rd 2002, (C)
G. Azizi et al. / BIABAN 12 (2007) 7-15
12
G. Azizi et al. / BIABAN 12 (2007) 7-15 13
Table 4. Some statistical properties of temperature rates resulted from Sebal algorithem for the studied days LST 2002/6/24 LST 2002/12/23 LST 2003/1/22 LST 2003/3/22 LST 2003/6/22 LST 2003/9/24
Min 298 264/5 264/7 255 282/1 295/4
Max 339/5 308/6 314/5 329/2 344/1 335/5
Average 322/6 291/2 295 309/4 328/7 318/17
SD 4/7 5/3 6/9 8/7 4/8 4/9
Table 5. The geographic coordinates of the hottest and coldest pixels based on Sebal algorithm on studied days
2002/6/24 2002/12/23 2003/1/22 2003/3/22 2003/6/22 2003/9/24
30 04 27 N 29 24 57 N 29 17 26 N 32 41 05 N 31 15 21 N 29 06 31 N MIN
57 31 57 E 57 13 13 E 57 14 26 E 55 38 57 E 56 28 05 E 57 24 54 E 30 37 56 N 30 19 44 N 30 23 43 N 29 59 02 N 30 42 59 N 30 24 17 N MAX
59 46 03 E 59 34 20 E 59 20 47 E 59 08 45 E 58 28 35 E 59 22 00 E
Table 6. Distinguishing coefficients among temperatures with the studied days
T 2002/6/24 T2002/12/23 T 2003/1/22 T 2003/3/22 T 2003/6/22 T 2003/9/24 T 2002/6/24 1
T2002/12/23 0/3136 1
T 2003/1/22 0/2601 0/7056 1
T 2003/3/22 0/25 0/5329 0/9409 1
T2003/6/22 0/7056 0/3721 0/3364 0/3481 1
T2003/9/24 0/6084 0/4624 0/5625 0/5476 0/7225 1
G. Azizi et al. / BIABAN 12 (2007) 7-15
14
Table 7. Some statistical properties of temperature within the studied days (a) June 24th 2002, (b) December 23rd 2002, (c) March
22nd 2003, (d) June 22nd 2003,(e) September 24th 2003, January 22nd 2003
Subtracted images Minimum difference maximum difference mean difference standard deviation
a-b 13/7 50/7 31/2 4/6
a-c -5/8 70/8 12/6 7/5
a-d -29 34/6 -5/9 2/5
a-e -16/5 21/4 4 3/1
a-f 6/1 57/8 27/9 6/2
b-a -50/7 -13/7 -31/2 4/6
b-c -34/7 32/3 -18/7 4/9
b-d -58/6 6/3 -37/4 4/2
b-e -44 -8/7 -27/7 3/7
b-f -23/7 20/1 -4/9 3/6
c-a -70/8 5/8 -12/6 7/5
c-b -32/3 34/7 18/7 4/9
c-d -74.5 25/2 -19 7/1
c-e -64/6 6/5 -9/3 6/2
c-f -32/9 36/3 13/1 4/3
d-a -34/6 29 5/9 2.5
d-b -6/3 58/6 37/4 4/2
d-c -25/2 74/5 19 7/1
d-e -31/9 22/9 9/9 2/6
d-f -5/8 64/3 33/7 5/6
e-a -21/4 16/1 -4 3/1
e-b 8/7 44 27/7 3/7
e-c -6/5 64/6 9/3 6/2
e-d -22/9 31/9 -9/9 2/6
e-f 4/4 51/7 23/7 4/7
f-a -57/8 -6/1 -27/9 6/2
f-b -20/1 23/7 4/9 3/6
f-c -36/3 32/9 -13/1 4/3
f-d -64/3 5/8 -33/7 5/6
f-e -51/7 -4/4 -23/7 4/7
Table 8: Coefficients between calculated and recorded temperature at meteorological stations
R square Time to Greenwich
0.720801 00:00
0.833569 03:00
0.87356 06:00
0.906304 09:00
0.891136 12:00
0.891136 15:00
0.824464 18:00
0.795664 21:00
Table 9: Liner relations between resulted temperatures (from satellite path available images) and recorded temperatures meteorological stations
Obtained Algorithm Time to Greenwich
y=-2.562+0.579x 00:00
y=-6.032+0.653x 03:00
y=-2.002+0.672x 06:00
y=1.622+0.670x 09:00
y=3.379+0.651x 12:00
y=-0.819+0.709x 15:00
y=-1.865+0.654x 18:00
y=-2.877+0.616x 21:00
4. Conclusion
According to the results obtained from application of Sebal algorithm and obtained temperatures in the area, the highest calculated surface soil temperature, in the six available
images was 71.1 C as related to June 22nd 2003
and the lowest was 18 C related to March 22nd
2003. The mean surface temperature for June
24th, December 23rd 2002, January 22nd, March
22nd, June 22nd, and December 24th 2003 were
2.6, 18.46, 22, 36.4, 55.7 and 45.3 C,
respectively. The minimum surface soil
G. Azizi et al. / BIABAN 12 (2007) 7-15 15
5602, 71.1 and 62.5 C, respectively. The mean difference between maximum temperatures according to images of the mentioned days was found out to be 1.5, 44.41, 49.8, 74.2, 62, and 40.1 C , respectively. The highest number of pixels in the images of the above-mentioned days were located at the temperature classes of 45-55 C, 15-25 C, 15-25 C, 55-65 C, 15-25 C, respectively. The maximum difference between calculated temperatures from Sebal algorithm and on different day's states that the maximum difference among similar pixels of temperature was 74.65 C in the six studied images. These are related to the temperature
difference of the two similar pixels on June 22nd
2003 and March 22nd 2003. The minimum
temperature difference between the same pixels in the six above-mentioned images are related to temperature differences between two similar
pixels, related to January 22nd 2003 and June
22nd 2003, the difference being 5.8 C. A
determination of the relationship between surface soil temperature and hourly air temperature at meteorological stations prove that the highest determinant coefficient among calculated temperatures of the six studied images and the recorded temperatures at
meteorological stations were: 09:00 (R2=0.9),
12:00 (R2=0.89), 15:00 (R2=0.89), 06:00
(R2=0.87), 03:00 (R2=0.83), 18:00 (R2=0.92),
21:00 (R2=0.80), and 00:00 (R2=0.72) according
to Grinwich mean time. The closest available correlation was found to be at 09:00 o clock, the reason for which could be the high time lapse between changing air and land surface temperatures.
When the recorded temperatures at
meteorological stations are compared with the calculated temperatures, it becomes evident that use of MODIS sensor images and Sebal algorithm provide reasonable results for finding temperature in an area. Therefore the use of these images seems to be applicable for finding the needed information about the other places temperatures. In this research, because of a lack of coincidence in the studied images the resulted coordination as compared with actual
coordination rates were low, resulting
algorithms of low accuracy. Also, the errors resulting from the non-correspondence of the location of separative power in reflexive and thermal bands, geometry corrections, a lack of calibration of Sebal parameters in the studied regoin and no assurance of correction of the employed meteorological data also should be taken in to consideration. Employing a larger number and more update images with high location separative power, exact field measuring
for determining the exact type of surface soil in the region, exact geometric correction of images and calculating the radiance powers of different region surface soil materials, especially at salty-flats and desert regions can present the thermal and climatic features of the zone in a more exact and acceptable manner.
References
Japan s remote test association,1995. The Remote Test Principals. Farshid Jahedi & Shahrokh Forrokhi. Iran s space department publication. Alaee-Taleghani, M., 2002. Iran s Geomorphology.
Qoomes publication.
Alavi-Panah,K. & et al., 2002. The studu of limitations in providing surface temperature maps in Lut Desert using Landset Satellite thermal band data, Lut Desert scientific-research Journal. Valume 7 number 1.
Alavi-Panah, k., 2003. Usage remote Test in Soil Sciences, Tehran university publications. Kardavani, P., 1972. Human Effects and Natural
Factors In Progressing Lut Desert Scientific-Research Journal. Tehran university.
Vidar, cel., 1989. An Introduction to the Solar Energy For Engineers, Translated by Sayyed Ahmad Sayyedi Noghani. Astan-e-Qhods publication.
Abcar, A., 2003. Development of methodology for generating land cover map of Iran for updating GIS database using TERRA-MODIS images, an international advanced school in RS and GIS , Jihad ITC, Y-N Toosi Univ of technology joint educational program. ASTER website. 2004. Thermal remote sensing.
Bastiaanssen, W.G.M., Meneti, M., Feddes, R.A., Holtslag, A.A.M., 1998. A remote sensing surface energy balance algorithm for land (SEBAL) 1.Formulation. Journal of Hydrology 212-213
Bostiaa, N. N., 2004. G.M Remote sensing in water resources management.
Foroogh, B. & M. R. Saradjian, 2004. Emissivity determination for land surface temperature estimation of Iran using AVHRR thermal infrared data.
Kumar Sen, P., 2004. Diagnosing Irrigation Water Resources with Multi Sensor Remote Sensing and GIS Techniques (A Case Study of the Roxo Dam Irigation System, Portugal) International Institute for Geo Information Science and Earth Observation Enschede, the Netherlands. Kustas, W.P., Daughtry, C.S.T., 1990. Estimation of
the soil heat flux/net radiation ratio from spectral data. Agr. Forest Met. 49, 205-223.
Prata, F., 2000. Global distribution of maximum land surface temperature inferred from atellites, CSIRO atmospheric research aspendale, Victoria, Australia.
Regional meteorological training center (RMTC). 06 to 17 september 2003. Organized and hosted by WMO.RMTC/Tehran, Iran.
Xie, H., 2003. Some MODIS products and pre processing.