document has been scanned from original documents. If you find this document is not readible, or you suspect there are some problems, please let us know and we will correct that.
Rothamsted Experimental
Station Report for 1973 Part
2
Full Table of Content
The Behaviour of K Remaining in Soils from the Agdell
Experiment at Rothamsted, the Results of Intensive
Cropping in Pot Experiments and Their Relation to Soil
Analysis and the Results of Field Experiments
A. E. Johnston and J. D. D. Mitchell
The Behaviour of K Remaining in Soils from the Agdell Experiment at Rothamsted, the Results of Intensive Cropping in Pot Experiments and Their Relation to Soil Analysis and the Results of Field Experiments, A. E.
Johnston and J. D. D. Mitchell (1974) Rothamsted Experimental Station Report For 1973 Part 2, pp 74 97 -DOI: https://doi.org/10.23637/ERADOC-1-34634
lhe
Behqvioul gfK
Rcmainingin
Soils from the Agdell Experiment at Rothamsted,the
Resultsof
Intemive Cmpping
in Pot
Experiments andtneir
Relationto
Soii
Analysis and the Results
of
Field ExperimentsA.
E. JOHNSTON aod J.D. D.
MITCHELLDescription of the soils used aud the field eryrcdment
Agdell field, Rothamsted, is on soil classified as shallow Batcombe series, a shallow
flinty
clay loam or very flinty loam over Clay-with-flints. Cropping and manuring on this field
are known since 1848; details were given by Johaston and Penny (1971). The Classical
Rotation experiment, 18218-1951, was made
on
six large plots which testedtwo
four-course rotations differing only in the cropping in thethird
year: roots, barley, fallowor
legume, winter wheat. The fallow break was on plots
l,
3 and 5; the leguminous crop was grown on plots 2,4 and 6. Only the roots were manured; there were three treatments,unmanured Glots 5 and 6); P only, changed
to pKNaMg
in
1884 (plots 3 and 4); andNPKNaMg (plots
I
and 2), the Nbeing given as a mixture of ammonium salts and rape cake, which also supplied some P andK.
Becauseofthe
differences in manuring and the extra uptakeof
nutrientsby
the cloyerthe
six plots contained different amountsof
soluble P andK in
1951 when the Classical expreriment ended. Byl95l
soils on plots 1and 2 and parts
of
plots 3 and 4 had become acid whilst soils on the remaining plots still contained free CaCOa. The acidity was corrected by applying yarying amountsof
chalk
in
1954, 1959and
1967. The experiment was fallowedin
1952 and then during195|57
three cereals crops and one crop each of beans and potatoes were grown without applying P orK
fertilisers.In spring 1958 P. W. Arnold took soil from each plot to study potassium release from
these soils under intensive cropping
in
the glasshouse;the
results were discussed by Arnold and Close(l96lb).
Alsoin
1958 half of each rotation experiment plot was sownto grass given
N
fertiliser at 100 kg N/ha for each cut taken at silage stage. This experi-ment was designed to find at what rate and for how long p andK
would be released fromthe residues. Grass was grown from 1958
to
1969-70; the results were given by Johnstonand Penny (1971). The half
plot
not
sownto
grassin
1958 grew arable crops during 1959-62 to test P residues, basal dressingsofN
andK
fertilisers were applied; the resultswere discussed
by
Johnston, Warren and Penny (1970). These arablehalf
plots werefallowed continuously
from
1963to
1970,Dudng 1958-63 the combined efects of the residues
ofp
andK
were measured by the yield of grass. Each harvest of grass taken from the six plots was analysedfor
p andK.
Towards the latter part of the period decreasing concentrations of
p
andK
in the grass suggestedthat
Por
K
suppliesfrom
the soil might belimiting
the uptakeof
K
or p
respectively. To measure the separate etrects of P and
K
residues extraI(
or p, in additionto N,
was givento
sub,plots testing P andK
respectively. This test startedin
1964 andat tlte same time three amounts of fresh K fertiliser and three of fresh p fertilser were also
tested by dividing each grass half-plot into eight suh.plots. Treatments and symbols were:
Nutrients as P2O5 ord KzO (kqlha)
ffi7;triple
nperphosphate otd potasshm,P test subplots K test sub,plols
PoKr
PrKr
PzKr P4K.
PrKo P.rKr
PIK'
PrKa
PzOs
KrO2m8
trone2008
3142008
6282008
1256PsOr
KrOflone
1256s02
1256tm4
12562m8
1256POTASSIUM
IN
SOILSFROM
THE AGDELL
EXPERIMENT
Also
in
1964 the arable/fallow half-plots were similarly divided into eight sub.plots which had the eight treatments listed above.The amounts of
K
fertiliser appliedin
1964 would have increased the K contcnt of the 0-23 cm depthof
soilby 99,
198 and 396ppm
K
for
theKr,
Kz
and X-r treatmentsrcsp€ctively
if
none was leached. This calculation was basedon
Hall's
(1905) resultttrat a hectare of fine soil O-23 cm deep on Agdell weighs 2632 t/ha. We have used this
weight
of
fine soil per hectare throughout this paper. The large dressingsof
freshK
were intendedto
give four amounts of exchangeableK
on the gass half plot and fourotr the arable half. Because the grass had removed
K
during195H3
and so decreasedthe exchangeable
K
contentof
the soilit
was expected that the two larger amountsof
exchangeable
K
on the grass soils would approximately correspond with the two smaller amountson
the arable/fallow soils.In
an attemptto
maintainthe
differencesin
theexchangeable
K
contents of the grass soils theK
content of the grass at each harvest wasdetermined and the total amount of
K
removed each year by the gass was replaced as fertiliserK
in
the following winter, except on the Ko subplots whereno
newK
wasgiven. This experiment continued
until
1970. Altogether there were 48 sub-plots which tested:I
.
K
release from soils not givenK
since 1 848 and from soils enriched withK
residuesfrom manuring a four-course rotation
from
1848to
1951.2.
The more recent effect of arable/fallow or grass cropping on theK
content of these soils.3.
The effect of recent very large dressings of fertiliserK.
To
complement the experimentin
the field a glasshouse experiment was startedin
1967 to measure
K
release from these soils by exhaustive cropping. The soil of each sub-plot was sampled to 23 cm by taking cores with a 7-cm diameter steel q/linder; about teDcores were taken
for
each sample. The samples were slowlyair
dried on paperin
theglasshouse. As they dried, grass, large roots and stones were removed where n@essary
and the soils were sieved in succession through l'25, 0'62 and 0'31 cm square mesh sieves.
The soils had completely air dried before they were subsampled for the pot experiment and
for
analysis. The analltical sample was ground to pass a 2-mm sieve.We have adopted the following conventions in this paper:
l.
'Rotation experiment' plotsor
treatments are the six plots and the cropping ormanuring treatments given during the Classical experiment, 1848-1951.
2.
'Arabl4fallow soils'and'grass
soils' are soilsfrom
the half-plots growing arablecrops, 1959-62, subsequently fallowed,
196!70,
and
soilsfrom the
haf-plotsgrowing grass, 1958-70.
3.
Ryegrass refers only to the grass grown in the pot experimentin
the glasshouse andthat grown in the first cropping period of seven cuts is the first crop whilst that
in
the second cropping period, also of seven cuts, is the second crop. Grass grown inthe field experiment is refered to only as grass.
4.
K
uptake by ttre ryegrassin
the pot experiment is expressed as pPmK
in
air-drysoil.
Pot exFrim€nts
The
first
pot
experiment was madewith
four
replicatesof
eachof
the 48 soils, one replicatein
eachof
four
randornised blocks.Four
hundred gramrnesof
soil(air
dry,<0.3 mm) and 200 g
of
quartz(>3
mm)for
each pot were moistened and well mixed. Perennial ryegrass (0'5 gof
seed perpot)
was sown. Basal nutrientsN,
P andMg
at100, 50 and
l0
mg per pot were given at the start and 25 mg P and 5 mgMg
after theROTHAMSTED
REPORTFOR
1973,PART
2usually after each cut of ryegrass had been taken. The soils were kept moist by adding
demineralised water to the glass saucers in which each pot stood.
The grass was cut after 43,71,113,189, 259, 335 and 5zl{) days, dried, weighed and then aralysed for K by extracting with cold 0.5,V HCl. Little dry matter was produced at either the sixth or seventh cut and the experiment was stopped. The stubble was removed from
the-pots and the moist soil sampled
for
analysis. The soils were then allowed to air dryand as much as possible
of
theroot
residue was removed by sieving.euartz
and soilwere then separated by a 2-mm sieve. The air-dry soil was sampled for analysis before the soil from each of the four replicates was bulked and stored.
It
has never been possiblein
these 'exhaustion-type' pot experimentsto
decideif
thegrass died because of genuine lack of nutrient or because of some other factor, possibly conc€med with the root environment in the pot. In a different experiment Addiscott and Johnston (1974) tested the effect ofresowing pots after removing the stubble but without
air
drying the soil and foundthat
the newly solvn grass germinated and continuedto
qrow fo1 a further 734 days after a fust cropping period that had lasted
for
l4l3
days.The 'exhausted' soils from our first pot experimeDt were resown
to
test the effect ofair
dryir]g the soils. The second experiment was restricted
to
60 pots, one replicate of each of 36 soils and two replicates of the renaining I 2 soils. Three hundred and fifty grarn:nes of soil (airdry
<2
mm) and 130 g of quartz(>3
mm) for each pot were moiitened and well mixed. Perennial ryegrass (0.5 g per pot) was sown. Basal nutrientsN,
p
andMg
at 100, 50and
l0mg
per pot were given at the start and 25 mg p and 5 mg Mg after the third cut. Fifty milligrams N per pot was given after each cut of ryegrasshid
been takenin
the second period of cropping. The gass was cut after 41,8l,
ZU,3Ol,
4f.5, 496ad
749 days makng the total of the first and second cropping periods 1289 days. The grass
was dried, weighed and analysed
for
K
as previously. There was verylittle dry
mitter
produced between
the
sixth and seventh cuts and the experiment was stopped. The stubble was removed, dried, weighed and analysed forK.
The soils were samptid wtrilststill moist and were then air-dried, the quartz was separated using a 2 mm sieve and the air-dried soils sampled for analysis.
Lrborrtory exFrime[ts
Previous results (Johnston
&
Addiscott,
l97l)
showeda
good relationship b€tweenK
uptake by ryegrassin
pots and the quantityof
K
in
soil measured as exChangeableto neutral N-ammonium acetate, K€, even though the ryegrass removed more
K
from the soil ttran that measured as exchangeable. OnlyKs
was determined on the soilsin
ourpot
experiment exceptthat
the equilibriumK
potential, Ad6, was determinedon
themoist exhausted soils
at
the endof
the
second cropping period. Resultsof
theseK
potential
measurementsare
discussedin
detail
by
Addiscott and
Johnston (1974).Appendix Table
I
showsK.
in
the soils determined at the startof
thepot
experiment andin
the moist exhausted and subsequently air-dried soils at the endof
the first andsecond cropping periods. The efect of air drying on the exchangeable
K
content of the soils is also discussed in detail by Addiscott and Johnston (1974).Pot experimed r€sults
Cumulstive
X
uptake related totime.
CumulativeK
uptakes by ryegrassfor
all treat-ments are given in Appendix Table 2. Fig.I
shows cumulativeK
uptake plotted against timefor
the Ko and Ka treatments on the grass and arablefallow half pibts of threeof
the Rotation experiment plots (plotsl,
3 and 5). Although the amountiof
K
removed by the ryegrass depended on all the previous treatments, the shapes of the curves variedPOTASSIUM
IN
SOILSFROM
THE AGDELL
EXPERIMENT
fittte suggesting that the treatments in the fiekl experimelt had little efrect on the pattern of
K
release when the soits were cropped exnausiivety in the glasshouse' The'steplike'
i;;;;;il
G
"rrves
in Fig. r
*^r-f,.i"
ioi
ttt"o
up ut thettatt
of the s€cond cropping oeriod. This extraK
was-aa"
aruiLUt. Ui
air drying the moist soils exhausted by theffli:r';1i;;;';;*;;";
A;;h"p" ir u"
'ipt"t"
curvefor
the rater cuts of theKo
grass soils
arable/ fallow soils
-
.E 300!
zoo .g!a
100E.
EO
R
a
b-6sm
Pmc
a
1->z
60( .9!so
IJTiie frorn sol,'/ilg, daYs
ROTHAMSTED
REPORTFOR
1973,PART
2second cropping period was very similar to that at the end of
the first cropping period. This result agrees
with
rhatof
Addiscou and Jobnston irsiif.
,r1h.i,
.ifl..ii,iot
in"
n,"rl::1":"^y1-yithour
air dryins.the soils; the step in each cumulativeiptake
curve:T_T:::,rTiTr,lo"1
:o^:y.*p.Amcnt
using air_dried soils.K
uptake by the secondcrop vanoo rrom about lO% to more than
60%of
that iD the first crop. This wide range of values is_ related to large diferencrsil
f_upiakein tfr.
n^t
"."p
.itn"r
tt an totarle
diflerences in the second. In general the K- taken up by
til,;;;;
;Iop
u.
"
percentageof
the.
K
in
the first crop decreased as rheK
uptake'byihefinr;;;;l;creased.
A
large proportionof
theK
taken_upty
rne nrJtcr"f
*".
..t"".a
by the first fivecuts' Table
I
shows this was rittlear&ed
uytte -ost'r.""ni
ir""tments
in
the fierd.K
remoued in thefrst
fue
"uu
o,
o,nffi
,ly
*"
ya r
n*oaed
in rhefiBt
ctopof
ttegrass grown in pots on soilsfrom
the Agdell experiment,lg4g_Ii66
(Meatr of a[ six rotation experioeot plots)
K.rr€atmetrt
TrcatmeDq 195H6/:
--.--:--- Arabiei
GrassSymbol
kg Kiha
falowsdib
;G'
If,
o
90
96Srt8986
Kr
5-22
90
85K.r
1043
m
86Mean
93 88 88 88 89
These results
agee
with
those obt"inedfor
other Rothamsted and Woburn soils by*;?l11ll-9,j:.(le6Jtr),,ralibudeen
and.Dey frgoril,i.L".tonld
Addiscott(te7l)
atro ror orher Bntlsh so s bv Arnold and Close
(l96la).
The results suggest tbat muchof .th9 ditrerent amounts
of
avairable.Kin
soilsir,i
ri""
61,
.]*sed
in
about2zlo-300 days of intensiv-e c_1opping.
Experiments.uo"
tooir"r"-otiut"let*"en
soilsin
theiramounts
of
availableK
can therefore be. done. profitablyio
S_l0-_orth"
especiallyii
made during March-October when growth, urdi.r; at;;ino]
u.e_uxi-ut.
Cmuletive K upta&e relrt€d to
y'timi.
Addiscott and Johnston (1974) discussed reasonsl:l-"::y:y,:l--tarionship
between cumulariveK
uptake-o
7,i_"-*r,i'rp*i"i
rererence
to
determimngthe
Drocess- governingthe
uptakeof
non-exchangeableK
(Koe)' Fig' 2 shows rbe resurtsforlhe
x.1*or.lri
o"
uoi
erutJ*ii,
i,
ou.e*p.ri."ots
*::r.:l lglll:ryT*:
pr"P.
(
,ptur,J uv tr,"n.it?;;
;;;.s,,,
*as rinearry rerareoro Vtrme
betweeD the fourth and seventh cutsfor
both arablefallow and gras.ssoils. This supports the conclusion of-A-ddiscott
"ral;h;;;';;
a diffusion process most probably determined the rateof
K.uptate
in
tfrisJe-rioa.ii-
our experiment the amount of
K
taken up in the first cut was laiger than thefltt-ln
excn=angeaUbf,
thus the
K
uptake by the second, third andfourtlguti
*";;;;a;bly
f;;;'i,itiully
nor_"r"huog"-able
K.
Th€ cumularive,K uptake:
y'time
relatio'nshipb",;;;;
second and fourth cuts was almost linearbut
verv much.sreeperttun
ti"
,uU..qu.ri
tir.u.
,.tuiionr6p
between tbe fourth and seventh cuts. This suggests tfrat rcJifiJsJ'elther
from a larger
'pool'
or at a much faster rate between the.frrO
"ra
f"r.tii
*i"
'The relationships between cumulativ,e
K
uptake unalC-"
ioiifr"
grass soils can becompared
with
thosefor
the arable/falow soirs.Much'c**-i".o*o
from the grass soils during 1958-66 so thatin
tie
pot
experiment tt"
uu".ug"'"-ornt
of
K
taken upPOTASSIUM
IN
SOILSFROM
THE AGDELL
EXPERIMENT
Ko grass soils
26 31
5
3
2&4
5 't &6
EO
i,i
t
E
zooI
F
600P
a
lr
{
s
)Z
,m
E
o
Ko arable I fallot/t/ soils
10
15 lst croppiE Perin25
30
35I
z,ta ctoppi"g PeriodJ"*
*T'3;1
ft"IflliHiB,rflfi""fit]'ii*"f
,il3E&Ti {iff"f
:^'x"1ffi:fiiusrdff
trx,#
ROTHAMSTED
REPORTFOR
1973,PART
2dry soil (range 59-90 ppm K). The range of values was not related to the rotation
experi-i:11.t1?!T*:t.
]\4uch. of trys^!
plobably became available as a result oft*o
p.o"!r".,
(r)_by rerease during winter 1966-67, i.e. after the grass ceased to grow in october tg66
and before-the soils were sampled
in
spring 1967;-(a as a resultif
air drying the soilsafter sampling.
After
the first croppi;g
*itt
.yigrus
was stopped the;oiil
did
notremain moist but were air-dried immediately
ard
tl"o
.eror"o.id.
urnourtof
K
taken up in the following second, third and fourth -cutsof ryegrass was elual to only3t;p;i
in the^air-dry soil (range 23-46 ppmK),
rather lessthin
harf thai in ttrecoireffiaing
:1,1i.-".f^11?
1T!."."l,ping
period. There w-a_s- littte changein
theK
content of the arable]il,:*.:",I.,
-oy:,C
tbe.arable cropping 1959_62 and the soils were then fallowed duringl yoJ-{o. r.rg. z slrows that on tbe arablefallow soils
K
uptake by thesecond,
third
anI
800
E
!
*
600)z E
&
o
zl0op.
P
q
200i
E
N
20Otitialexd
ngeaue K, pprn K h .*-(}y sdl,ru?Jt1,.lr"lXd$i'1,"t[ffi
["11ff...",Jff,5*""1?,r3/iiffiSHi],:8,j,.ffrffi1#u,i*
aaa
o,
,g
80
(slopey:2.355,
-
13.88;r:
+0.94)o
POTASSIUM
IN
SOILSFROM
THE AGDELL
EXPERIMENT
fourth cuts of ryegass was larger from soils with residues of
K
from the rotation experi-ment treatexperi-ments than from soils unmanured since 1848. The slopes of the linear portionswere also steeper where soils contained residues. However, in the second cropping period, the average amount of
K
taken up was 39 ppmK
(range 20-59 ppmK)
in
the second,third
and fourth cuts. This result was almost identical with theK
uptake by the corre-sponcling cutsof
ryegrass from the grass soils. This suggests that theK
residuesin
theirablefallow
soils were exhausted by the first crop of ryegrass and thatK
uptake by theseconi crop depended on
K
diffusing out from the same source on both groups of soils. The slopes o1 the linear relationship between cumulativeK
uptake andy'time
were calculated for cuts2+
and cuts 4-7 for the arable/fallow soils, from which the ryegrasstook up
muchK.
K
uptakesfrom
the grass soils weretoo
smallto
enable the samecalculaiions to be made reliably.
Wlen
the slopes were rel,ated to the initial exchangeableK
in
the soils the correlation was poor(r: f
0'62)for
cuts zl-7 supporting Addiscottand Johnston's conclusion that
little
of thisK
fraction isin
direct equilibriumwith
theexchangeable
K.
For the uptake by cuts 2-4 the slope was better correlated(r
:
+
O'77)with
tG
initial
exchangea6leK
suggesting that moreof
this fractionof
soilK
wasin
equilibrium with the exchangeableK.
Cumulative
K
uptake relatedto initially
exchangeableK.
Appendix TableI
gives theinitial
exchangeibleK
and K€in
the moist exhausted and subsequently air-dried soils after the firstind
second crops of ryegrass were grown in the pots. Fig. 3 showsK
uptakein
the first cropof
ryegrass was well correlated(r
: *
0'94)with initial
Ke when ex-changeabler
rangeofrom
95to
370ppm
K'
Assuling
that
the
linear relationshipbetwln
K
uptakeind
fu
continues, extrapolating the data in Fig' 3 indicates that therewould be no uptake
of
K
by the ryegrass when Ke decreasedto
48 ppmK;
this value agrees excellenilywith
that;f
Arnold
and Close (1961b) who, -for soils from the samefi;ld,
fountl about 50 ppm Ke as the value at which there would be noK
uptake' Thevalui
also agreeswell^iith
the experimentally determined exchanqeableK
contentsof
the moist exiausted soils. After thC first crop of ryegrass was taken Ke in the moist soils**,
o,
ore.ug", 62 ppmK
whilst after the second crop there was 37 ppmK'
Th, ese smallvalues
for
K.-were -measuretlin
moist soil after exhaustive croppingin
the glasshouse'on
air drying these soils Ke increased to 80-90 ppmK
but these values were still smaller that tnosJ fo"una in comparable soils in the fleld experiment. Johnston and Penny (1971)showed that although griss hacl remove6 860 kg
Kiha
during 1958-7O from soils wittroutK
manuring sinceit+i,
X"
in air-dry soilin
1969 had decreased onlyto
107 ppm5'
--K
uptaki
in
the
first
thrce cuts'(113 days) was only- s.ligha-y lesswell
correlated1,'
:
1
O'e1*itn
initial K€. This result agrees with that of-Arnold.(1962) who foundK
iptate in
36 days cropping waswell
correlated(r
: *
0'88)with initial
K"
(rangetilt8O
p;-
K) for
64ioitriut",
from 50 sitesin
England. The totalK
uptake in both;;";;;i;"#.r
was also well correlated(r:
*.0'93)
with Ke'
However,K
uptateioiir"
t"-oi"top
of ryegrass was poorly correlated(r
:
+
0'68) with Ke in the air-dryroii
utttt"
ttu.t
oi
the seJondcroplng
period. This, presumably, was becauseK
uptake6;h;
;.;d ;.p
tlependerl muctr mJre on the amount and type ofK
releasing mineralsin
ttre soil.Arnold
and Close's (1961b) resultsfor
the Agdell soils showedthat
K
uptake was tinearty corretateawith
ioitiai Ke.
The results we report arenot
quite so good' The ."-urorifo.
t*t
is not known but ihe following explanation is suggested. When sampledin 1958 the soils had had ten yean without
K
minuring or intensive cropping' Amplg -tim1ir"J
a"p*o
thereforefor
"q"itiu.io-
between exchangeable and -non-exchangeableK
io
te,esltattisteO. The 1967 samples were taken from soils with and without recent largedressings
of
freshK
and someof
the soils had been intensively cropped whilst othersROTHAMSTED
REPORTFOR
1973,PART
2were fallowed.
It
is probable therefore that equilibrium between exchangeable andnon-exchangeable
K
had not been re-established and the relationship betweenK
uptake and Ke was less good than when equilibrium had been established. This is supportld by thefollowing
observation. When diferencesin
K€
betweenarablefallow
and grass soils(diferences due only
to
cropping and manuring since 1958) were correlatediitn,
ainer-ezces in
K
uptake by ryegrass from the two groups of soils, a linear regression accountedfor
78%of
the variance. This was less than the variance accounted tor (87/")
by
the Iinear regression ofK
uptake on Kein
Fig. 3 where the valuesfor
fu
depended on the history of cropping and manuring since 1848.Uptake of non-exchangeable
(K*)
or initially non availableK
by ryegassDetermhttian of ton-erchatgeable
K;
effect ofair4rying
safls.
Many workers havetried
to
relate releaseof
Kogto
the decreasein K"
on cropping. Both depend on the measurement ofK"
in
the cropped soil,decrease
in
K"
:
initial
Ke minusK" in
cropped soilsrelease of Ko"
:
totalK
uptake minus decreasein
K"
The amount
of
Ksin
moist exhausted soil, expressed on an air-dry basis, is not reatlily determined because allowance must be made for the amount of quartz in the soil-quartz mixture extractedwith
ammonium acetateand the
amountof
air-dry soil
must be determined.It
is easierto
determine Ka after air-drying especiallyif
the quartz can besieved out.
In
our experimentK"
increased on air drying the soils, the increase varied from 30 to160\
of
Ihe Kein
the moist soil. The second crop of ryegrass decreased Keto
smaller values ttran did the fust crop. However, after bottr crops Ke returned to the same valuein the air-dry soil so that apparently more
K
was released on air drying after the second crop. The amountsof
Kein
the moist andair-dry
soils and the incieases dueto
airdrying were:
Incr€ale
Moist
Air-drv
due tosoil
soil-
air drvingGrass soil
Inaa€ase
Moist
Afudry
due tosoil
soi,-
air dryiogArter
the
ExchangEable K, ppm in air-drv soil
lst-crop
!S
83
23
65
g9
242od
crop
38
80
42
36
91
55The
\ot1ti9n
experiment treatments apparently had a large efiect on the increasein
Ka on air drying. The amounts of Ke in the moist and air-dry soil after the second cropof ryegrass and the increas€s due to air drying were:
Classical Rotation expetiment treotments
Moist soil
Air-dry soil
Iricrease due to air
drying
33NPK
PK
UnmanuedExchangeable K, ppm in air{ry soil
34
34
4384
10550
62Exhaustive cropping decreased Ke
in
moist soi.lto
about 40 ppmK.
Soils wittroutK
rnanuringdwing
1848-1964 gained more exchangeablef
on aii-Orylng tUan soilswith
K
residues. However, this result is probably related to the clay conte;t;f
tie
soils, those82
POTASSIUM
IN
SOILSFROM
THE AGDELL
EXPERIMENT
which were unmanured in the Rotation experiment contained most clay because of their
position in the field. Neither arable/fallow or grass cropping, 1958 66, nor
K
treatmentsipplied
in
1964 had any effect on the increasein
Ks on air-drying the moist soils.Uptake
of K,
decreasein
f..
K
uptakeby
theflrst
cropof
ryegrass and decreasein
exihangeableK
in
soils, using the Ke contentsof
the moist soils, were well correlated(r
:
f0.95).
The linear regression, which had a slope 7:
2'887x+
3'558, acrountedior
90f
of the variance. Neither the Rotation experiment treatments nor theK
appliedin
1964 affected the ratio of theK
uptaketo
decreasein
Ke. There waslittle
consistent eflect of previous cropping:Ratio of
K
uptakeb!
tyegrass in pots to decrease in Kein
soil(meatr of six Rotation experimetrt plot!)
K
treatrneot Arablei
Gmss given1964
fallowsoils
soilsKo
3'45:1Kr
3'26 , IKz
3,24 | IL4
3.15:1Mea[
3'28: IK
takenup
by
ryegrassin
pots was,on
average'exchangeable
K
in the soil.2.73 |
3.05 :
3.31 :
2'81 i
2.99 i
Release
of
non-exchurgeableK
anrt decrcasein
(".
Becausethe
releaseof
Kne isderived from
K
uptakeii
would be expectedtiat
release ofK,e
and the decreasein
Ku would be relatecl asK
uptake wasto
decreasein
Ke. The correlation coefrcient for therelease of Kne and decreise
in K"
wasr
:
+
0'90 whilst that forK
uptake and decreasein
Ke wasi-
+
o'ss.Fig. 4
shows the relationship between releaseof
K"e
and the three times larger thanthe
fall
in
0
Deqease in Ke duirE lst crcPf)irg
with ryegres K pprn
Flc. 4. Relationship betweeo rclease of initially non-exchaogeablef(_ and thl d€crease in.exc-h.ESEable
xiiii"i
G-ii.t
-"ipG
;;.d
bv .v"sasso
soils frod arable/fatlow sub-plots,'
soils from srasssub-Dloas.
(slope v
-
1'33714 3558;r:
{0'90)83
*mo
a)
6
b z)0
g
.9
ROTTIAMSTED REPORT
FOR
1973,PART
2lnitial exchangeable K, ppm
.
FrG. 5._ RelatioDship betweefl -release of initially oon-exchadgeable K and the hitial exchangeable
K
io the soil. O soils from arablefallow sub-plots,
a
soils from grass sub-plots.(sloPe Y
-
1'933,-
7'378;r:
-1-9'31decrease in
K..
Theftted
line did not quite passthough
the origin but over the rangeof
values tested the releaseof
non-exchangeableK
was about twice as large as thefall
in
Kc.Release of norexchangeoble
K a
dinitisl
K..
It
is valuable toklow
how much non-exchangeableK
might be releasedto gowing
crops.In
the previous section releaseof
KDe was shown to be well related to decrease
in
Kein
soil. However, this required apot
eryeriment
to
measure decreasein
Ke.It
would be more usefulif
releaseof
Koe could be related toinitial
Ke which is simple to measure in the laboratory.Arnold
and Close(1961b) stated that many workers had stressed that equilibrium amounts of K" in different
soil q'pes are
not
nec€ssarily relatedto
theability
of
soilsto
release potassium fromnon-exchangeable sources. They showed
for
the
19 soils they examinedfrom
various parts of Britain that the release of Kou during exlaustive cropping tended to increase asinitial
Ke increased. They considered, however, that ttre relationship was not well enoughdefued
to
be a useful guide. Fig. 5 shows the relationship between releaseof
Ko" andinitial
K"
for the 48 soilsin
our exlrriment. There was a good correlation(r:
-l-.0.S2) which was significant at thel%
level. From ttre fitted lineit
appears that when thereii
no release of non-exchangeable K, the initial exchangeableK
intie
air-dry soil would be,10 ppm
K.
This is very close to the valuefor
Kp (4S ppmK)
at whicht-he relationship b€tween K uptak€ and Ke suggested that
K
uptake would cease. Our experiment showi thatfor
soils derived from the same parent material there is a good corrilation betweenthe release of non-exchangeable
K
and theinitial
exchangeablif
in
the air-dry soil.Relation between our results anrl those of Arnold and Close
The results
of
the experimeot reported here and that ofArnold
and Close(l96lb)
offer one of ttre few opportunitiesto
assess the reproducibility of the results obtainedin
this typeof
experiment.For
the comparisonof
K
uptakes by ryegrass only the resultsfor
our arable/fallow soils not given
K in
1964 (K6) can be used. Table 2 shows thatin
our84
POTASSruM
IN
SOIIII
FROM
THE AGDELL
EXPERIMENT
TAJI,E 2
Compnison betweel
-
the
results irt the PotelPeny?t,--t%7-72,
otd
those obtained by Amoldotd
Close (1961b)R€sutts in thc 1967-7,
trry,"f$,Y,i"blei
falow soils oDlvRotation
experiment
plot and featmeDt
l
NPK falow2
NPK clover3
PK fallow4
PK clove.5
None fallow6
Nooe clover MeanRotatioD plot
K aoDlied minus K r€moved (kg/ha)
Equiialent loss or gain io soil (ppm K)
123
-22 -34
-56
-
8 -12
-21
1967 minus
1958
1958456
-4s
+1(x)
+ll2
-r7 +38
+4285
Arnold &
Close
Difference
I minus 2 1967 227 t70 208
t9l
168 154 76 82-38
135A
50 55 4U 337 549 396 256 258 380154
73112
-2
178
30ty
59l0266
105
494
experiment average
K
uptake by ryegrass was equal to 435^ppmK
in air-dry soil whilstir-'tnut of
emoti
andilose
r
qita-te*^,
ooiutrage,
380ppmK'
The differencein
;"k
.;;;;i
to 55 ppm K in air-dry soil is onlv l5 % of the average uptake' 380 ppmK'
tffr;;ii;;d
c];t[r.
"*p".i-.nt.
ihi.
i.
usiti.fu"tory
result' Agreement between thei".rirn-.i,1"k.
"ip"ti-"ot
is improvedif
compensation is qadefor
knownchanges
ir"i"
"iirr"
"i"ur"l6iow
soils <turlig lgss-67.T;ble
2qows
Kj
iq
1958 and 1967 andin"
l-o".*r"
in
r"
duringten
yearsl This increasein
Ke
probably camefrom
non-exchangeable
K
reseryes; on average, the increase was 46.pPmK'
Assuming that gainin
ii
f;ffi-;t
f;ll
;as
about equalio
lossof
K
bv
leaching the average increase-in
Ke(46-;;;
i)
t,
th;
,oitao.irg
ilsa+7
was almosi equal to the extra 55 ppm K.tzken upLv
it'"
*"*u.,
in
our experiment. (Samplinglote'
theK"
resultsfor
1958 given heredi#
rffity
;;
inot.
"la-ora
":odilosel
Their samples were taken to represent the"UoL-"f,.r'"
Rotation experimentplot.
Our samples were takenby quarter plots.and there were small di-fferences in Ke between quarter plots' The results gtven here were
lrom
quarter plots sampled
in
1958 and againin
1967')Relrtion betreen results of the pot expedment
anl
the histories of tlle soils in thefiell
Because the histories
of
these soils are known so well the resultsof
thepot
and field^ exneriments can be mmDared to ta"to*
*"tt
potop*ments
can predict the releaseof
iifii#il';;il;;;J
;h.th.;
pot
ana' fietd ixperiments measure the releaseof
;i"-;;;;;i;s;;.;
oi
sollr.
eriiii,i
notation expeiiment plots were halvedin
1e58 the changein
soilK
content on"o"n
nuf-ptot
it
*"il
koo"o'
!h3-nsesin
arable/fallow,olf, *"iE r-uU
aoe to arable cropping during195
2 but much-K
was removed by the-nir.
au.ioe
t958-66. Tbus, for Jorrdponain-g arable/faltow aod grass soils' di.fferencesil?;;,;; ;;;A ;il',h"
toit.
*"."
t"tilta
foi
the pot experiment' can becalcu-i"",io.
ir-is58-ilt!.e
weres-all
differences, both plus un6 minus'.inK'
of the quader;Iil ,:;d;;];A
io.
iil"
i*t
"irt..r,
fe.titiserli
rhe
average diference was equalto
Ii."iio
tg ryh"
and is igporedin
the subsequent calculations'During
1959-62 there*"r"
6f"."-"oi
t"tweentfe K
applied to andK
removed by the arable crops grown on;;;;i;/i;lilharptots.
wt
en'rc apptied minusK
removed was calculatedtlere
wasttre following
K
balance:ROTHAMSTED
REPORTFOR
1973,PART
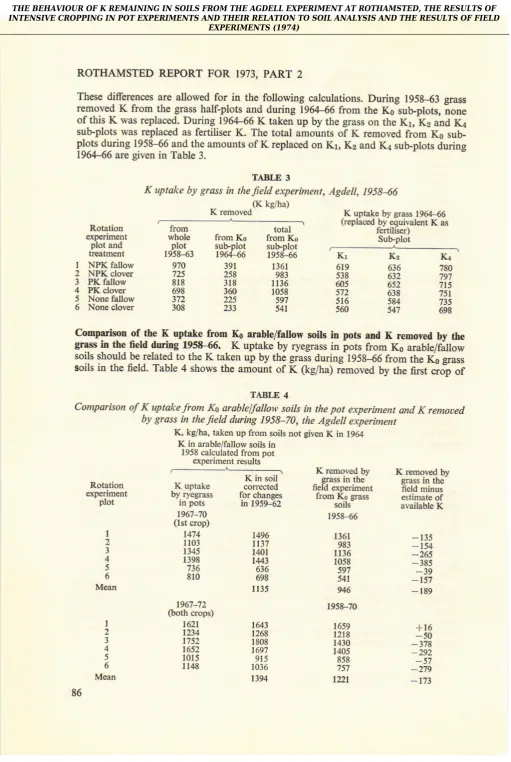
2These diferences are allowed
for in
ttre following calculations.During
195g_63 grass removedK
from the grass half-plots and during 196446 from theKs
sub-plots,ione
of thisK
was replaced. During 1964-66K
taken up by the gass on theKt,kz
andKr
sub-plots was replaced as fertiliser
K.
Thetotal
amountsof
K
removedfrom
K3sub-plots during 1958-66 and the amounts
ofK
replaced onKr,
Kz and K4 sub-plots during1964-66 are given
in
Table 3.RotatioD experiment
plot and treatment
1
NPK fallow2
NPK clover3
PK fallow4
PK clover5
None fallow6
Norle cloverTABLE 3
K
uptake by grass in the field experiment, Agdell, 195846(K ke/ha)
K removed K uptake by grass 1964-66 (replaced by equivalent K as
fertiliser)
total from
Ko
from Kosub-plot
sub.plot19g-6
1958-66391
135r2s8
983318
11363@
105825
597233
541Comparison
of
tk
K
uptake fromKr
arablefallov
soilsin
pots andK
removett bytte
gTls
ln th€ fieklrluing
195K.
.
K
uptake by ryegrassin
pots from Ke arablefallowsoils should be related to the
K
taken up by the grass during 195g-66 from the Ko grasssoils
in
the field. Table 4 shows the amoutrtof
K
(kg/ha) rimoved by thefrst oJp of
TABLE 4
Comparison of
K
uptake from Kn arablelfallow soils in the pot experiment andK
remoued by grass in thefeld
during 1958-20, the Agdell eiperimentK, kg/ha, taketr up from soils not givetr K in 1964
K in arable/fallow soils in
1958 calculated from pot
experiment rcsults
fiom
whole
plot
1958
{3
Sub-plot Ka 780 797 715 751 73s 598
K,
636 632 652 638 584 547 Kr 619 538 @5 s12 516 560 910 725 818 698 372 308 Rotation experimetrt plot I 2 3 4 5 6 M€n 1 2 3 4 5 6 MeanK uptake by ryegass
itr pots 1967-10 (lst qop) 1474 1103 1345 1398 736 810 t96r-12
(both cropg 1At 1234 1752 1652 l0t5 11,t8
K in soil
corected for changes
in 1959-42
1496 1137 l,l0l 1443 636 698 ll35 16r'.3 12.68 1808 1697 915 1036 1394 1361 983 1136 1058 597 541 946 1958-70 1659 1218 1430 l,to5 858 757 1221
K removed
by
K rcmoved bv gass inthe
srass in the_ fieldexperiment
held minusfrom Ko
grass
estirnate ofsoils
availableK
POTASSIUM
IN
SOILSFROM
THE AGDELL
EXPERIMENT
rvesrass from the Ko arable/fallow soils. This was not the amount
of
K
in
the arable/i;fi;-;J;;
lsss
-boroti
of
the changesin
the
K
contentduring
1959-62' These;h;G;;;; k"";,
so Table 4 shows the drrected amounts of availableK
in ttre arable/ iuUoG soif., derived from the pot experiment results, and com- paresit
with theK
uPtakelv
g."s
iltn"
n"fOdwing t'fsU66.
The amountsof
K
taken upby
the gras.sin
theniff
".
"U tfigntfysmalerlhan
the pot experimentestimates^of the total
K
availableto
iil"
g.rr..
ift"""r"*ge
difference, 189 kg K/ha is only 20% of the average amount of -K,"-!rJ i,
the fieltt: Table4 alio
shows ihe total uptakein
the field during 1958-70 anJ comparesit
with the amount of availableK
derived from the totalK
uptake in both"-p.
.T"y"g"t. irlots.
In this second comparison individual plotditrerences are rather
."-*
r"riLti"
t
t
o',
un"rug" the ryegrassin
pots tookup
15\
m-o-teK
than did grassi,
in"
n"fJ. However, theKLken
up from the soil in both pot and field experiments are sufficientlv closefor
confidencein
ihepot
technique asa
methodof
estimaritrg totalamounts of
K
likely to be available to crops over periods as long as ten years'Diflerences in
K
uptake between arablefaltow atrdCrlT
soi!^ilthe-pot
e{PrimentPt
,"rJ
to
oti.ut"d
differencesin K
contentof
themils
in 1967'
The differencesin
K
lJ#il ;;;&orairg
*utt.Ttutto*
and grass soils in the fleld.at the time of samplingi;1il7;b"
ca'lculated'and comparedwitl
the differenc€sin
the amounts ofK
taken;;;;.y6;
ilirt"
p"t
"ip".i.,i*.
Table 5 shows the diferencein
the amount ofK
TABLE 5
Difermces in Kuptake between arablef[atlow
qttt
Sray .soill rlthe Pot experiment compared-
'"
ti
iiiiorci
a*rences
inK
coniient of the soils in 1967, the Agdell experimentK, kg/bq taken up from soils not gived K in 1964 Difference in the
umount of
f tat"n
Estimated difierenceRotation
uD by ryegrass inpots
io the K coDtent.iil,iili,it
-'
-i'itiElratio*'
of ttre arable/fallow'ptot
mitrusgmss
and grass soilsK in 1st
crop
K uplqLe^bY-of
rYegrasi
grass 1958 66I
ll74
1339)
t18
e4e5
tooo
lo8li
toos
lo13;
A)
697i
+so
651Mean
79
955K in both crops ryegrass
1t l6
637
1189
to76
518 568
851
K uptake by erass 1958-70
1611
1t 84 1374 1360 958 869 1230
Difference measured by the pot experifient
minus estimated diferencE
-l6s
-231-81
-5
-25s
-203
-t56
-
s2l547
-
185-284
-4&
-301 -379
I
,
3
4 5 6 Mean
fks/ha) taken up by the ryegrass from the K0 arablefallow and Ko-grass soils in ttr€
pot
H3e;;;;.
T;;t
ui.o"i[o*,
the estimated differencesin
theK
contentof
the Koffii;/fiil'ff;;;"iG
calculated from the knownK
uptake bv the grassin
tht
n"n
,i"J tn"
chanlein
K
contentof
the arable/fallow soils during arable cropping -in;59;r.
i;tb
5 stows that the estimated difference in the amounts ofK
in the arable/f;i;il
g;-ilt
in
1967, was, on average,955 kgK/ha'
The difference inK
uptakeROTHAMSTED
REPORTFOR
1973,PART
2bf
the ry_ egr.ass was, on average, 799 kg Klha, about g5%ofthe
estimated difference.If
the resultsin
the preceding section are_ correct, namelyihat
ryegrassin
pots takesu;
most
of
the availableK,
thea our results which showihat
the di-trerenceiin
K
uptalie between arablefiallow and grass soils were larger when measured by grassin
the fleldexperiment than when measured by ryegrass
in
pots suggests that someK
in
the field experiment came from other sources. AmountsofK
in
ri-nfall
are too small to accountfor
the- discrepancy butK
could have come from the sub.soil. The amountofK
derivedfyom^
th-is source was, on average, about a sixth of the total
K
taken up by the grassin
the field.
Table 5 also shows that when to,r1
1t
'ptake by both crops of ryegrass was comparedwith total K uptake by gass in the fleld
du;ng
l9i8_70, apparenti
ricovery by ryegrass in pots was less; only 70f
was recov-ered compared to ilSf"
in the preceOiog"ut"oto:tion. There are two possibre expranations for this reiurt.
rhe
nrii
is trat'erass in ihe fierd took up moreK
from the surface soil than ryegrass was ableto
getiripots.
This would be possibleif
firmly
herd non-exchangeabreK
continuedto
beiomeiva
abre during the winter w-hen ttrere.was no crop uptake; intie
pot experiment the soil did not havJ this're.* 1n9 frost period'. This
in
tuln
suggests that the rateof
release of this categoryof
so-il
K
is quite slow. The second explanation is that as the surface soil was ext'auitedof K-the grass took up more
K
from ttre soil below 23 cm. In practice bothmechanisms
could work together.
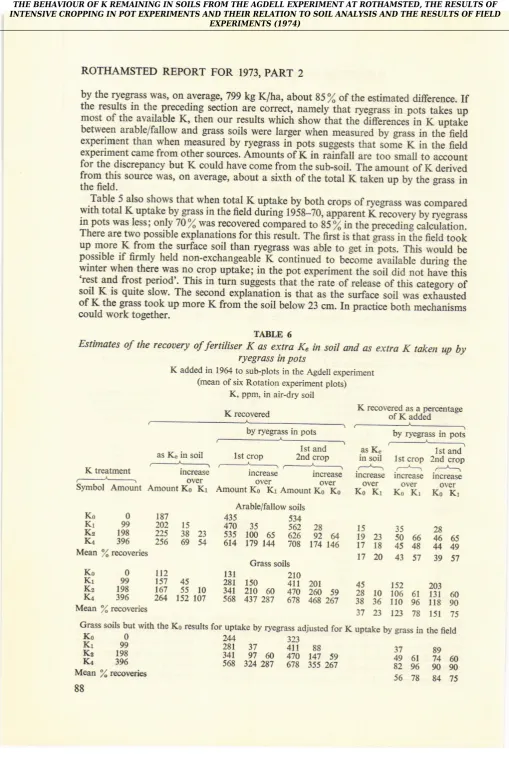
Estimates
of
the recouery of fertiliser;fTr:"
Ks in soil and as extraK
taken up byryegrass in pots
K added id 1964 to sut!.plots in the Agdell experiment (mean of six Rotation experiment plots)
K fteatmeDt
Symbol Amount
Ko
0
187Kr9920215
Kz 198
225
38
23Kr
396
256
69
54Mean % recoveries
Mead % recoveries
as K3in
soil
1stcrop
#j
#j,
tr*
- ,._--:
rocrease
rncreas€
" - utcre€se .- iDctease.-tOver
Over
OVer
OVerAmount Ko
Kr
AmountKo
Kr AmountKoKo K;'-i,
Arablefallow soils
43s
534470
35
s62535
10065
626614
179144
708Grass soils
K, ppm, in air{ry soil
K recovered
by ryegrass in pots
K recovered as a oer@ntaae of K add;d
by ryegrass in pots
lst and
lst crop 2nd clop
lncreas€ rncrease
Ko
Kr
Ko
Krm3
61 l3l
6096
lt8
9078
151 75 2866
46
6548
44
49s7
39
57 3550 45 43
152 106
I10
123
2A
15926/.
19
23 174146
17
t8flm
Ko
O
112Kr
I
157
45K2
198
167 55
lOK4
396
2A $2
lO7l3l
2102al
150
4tt 201
4s341
2lO
@
4702@
59
28
10568 437
287
678 468267
38
3637
23G.ass soils but with the Ko rcsults for uptake by ryegrass adjusted for K uptake by gass in the 6eld
$o
-q
244
323!!r .22
28.\
11
41i
88
37
8eK* re8
|1\
-27
@
q76
ta.1sg
4s
6t
74
@Kr 3e6
iet
ziq
zll iit
iii
z(;1
82
e6
e0
eoMean %
recoveries
56
78
g4
POTASSIUM
IN
SOILSFROM
THE AGDELL
EXPERIMENTRecovery of fertiliser
K
ailtledin
1981As an increase in excharyeable K (x") in
mil.
Ke in the top 0-23 cm of soil would have increased by 99, 198 and 396 ppmK
for theKl,
Kz and K4 treatments respectivelyif all
the fertilise;K
addedin
1964 had remained both in the surfac€ soil andin
anexchange-able form. Previous laboratory studies on
K
flxationby
Rothamsted soils (Wamen&
Jobnston, I 962) had suggested ihat, at best, only about 50 % of the K added to the Agdell soils woukl remain exchangeable. Increasesin Ke
dueto
individual treatments can be calculated from the resultsln Appendix TableI'
Table 6 shows the increasesin
Ks by each of the threeK
treatments appledin
1964 averaged over the six Rotation experiment treatments and the percentageK
recovered as extra Ke. Results are also givenfor
the effectof
theKz
and Ka treaiments comparedto
Kr'
On soils which were fallowedfor
tbi:ee years after
K
was apptied the percentage recovery of.aftledK,
either as an increaseover
(o
or overKr,
was reasonably consistent. About 20f
of the added K was recoveredas extra
K"
in the top 23 cm of soil ; recovery appeared to be independent of the amountof
K
added. On soils ciopped with grass during196H6, K
taken up by the grass from theK0 sub-plots was not
;;phc€d
and theK
content of the soil decreased, but on the sub' plotswiih
the otherK
treatmentsK
was rePlac€d each year. Therefore, when measuredis
an inc.ear" oue, K0, recovery ofaddedK
was larger on grass soils than on arable soils' However, when extraK"
in
Kz ancl Ka treated soils was calculated from Kein
K1 soils the recovery was about the same(2V231)
for both grass and arable soils'As K taken up by ryegrass in
pots.
Table 6 also shows the amount of extraK
taken upbv rveerass in pots-and the p€icentage recoveries both for the first crop and ttre first and siconicrops combined. From soils fallowed during 196,t-66 the ryegrass recovered about
a0%
of thi
addedK
as an increase over Ka and rather more (57 %) as an increase overirl"P".*ot
g" .""overy changed little when extraK
in the first crop was compared withextra
K
in
b6th crops iogether suggesting that most of the recently appliedK
that wasavailable to the ryegiass was
takerup
by the first crop. For the grass soils Table 6 showsthat
whenthe
ricoveriesof
addedK
were measured as increases overKo
apparent.""or"r1",
were larger than 100%in
all comparisons. This was betauseK
removed bygrarsfromtheKo-subplotsduringlg6'1-66wasnotreplaced'.Whenrecoveriesfrom
ihe Kg and
Kr
treatments were measured as increases oYer K1, about 75 % of the addedK
l"ur'.""on"."d
either by the first crop of ryegrass alone or by both crops' This valuewas ia.ger tnan ttre corresponding recovery from ttre arable- soils- because fresh
K,
equalto
G
Jmount removed by the grissin
the field, lvas added to the soil each year' More of thisu"ry.*"tty
addedK
wis
available to the ryegrass compared to theK
addedin
1964.Afparent recovery of added
K
exceeded 100f
on the grass so-ils when rneasured as anin"rJir" or".
Ko becauseK
removed by the grassfrom
theKr,
Kz
and K-a sub-plots.t".r
."pf"""d
whilst theK
taken from Ko sub'plotswas
-noi
Pl!
back' However, theK
;;;k"'blt !;"$
from Ko sub-plotsin
the felcl during 1964-66- is known; on averageit
;;a.rl
6
113 ppmLin
airldry soil.If
it
is assumed that all lhisK
would have been uuuituit" to the ryegrass in the pots,if
it
had not been removed by the grass in the field'tfr"
f
"ptut"
ty
ry-egrassfor
K0 grass subplots can be increasedty thisamo]]nt' The
i"rt
.""tio"
offiUfl
6'shows the effect of adding 113 ppm K to theK
uptake (131 ppmK)
ii,
th"nttt
".op of ryesrass and
ttre total
K
uptake (210 ppm K) by both crops of ryegrass#i
urlogtt.ri
"orre.Ld
,ulues, 244 and323
ppmK
respectively, to calculate recoveriesof
addeiK.
The percentage recoveriesof
K
addedin
the Kz and Ka treatments when comparedto
Ko6r
Kr
are now much closer,all
about751.
Aswith
other results thefact
ihat
this correction can be made suggests that both field and pot experiments were measuring much the same amounts ofK
from the same categories of soilK'
ROTHAMSTED
REPORTFOR
1973,PART
2C_omparison of soil anrl trnt experiment measureme s for the recovery of adrterl
K,
Table 6 shows that the recoveryof
addedK,
measured as an increasein
k",
was much smaller than the amount of extraK
recovered by ryegrass in pots. The increasein
Ks was onlyabout
half
that expectedfrom
the resultsof
laboratory tests on fixationof
K
by
soii
probably because
it
isdimcdt to
simulatein
a laboratory experiment conditions which occurin
the field during a period of three years. There are too few comparisons to tellwhether arable/fallow or grass crops differed
in
their effect on the retovery of addedK.
The ryegrass recovered much more
of
theK
addedin
1964 then remained as extra Kein-the soil_. The percentage recoveries were larger on the grass soils than on the arableT
fallow soils, 78
afi
57% respectively, when the increases-were measured relativeto
theKr
treatment. The percentage recoveryby
ryegrass was 2.g-3.3 times as large as theperc€ntage recovery measured as extra K€
in
the soil. The extraK
in
the ryegrass fromthe
K
appliedin
19&
was well correlated(r
:
+
0.92) with the extra exchaigeableK
in the soil.
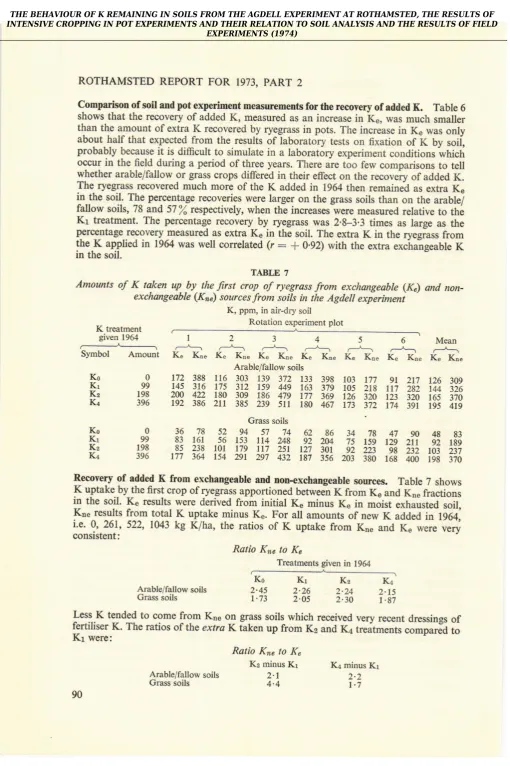
TABLE 7
Amounts
of
K
taken upby
thefirst
oop of
ryegrassfrom
exchangeable(K)
and non_ exchangeable(K")
sourcesfrom
soils in the Agdell experimentK treatment given 1964
Symbol Amount
K, ppm, in air-dry soil
Rotation expedment plot
234
K. K..
KC
K'E
K"
K"'
Arablefalow soils116
303
139372
133 39817s
312 159449
163 379180
3@
t86
479
t17
369211
385 23951r
180 467 Grass soilsKo
5
6
MeanKE
K"'
KE
K"'
KEK"'
I
K.
K,.
177 91
217 126 309218
tt7
282
144 326320
123320
16s 3703.72 174
391
195 4191847904883
159 129
2tt
92
189223 98
232
103 237380
168400
198 37052 94 s1 14 62 86
3456
153 114248
92
2U
15101 179 117
251
127301
92154 291
297 432
187 3s6 m3X{
0
172 388Kr
I
145 316Ka
198
2m
422&
396
192 386Xn03678
IG
I
83
16lKz
198
85
238Kl
396
177 3@103 105
126 173
Recovery of added
K
from exctrangeabreald
non+xchatrgeabre sources. Table 7 showsK
uptake by the first crop ofryegrass apportioned betweenK
fromK"
and Ko" fractionsin
the soil. Ke results were derivedfrom initial
Ke minus Kein
moist exhausted soil,!"e -reyfs
fromtotal
K
uptake minusK".
For all
amountsof
newK
addedin
1964,i.e.
0,261,
522, l0/.3kg
K/ha,
the ratiosof
K
uptakefrom
K,"
andK"
were very consistent:Ratio Kne to Ke
Treatmetrts given in 1964
Arable/fallow soils
Grass soils 2.451.73
Ratio
Kn.
to KeKr minus Kr
2.1
4.4
K1
Ka2.
2.242.O5
2.30K!
2.151.87
Less--K tended to come from Kne o_n gr_ass soils which teceived very recent dressings
of
fertiliser
K.
The rafios of the e.rrraK
taken up from K2 and K4 tre;tments comparJd toKr
were:Kl minus Kr 2.2 1.7