of peer-reviewed research and commentary in the population sciences published by the Max Planck Institute for Demographic Research Konrad-Zuse Str. 1, D-18057 Rostock · GERMANY www.demographic-research.org
DEMOGRAPHIC RESEARCH
VOLUME 10, ARTICLE 10, PAGES 265-286
PUBLISHED 08 JUNE 2004
www.demographic-research.org/Volumes/Vol10/10/
DOI: 10.4054/DemRes.2004.10.10
Reflexions
Fertility and family policy in Norway -
A reflection on trends and possible
connections
Marit Rønsen
Table of Contents
1 Fertility - an issue for prime ministers? 266
2 Contrasting fertility trends 266
3 Behind the Norwegian trends 270
3.1 Delayed childbearing 270
3.2 Increasing childlessness? 273
3.3 Larger variation in the number of children 273
3.4 Smaller educational differences 276
4 Family policies 278
4.1 The Norwegian setting 278
4.2 Are there policy impacts on fertility? 280
5 Family policy - necessary, but not sufficient 281
6 Acknowledgements 282
Notes 283
Reflexions
Fertility and family policy in Norway - A reflection on trends and
possible connections
Marit Rønsen1
Abstract:
Below replacement fertility in many countries has lead to a renewed public interest in policies that may encourage young people to have more children. The Nordic countries are sometimes in focus in this respect, as their fertility rates remain relatively high in spite of very high female labour force participation. The key question is therefore whether there is a connection between generous public policies that facilitate childbearing and employment, and fertility. Using Norway as example and reviewing existing research evidence I conclude that generous family policies may be necessary, but not sufficient, to sustain fertility at a reasonable level. In particular, adverse macroeconomic conditions and rising unemployment have counteracting effects, as demonstrated by falling fertility rates in Sweden in the mid-1990s.
1. Fertility - an issue for prime ministers?
When the former Norwegian Prime Minister Jens Stoltenberg gave the traditional television speech on New Year's Day 2001, his opening remarks may have taken quite a few listeners by surprise. Rather than focusing on the economy and the progress made as is usual, he began by congratulating Norwegian parents and mothers in particular, for having given birth to so many children in the last year. In hardly any other western country, he pointed out, do women have more children than in Norway. And at the same time women also get educated and take part in the labour market to a larger extent than in most other countries. According to Mr. Stoltenberg, the high fertility could be regarded as an expression of people's optimistic views on the future and the "quality" of our society. He did not elaborate on what the meant by "quality", but he did mention women's extensive ability to combine children and paid work, and presumably had in mind a society that facilitates such combination strategies.
This paper investigates the possible connection between fertility and family policy in Norway. As a point of departure, I first present a comparative picture of Norwegian fertility trends, primarily in relation to other countries in the Nordic region, but also to a couple of low-fertility countries in Europe and Asia, respectively: Spain and Japan. Then we shall go behind the Norwegian trend and look closer at some of the underlying fertility components. Finally, I shall give a brief overview of family policies in Norway, and discuss more fully the question of a possible fertility impact.
2. Contrasting fertility trends
Like many other countries, Norway experienced a "baby boom" after the Second World War. The "boom" was, however, more long-lasting than in many other countries, and at the beginning of the 1970s the total fertility rate in Norway was still as high as 2.5. In comparison, the fertility level of the other Nordic countries (except Iceland) was already below 2 children per woman (Figure 1).
0 0,5 1,0 1,5 2,0 2,5 3,0
2000 1995
1990 1985
1980 1975
1970 TFR
Norway
Sweden
Denmark Finland
Figure 1: Total fertility rate. Nordic countries. 1970-2000
Source: Recent demographic developments in Europe 2001, Council of Europe
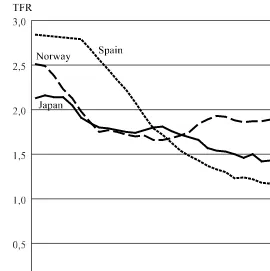
continued on into the 1990s, levelling off at about 1.2 children per woman in 1995. This in the view of most people very unacceptable low fertility is found not only in Spain, but is also the prevailing level in several other European countries like Italy, Bulgaria, the Czech Republic, Slovenia, and countries of the former Soviet republic (Georgia, Ukraine, the Russian Federation, Estonia and Latvia). There has been a similar development in Japan, as also illustrated in Figure 2. Like in the other countries, fertility in Japan has fallen more or less gradually since the early 1970s, from a reproduction level of more than two children per woman to today's level of just below 1.4 children (1.35 in 2000). Thus, the present level in Japan is not very different from the low fertility countries of today's Europe.
Figure 2: Total fertility rate. Norway, Spain and Japan. 1970-2000
Source: Recent fertility rate.Norway, Spain and Japan. 1970-2000
0,0 0,5 1,0 1,5 2,0 2,5 3,0
2000 1995
1990 1985
1980 1975
1970 TFR
Norway
Japan
3. Behind the Norwegian trends
3.1 Delayed childbearing
Female generations born after the Second World War have in several ways faced an opportunity structure that is very different from that confronted by earlier generations. Better contraceptives and easier access to abortion have enabled women to choose more freely when to give birth and how many children to have. At the same time increasing educational levels and more frequent participation in the labour market have greatly improved women's economic independence. In tandem with this, there has been a development towards greater gender equality, and a diffusion of new family formation patterns, especially cohabitation without formal marriage.
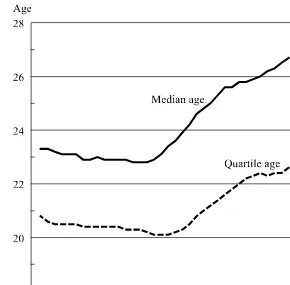
These are all factors that have contributed to the delay in motherhood that we have witnessed in Norway over the past decades. Among women born after 1935, those born around 1950 had their first child at the youngest age (Figure 3). Half of these women had become mothers by the time they turned 22.8 years, while the median age at first birth among later cohorts has risen continuously and was 26.7 years for women born in 1970. The quartile age has also increased, from 20.2 years among women born in 1950 to 22.6 years among women born in 1970. The latest figures indicate that the trend towards later childbearing still goes on, as the quartile age of the 1974 cohort is 23.8 years.
Figure 3: Median and quartile age at first birth. Norwegian women born 1935-1974
Source: Population Statistics System, Statistics Norway
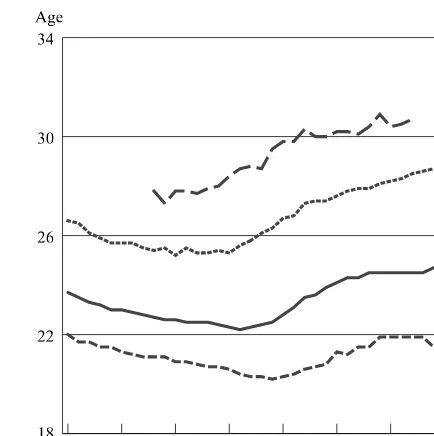
Increasing educational level among succeeding cohorts has thus clearly delayed the onset of motherhood (Note 1). In a time span of about one generation, from cohorts born in the mid 1930s to cohorts born in the mid 1960s, the proportion with just primary or lower secondary education has dwindled from more than 40 to less than 10 per cent, while there has been a corresponding increase in the proportion with education at higher levels (Table 1). The groups with a lower or higher university degree have grown most, but the proportion at the highest level (more than four years of university studies) still only comprises 5 per cent of women born in 1965.
18 20 22 24 26 28
Birth cohort Age
Quartile age Median age
Figure 4: Median age at first birth by educational level. Norwegian women born 1935-1974
Source: Population Statistics System and Educational Statistics Systems, Statistics Norway
Table 1: Completed education among female cohorts born 1935 to 1965
Birth cohort Proportion (per cent) with completed education at: Primary or lower
secondary (1-9 years)
Upper secondary (10-12 years)
University, lower degree (13-16 years)
University, higher degree
(17-20 years)
1935 44.1 43.6 11.1 1.2
1940 34.2 48.4 15.7 1.7
1945 25.2 53.3 19.2 2.3
1950 19.7 54.4 23.0 2.9
1955 14.7 55.2 26.9 3.2
1960 10.2 58.7 27.1 4.0
1965 7.5 59.3 28.2 5.0
Primary or lower secondary education (1-9 years) Upper secondary education (10-12 years) University education - lower degree (13-16 years) University education - higher degree (17-20 years) Age
18 22 26 30 34
1975 1965
1955 1945
1935
3.2 Increasing childlessness?
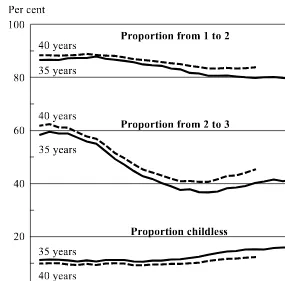
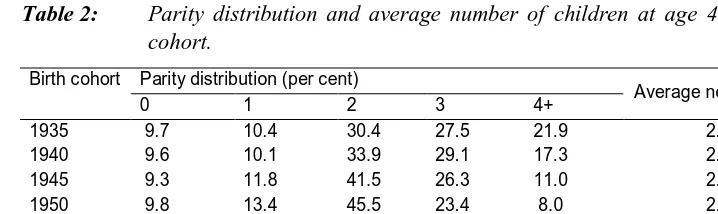
When women postpone childbirth to higher and higher ages, one obvious question is whether this will lead to an increasing number of childless women. What has happened among Norwegian cohorts? Among women who started the trend of delayed childbearing, cohorts born in the early 1950s, the proportion that has remained childless is about ten per cent, which is very low by international standards. For younger cohorts that are still in the fertile age range it is too early to draw a final conclusion about childlessness. However, at age 40 the proportion with no children had increased from 9.8 per cent in the 1950 cohort to 12.6 in the 1960 cohort (Table 2), while at age 35, the childless proportion in the 1950 cohort was 11.6 compared to 16.5 in the 1963 cohort (Lappegård 2000). Even if the younger cohorts catch up on some of the fertility lag relative to their older counterparts, it seems highly unlikely that they will complete their fertile period with childlessness around ten per cent, as in the older cohorts. The evidence so far thus points to a small increase in childlessness.
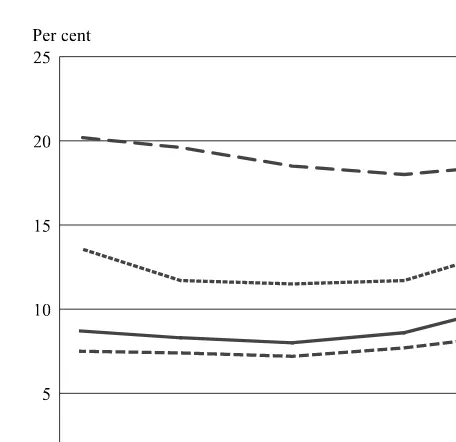
The proportion with no children clearly increases with educational level (Figure 5). Among women born in 1954-1958, 19 per cent in the highest educational group and 9 per cent in the lowest educational group were childless at age 40. The contrasting development across cohorts is, however, interesting. The only group with a falling trend in childlessness is the highest educational group, while the other educational groups exhibit either a relatively stable or a slight upward trend. There is thus a slight convergence in childlessness between educational groups in the younger cohorts. There may be several reasons for this, but one explanation often encountered is that the expansion of family policies since the late 1980s has made it increasingly easier for labour market oriented women to combine children and paid work. Besides, women with an upper university exam constituted a very small and select group in the older cohorts, but as the proportion of women with higher education has grown, they have become less select over the years. Hence, their choice to have or not to have a child may have become more similar to that of other women.
3.3 Larger variation in the number of children
towards rising proportions that proceeds from two to three children. At age 35, for example, the proportion was 37 per cent among mothers born in 1953 as compared to 41 per cent among mothers born ten years later, in 1963.
Figure 5: Childlessness by educational level. Norwegian women born 1935-1958
Source: Population Statistics System and educational Statistics Systems, Statistics Norway
Primary or lower secondary education (1-9 years) Upper secondary education (10-12 years) University education - lower degree (13-16 years) University education - higher degree (17-20 years) Per cent
0 5 10 15 20 25
1954-58 1949-53
1944-48 1939-43
1935-38
Figure 6: Proportion childless and the proportion that has another child by age 35 and 40, by initial number of children. Norwegian women born 1935-1963
Source: Population Statistics System, Statistics Norway
Among the pre-war cohorts almost half the women had at least three children at age 40 (Table 2). The proportion fell, however, quite rapidly for the post-war birth cohorts, but among women born since 1950 it has stabilised at about 30 per cent. Together with a declining proportion with two children, a rising proportion with only one child and increasing childlessness this all points to a larger variation in the number of children among younger cohorts.
The average number of children at age 40 declined rapidly among cohorts born before 1950, from 2.41 in the 1935 cohort to 2.06 in the 1950 cohort, and has stabilised
0 20 40 60 80 100
Birth cohort Per cent
Proportion from 1 to 2 40 years
35 years
Proportion from 2 to 3
Proportion childless 40 years
40 years 35 years
35 years
2.05 children (Sørli 2000). Hence, in spite of the persistent pattern of delayed childbearing, Norwegian women still seem to catch up on most of the fertility lag at younger ages relative to cohorts that are born 5-10 years before.
Table 2: Parity distribution and average number of children at age 40 by birth cohort.
Birth cohort Parity distribution (per cent)
0 1 2 3 4+ Average no of children
1935 9.7 10.4 30.4 27.5 21.9 2.41
1940 9.6 10.1 33.9 29.1 17.3 2.34
1945 9.3 11.8 41.5 26.3 11.0 2.18
1950 9.8 13.4 45.5 23.4 8.0 2.06
1955 11.7 14.6 42.1 23.9 7.7 2.02
1960 12.6 14.1 39.2 22.5 8.6 2.03
Source: Population Statistics System, Statistics Norway.
3.4 Smaller educational differences
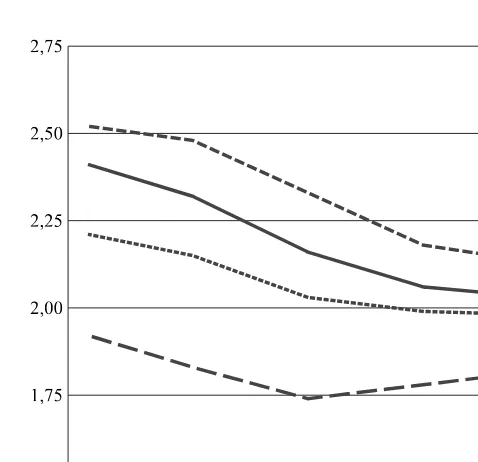
So far we have seen that education is an important determinant both for the timing of motherhood and for the proportion that remain childless. Not surprisingly, it also affects a woman's total number of children. Women with low education have more children than women with higher education, but the difference turns out to be smaller than what might be expected based on the vast difference in the timing of first birth. Women with higher education close some of the fertility gap relative to women with lower education later in their fertile period. Further, the difference in the total number of children at age 40 between women with different educational levels was larger in the older cohorts than in more recent cohorts (Figure 7). The declining dissimilarity is mainly a result of a larger reduction in the number of children in the lowest educational group. In fact, there has been a slight increase in the average number of children among women with an upper university education born after the Second World War. A closer study of the distribution of the number of children reveals that this reflects a decreasing proportion with only one child, as well as rising proportions that have a second and especially a third child (Lappegård 1999).
the effect remained even when controlling for other fertility determinants (Note 2). Further evidence in the same direction has also been found in Swedish analyses, both for second and third birth rates (see e.g. Hoem 1990, Oláh 1996 and Berinde 1999), as well as for second birth rates in Norway (Rønsen 2004). As suggested by Oláh, this may indicate that the extensive family policy programs of the Nordic countries have been successful in reducing the fertility costs for well-educated women.
Figure 7: Average number of children at age 40 by educational level. Norwegian women born 1935-1958
Source: Population Statistics System and Educational Statistics System, Statistics Norway
1,50 1,75 2,00 2,25 2,50 2,75
1954-58 1949-53
1944-48 1939-43
1935-38
Primary or lower secondary education (1-9 years) Upper secondary education (10-12 years) University education - lower degree (13-16 years) University education - higher degree (17-20 years)
In recent Nordic fertility research, attention has not only been given to level of education, but also to field of education. An interesting finding is that field of education may be an even stronger determinant of fertility than level of education. For example, for Norway Lappegård (2001) finds that childlessness is almost as low among nurses and teachers with a university degree as among women with no education beyond secondary school, and having become mothers, the former groups have a higher expected number of children at age 40 than the latter. A similar pattern has also been observed in Sweden (see e.g. Hoem 1994, Stanfors and Svensson 1999). One reason for the relatively high fertility among nurses and teachers is probably that this is a group that is both family-oriented and work-oriented and thus has strong preferences in both directions. A large public sector with ample job opportunities and flexible part-time arrangements may have been conducive for the realisation of the dual strategies implied by such preferences (Ellingsæter and Rønsen 1996). Another and related reason is that workers within these sectors may have little to lose from employment breaks in terms of future career opportunities and earnings potential, mainly due to the high proportion of female workers and a relatively flat income profile over the working life.
4. Family policies
4.1 The Norwegian setting
The Nordic welfare states have a long tradition of extensive social policies directed at the family. These policies have, however, not primarily been motivated by pro-natalist objectives, but rather by gender equality ideologies and concern for the general well being of children and their families. The programs with greatest implications for the cost of a child are no doubt the statutory and universal parental leave program and the extended provision of publicly approved and subsidised day care centres.
most working mothers. Almost another decade passed before there were further extensions in the benefit period, but since 1987 it has been prolonged several times, resulting in a maximum leave of 52 weeks with 80 per cent wage compensation or 42 weeks with full pay in 1993. These are also the present arrangements (2004).
Fathers may share all of the leave except for three weeks before and six weeks after birth that are reserved for the mother. In addition, fathers are entitled to two weeks of unpaid paternity leave immediately after birth. Traditionally, most fathers have taken the two weeks of paternity leave, but very few have used the opportunity to share parts of the common parental leave period. To encourage the involvement of both parents in child care, the 1993 amendment reserved four weeks of the extended leave for the father - the so called "daddy quota". These weeks are generally not transferable to the mother, and are lost if the father does not make use of them. Hence there is a strong incentive for fathers to take the leave, and judging by experience, the reform has been a success. In 1996, three years after introduction, almost 80 per cent of entitled fathers used the "daddy quota", and furthermore, the proportion of fathers who shared some of the common parental leave period had risen from four to 12 percent (Brandth and Jensberg 1998).
In August 1998, a cash benefit to parents who do not use publicly subsidised childcare was introduced, and since January 1999 all children aged 1-2 years have been included in the program. The benefit is a monthly, tax-free flat rate payment that, at introduction, was roughly equivalent to the state subsidy for a place in a day-care centre. Today (2004) the monthly amount is NOK 3657 (approx. EUR 450). To be eligible for the full benefit, the child must not attend a publicly funded day-care centre on a full-time basis (more than 32 hours per week). Parents of children that attend part time may receive a reduced benefit (see Rønsen 2001 for further details). The new scheme is very popular in the sense that a large majority of parents with children in the eligible age group claims the benefit. In the spring of 1999, about four months after the scheme was fully established, parents of 75 percent of 1-2 year olds received the benefit (Reppen and Rønning 1999), and this proportion has remained more or less constant since. However, only five per cent of the recipients are fathers.
children. A large part of the private day care centres also receives subsidies from the local municipality.
The main principle of the financing of day-care centres is that the running costs should be shared between the state, the municipalities and the parents (Ministry of Children and Family Affairs 1988). The intentions were for the state to pay 40 percent of the cost, while the remaining 60 percent should be divided equally between parents and municipalities. Because of a fast expansion of private centres, the average municipality share has, however, been lower and the average parental share higher. In 1994, for example, parents paid 44,5 percent of the cost in private day-care centres and 28,8 percent in public centres (Ministry of Children and Family Affairs 1996). There is no central regulation of the parental fee. The local owner, i.e. either the municipality or the private enterprise, is free to set its own price. In about half the public centres there is a scale of fees dependent on parents' income, while in private centres there is usually a fixed fee, independent of income. However, both public and private centres normally offer a siblings discount. Hence, there is substantial variation in the parental price. In 1998, the average parental payment for full-time attendance in large cities and suburbs was about NOK 3500 (about EUR 430) per month in private centres and slightly less in public centres (Statistics Norway 1998).
Prior to the 1990s, Norwegian parental leave and child care policies lagged behind the policies of most other Nordic countries. Sweden in particular was a forerunner with a parental leave of one year as early as 1980, extended to 15 months in 1989. The Swedish program has also been more flexible with possibilities to take leave on a part time basis or in several spells before the child is eight years old (see Rønsen and Sundström 2002 for further details). Further, the Swedish leave program has a unique feature that encourages a closer spacing of births nicknamed the "speed premium" (Hoem 1993). This is a regulation whereby mothers may maintain the same benefit level as with the previous child if she has another child within 30 months (before 1986: 24 months), even if she does not return to work between the births.
4.2 Are there policy impacts on fertility?
upturns and downturns in the economy. To control for the bias of other influences, one may analyse the time series using multivariate analysis techniques. This is for example the approach of Gauthier and Hatzius (1997) who analyse the total fertility rate from 1970-1990 based on aggregate data from 22 industrialised countries, using a model that includes indicators of maternity leave (duration and benefits-to-earnings ratio) and child benefits in addition to other fertility determinants. Their results suggest that fertility may have been positively related to child benefits, while there were no significant effects of maternity leave.
A remaining problem with aggregate data is that the sum of individual behaviour may not necessarily reflect average individual behaviour. Hence, individual level data is a better source for impact analyses. Unfortunately, such data have been in short supply, but recently a good source has become available through similar Family and Fertility Surveys that have been conducted in about 20 industrialised countries since the late 1980s. In analyses based on the Swedish and Norwegian surveys several authors have addressed the role of public policies, and the results so far seem to indicate that there is a certain impact. Most evident is probably the effect of the so called "speed premium" in Sweden (see above), which as expected, has encouraged mothers to have their second and third child sooner (see e.g. Oláh 1996, Berinde 1999). This further corroborates the findings of Hoem (1993) and Andersson (1999) based on individual level register data. An interesting additional finding from Sweden by Oláh is that women are more likely to have a second baby if the father took parental leave with the first child, suggesting that features that encourage an active participation from the father in child care may stimulate fertility.
Evidence based on individual level Norwegian data indicates that there may be a slight positive effect of increasing day-care supply on third births, but the effect is most pronounced at low day-care levels (Kravdal 1996). Interestingly, well-educated women seem to have responded most strongly to the day-care expansion. Further, in a comparative analysis of Finland and Norway, Rønsen 2004 also finds some support for the hypothesis that the extension of parental leave may have stimulated fertility. The effect is most significant for Finland that had more extensions during the analysis period (about 1960-1990), and is mainly limited to the probability of having a second or third birth.
5. Family policy - necessary, but not sufficient
to corroborate. As we have seen, recent analyses of the Nordic countries lend some support in this direction, even though the estimated effects are not very large. However, as demonstrated by the Swedish trend in the 1990s, a generous family policy program is no guarantee for a high fertility level. In the early 1990s, Sweden experienced a period of slack in the economy that soon led to a sharp rise in unemployment, and young people and people with low education were hit especially hard. For the first time ever, there were also cutbacks in the economic support to families. Soon after fertility declined, from 2.1 children per women in 1992 to about 1.5 in 1997. In a recent analysis of the Swedish trend during the 1990s, Hoem 2000 finds that the fertility decline has been particularly strong among young women and women with low education, the very same groups that faced the biggest problems in the labour market. Thus, economic cycles and economic prospects also clearly have important effects on fertility, and the observed negative effect of rising unemployment is probably both a result of poorer income prospects for the present and, possibly even more important, a greater feeling of insecurity about the future (Note 4).
On the whole, this analysis supports the views expressed by former Norwegian Prime Minister, Mr. Stoltenberg, in his New Year speech 2001 that both the "quality" of the society and people's outlook on the future are important fertility determinants. Women of today are educated and enter the labour market on an equal footing with men and also expect to participate in the society on equal terms. Based on the Nordic experience, I believe that children will still be part of the plans of women as well as of men if the society is prepared to share a decent part of the responsibilities and the costs implied. This includes both policies that make it possible for women to combine children and paid work and measures that encourage gender equality and a greater involvement of fathers in childcare. Possibly, low fertility countries with a scope for great improvement in these areas may have the most to gain from such policies, and especially if they at the same time are able, or lucky enough, to create a stable economy and optimistic prospects for the future.
6. Acknowledgements
Notes
1. The causal relationship between education and the timing of fertility is, however, less clear-cut than what can be ascertained based on information on completed education from present-day statistics. For example, women with low education may have given birth early because they have completed their education at a young age, but early childbearing in this group may also have prevented their further education. The causal direction may thus run both ways. To fully address this issue one needs to model fertility dynamics within a multivariate framework and have access to complete life histories on both fertility and education, which are rarely available. For a thorough and recent discussion of these and related problems, see e.g. Kravdal 2004.
2. In a more recent analysis of Norwegian register data, Kravdal (2001) finds positive educational effects on second as well as third births when each parity transition is analysed separately. However, if first, second and third births are modelled jointly and controlled for unobserved heterogeneity, negative effects of educational level appear. The effects are less clearly negative for women born in the 1950s than for older cohorts. Among younger cohorts, educational differentials in completed fertility are quite small and stem to a large extent from a higher proportion of childlessness among the well-educated.
3. The coverage rate is defined as the proportion of pre-school children with a subsidised place.
References
Andersson G (1999): Childbearing trends in Sweden 1961-1997. European Journal of Population 15: 1-24.
Berinde D (1999): Pathways to a Third Child in Sweden. European Journal of Population 15: 349-378.
Brandth B and J Jensberg (1998): Suksess for fedrekvoten (Success for the father's quota), Velferd No. 4
Ellingsæter AL and M Rønsen (1996): The Dual Strategy: Motherhood and the Work Contract in Scandinavia. European Journal of Population 12: 239-260.
Gauthier AH and J Hatzius (1997): Family benefits and fertility: An econometric analysis. Population Studies 51: 295-306.
Hoem B (1990): Alla goda ting er tre? Tredjebarnsfödslar bland svenska kvinnar födda 1938-1950 (All good things are three? Third births among Swedish women born 1938-1950). Stockholm Research Reports in Demography No. 59, University of Stockholm.
Hoem, B. (1994): Lärare föder flere barn (Teachers give birth to more children), Välfärdsbulletinen No.3: 17-19.
Hoem B (2000): Utan jobb - inga barn? Fruktsamhetsutvecklingen under 1990-tallet. (Withou job - no children? Fertility trends during the 1990s). SOU 2000:37, Socialdepartementet, Stockholm.
Hoem JM (1993): Public policy as the fuel of fertility. Acta Sociologica 36: 19-31.
Kojima H (2001): Determinants of Japanese Attitudes toward Fertility and Policy Interventions: A Comparative Analysis of the 1990/1995 IPP Surveys and JGSS-2000. Paper presented at the 2001 Second Annual Meeting of the Population Association of Korea, December 1, 2001, Seoul, Korea.
Kravdal Ø (1992): The Emergence of a Positive Relation between Education and Third Birth Rates in Norway with Supportive Evidence from the United States. Population Studies 46: 459-475.
Kravdal Ø (2001): The High Fertility of College Educated Women in Norway: An Artefact of the Separate Modelling of Each Parity Transition. Demographic Research 5:185-216. Available at http://www.demographic-research.org/Volumes/Vol5/6.
Kravdal Ø (2004): An Illustration of the Problems Caused by Incomplete Education Histories in Fertility Analyses. Demographic Research, Special Collection 3: Article 6,133-154. Available at http://www.demographic-research.org/special/3.
Lappegård T (1999): Akademikere får også barn, bare senere (Academics also have children, only later), Samfunnsspeilet 5/1999, Statistics Norway
Lappegård T (2000): New fertility trends in Norway. Demographic Research Vol. 2. Available at www.demographic-research.org/Volumes/Vol2/3
Lappegård T (2001): Valg av utdanning - valg av livsløp? (Choice of education - choice of life course?). Tidsskrift for samfunnsforskning, No. 3, 2001, 409-435.
Ministry of Children and Family Affairs (1988): Barnehager mot år 2000 (Day-care centres towards year 2000). Report to the Storting No. 8 (1987-88).
Ministry of Children and Family Affairs (1996): Offentlige overføringer til barnefamiliene (Public transfers to families with children). NOU 1996:13.
Oláh L Sz. (1996): The impact of Public Policies on the Second-Birth Rates in Sweden: a Gender Perspective. Stockholm Research Reports in Demography No.98.
Reppen HK and Rønning E (1999): Barnefamiliers tilsynsordninger, yrkesdeltakelse og bruk av kontantstøtte våren 1999. (Child care arrangements, labour force participation and the use of cash-for-care benefits in the spring, 1999). Reports 1999/27, Statistics Norway.
Rønsen M (2001): Market work, childcare and the division of household labour. Adaptations of Norwegian mothers before and after the cash-for-care reform. Reports 2001/13, Statistics Norway.
Rønsen M (2004): Fertility and public policies - evidence from Norway and Finland. Demographic Research 10, 141-170. Available at http://www.demographic-research.org/Volumes/Vol10/6.
Seminar on Women in the Labour Market in Changing Economies, Rome, 22-24 September.
Statistics Norway (1998): Ukens Statistikk (Weekly Statistics 45/98).
Statistics Norway (2003): www.ssb.no/English/subjects/04/02/10/barnehager_en/
Sørli K (2000): Fødselstallsutviklingen - etter nok et tiår (The fertility trend - after another decade). Regionale trender 2/2000, NIBR, Oslo.