Frequency Dependency of Laboratory Measurement of
Maximum Shear Wave Velocity by Bender Elements
Sara Ataii1, Abbas Ghalandarzadeh2, Majid Moradi2
1 M.Sc. of Geotechnical Engineering,College of Civil Engineering, University of Tehran, Tehran, Iran.
2 Associate Professor, College of Civil Engineering, University of Tehran, Tehran, Iran.
Corresponding author’s Email: [email protected]
ABSTRACT:
Maximum shear wave velocity is one of the most important dynamic parameters of soils which contributes in estimating the dynamic behaviour of soils through the maximum shear modulus. There are different methods for measuring shear wave velocity either in laboratory or in the field. One of the laboratory methods that recently has become popular due to its simplicity, is use of Bender Elements in soil samples. Contrary to its simplicity, it has several uncertainties in its data interpretation. Frequency at which the shear wave velocity is measured is one of the effective parameters that significantly affects the clearance of received wave. This article presents results from a laboratory investigation into the shear wave velocity measurement of remolded specimens of Firoozkooh sand. Specimens were subjected to 13 different levels of frequency and 11 different levels of confining pressure. Results shows that by increasing the confining pressure, the frequency at which the received wave has the best clearance, increases. It also shows that frequency dependence of soils increases by increasing the confining pressure.
Key words:Shear Wave Velocity, Frequency, Bender Element, Triaxial Apparatus.
O RIGINA L ART IC L E R ec ei v ed 2 1 A pr . 2 0 1 8 A cc ep te d 1 4 S ep . 2 0 1 8
1- Introduction
By generating a shear wave in the transmitter Bender Element and trace it in the receiver one, it is possible to measure shear wave velocity in soil specimen. Shear wave velocity is derived by following equation:
Vs=L/t (2)
Where L=travel length of the shear wave and [7], [11] according to other investigations [7], [11], it is better to assume it as the tip to tip distance between Bender Elements; and t=travel time of the shear wave and it is equal with time shift between transmitted and received signals. One of the most important obstacle in data interpreting in bender element tests is adequately detecting the time travel. In this study, shear wave velocity of dry Firoozkooh sand, at 13 levels of frequency (3-15 kHz) and 11 different stages of confining stress (10,20,30,40,50,100,150,200,300,400 and 500 kPa) is measured by means of Bender Element equipment which is placed in triaxial apparatus. Maximum shear modulus (Gmax) based on wave propagation theory in elastic media is evaluated as well. The effects of confining stress and frequency are carefully analyzed.
2- Material properties
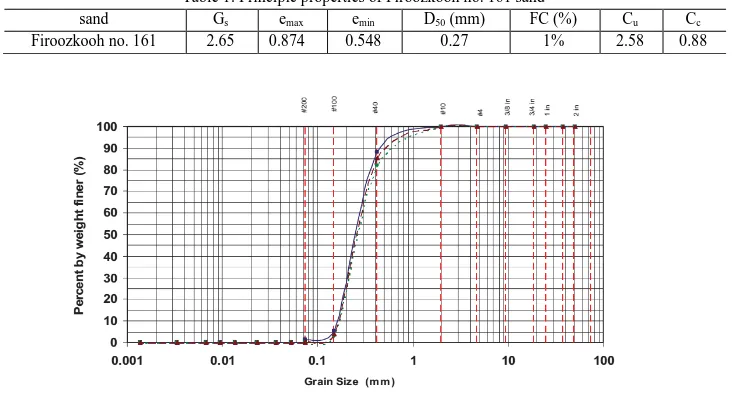
Firoozkooh no. 161 crushed silica sand in dry condition, is used in this study. It has angular grains with yellow gold colour and uniform grain size distribution. The summery of its principle properties are shown in Table 1. The grain size distribution of this sand and also microscopic photos of its particles are shown in Fig. 1 and Fig. 2.
Table 1: Principle properties of Firoozkooh no. 161 sand
sand Gs emax emin D50 (mm) FC (%) Cu Cc
Firoozkooh no. 161 2.65 0.874 0.548 0.27 1% 2.58 0.88
Fig.2. Microscopic picture of Firoozkooh no. 161 particles
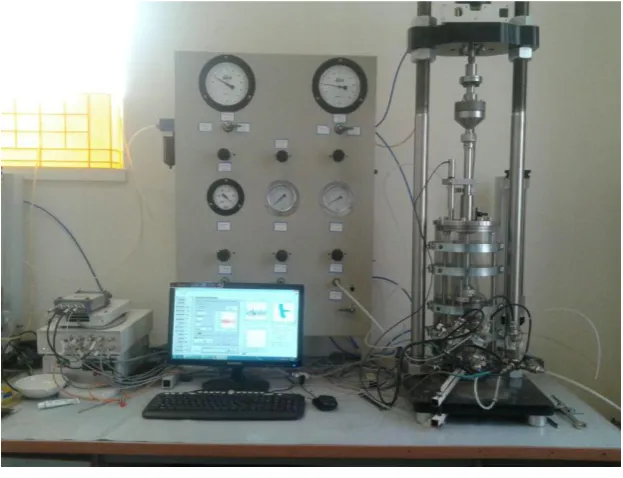
3- Test equipment
4- Test procedure
The tests were performed in a conventional triaxial apparatus, along with Bender Elements. The transmitter element was mounted in the pedestal and the receiver on the top cap. Cylindrical specimens with dimensions of 50 mm in diameter and 100 mm in height, were prepared using a dry vibration method. Then 4 levels of differential vacuum pressure (10, 20, 30, and 40 kPa) were applied to stabilize the specimen and also to measure the shear wave velocity in low confining stresses. After that, step by step, further 7 levels of isotropic confining stresses (50, 100, 150, 200, 300, 400, and 500 kPa), were applied to each specimen. In each 11 levels of confining stresses (4 levels in vacuum pressure and 7 levels in confining pressure), shear wave velocity was measured by means of transmitting sine waves in 13 different levels of frequencies (3-15 kHz) in the transmitter element and receiving it in the other one.
5- Results and discussion
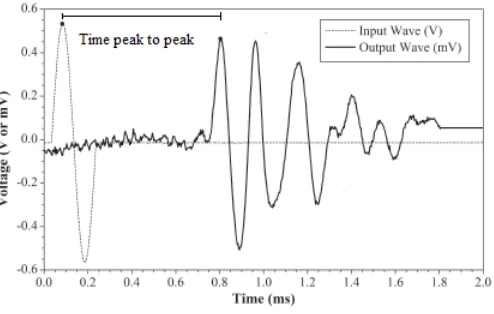
As it has been mentioned before, one of the most important obstacles in data interpreting in bender element tests is detecting the time travel adequately. There are different methods of interpretation for Bender Element test’s data such as first time of arrival, first peak to peak and cross-correlation method. We used first peak to peak method to obtain time travel of shear wave that has been generated and also received by Bender Elements. In the first peak to peak method, the travel time is obtained by measuring the time distance between the first peak of the transmitted signal and the first peak of the received signal, neglecting the initial distorted part of the curve. Figure 4. Schematically shows peak to peak method of measuring travel time in Bender Element tests.
Fig. 4. Peak to peak method of measuring travel time in Bender Element test
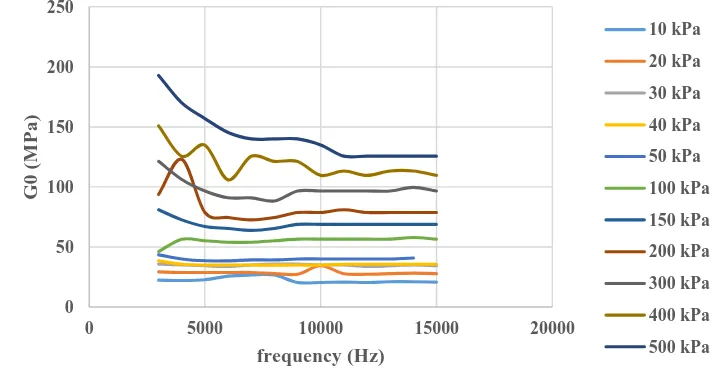
The results are presented in Figure 5. for a dry specimen of Firoozkooh sand with relative density of 47% which has been applied to 11 levels of confining stress and in each levels of confining stress, it has been tested in 13 different levels of frequency for transmitted sinusoidal signal. The results clearly indicate that maximum shear modulus will increase with increasing the confining stress. It also shows that the frequency dependence will increase with increasing the confining stress of the specimen.
clearance, will increase. The result is logical, as with increasing the confining stress, the specimen will became stiffer and its intrinsic frequency will increase and we know that as much as the frequency of the transmitted signal is near to the intrinsic frequency of the specimen, the clearance of the received signal will be higher. Figure 6. Shows the clearance of received signal in different frequencies for 3 different confining stress.
Fig. 5. A comparison of maximum shear wave velocity in different levels of confining stress and frequency
Fig. 6. Frequency of clearance differing of with confining stress
0 50 100 150 200 250
0 5000 10000 15000 20000
G
0
(
M
P
a
)
frequency (Hz)
10 kPa
20 kPa
30 kPa
40 kPa
50 kPa
100 kPa
150 kPa
200 kPa
300 kPa
400 kPa
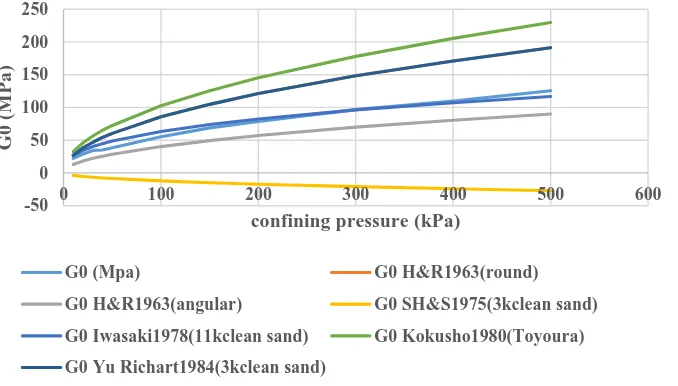
Figure 7. Illustrates the results of controlling test’s data with different empirical equations. As it shows, the test results have maximum conformity with the equations that is suggested by [13] for 11 kinds of clean sand.
Table 2: Values of coefficients for empirical equation presented by different investigators
Fig. 7. A comparison of test results with different empirical equations
6- Conclusion
In this study, maximum shear modulus of dry samples of Firoozkooh sand in conventional triaxial apparatus in conjunction with Bender Element devices was investigated. Test were performed on 11 different levels of confining stress and 13 different levels of frequency. Time peak to peak method was used to obtain the time travel of transmitted signal of Bender Element. Maximum shear modulus which has been derived from these test was compared with the estimated result from different empirical equations. The outcomes of this study are summarized as follows:
(1) It is obviously derived from the results that with increasing the confining stress, the maximum shear modulus of the specimens will increase too.
(2) The frequency dependence of maximum shear wave velocity will increase with increasing the confining stress.
-50 0 50 100 150 200 250
0 100 200 300 400 500 600
G
0
(
M
P
a
)
confining pressure (kPa)
G0 (Mpa) G0 H&R1963(round)
G0 H&R1963(angular) G0 SH&S1975(3kclean sand)
G0 Iwasaki1978(11kclean sand) G0 Kokusho1980(Toyoura)
(3) There is a limited range of frequency for each level of confining stress in which the received signal will be have maximum clearance. As the confining stress increase, this limited range of frequency will be located in higher frequencies. It means that a specimen with higher confining stress will have the clearest received signal in higher frequencies. The results are logical. As we know that with increasing the confining stress of a specimen, it will become stiffer and so its intrinsic frequency will increase too. Furthermore, as much as the frequency of the transmitted signal is near the intrinsic frequency of the specimen, the received signal will have more clearance.
(4) As the results are controlled through different empirical equations, it is obvious that the trend of the results are similar and also the results have the most conformity with the coefficients of empirical equation which are suggested by Iwasaki 1978.
7- References
1. Shirley, D. J. and Hampton, L. D., (1978). Shear-wave measurements in laboratory sediments, Journal of Acoustic, Soc. Am., Vol. 63, No. 2, 607– 613.
2. Jamiolkowski, M., Lancellotta, R. and Lo Presti, D., (1995). Remarks on the stiffness at small strains of six Italian clays, in Pre-failure deformation of geomaterials. Proceedings of the international symposium, 12-14 September, SAPPORO, JAPAN. 2 Vols.
3. Lee, C., Truong, Q. H. and Lee, J. S., (2010). Cementation and bond degradation of rubber-sand mixtures, Canadian Geotechnical Journal, Vol.47, No.7, 763–774.
4. Duttine, Benedetto, A. H. D., Bang, D. P. V. and Ezaoui, A., (2007). Anisotropic small strain elastic properties of sands and mixture of sand-clay measured by dynamic and static methods, Soils and Foundations, Vol.47, No.3, 457–472.
5. Dyvik, R. and Madshus, C., (1985). Lab Measurements of Gmax Using Bender Elements, in Advances in the art of testing soils under cyclic conditions, 186–196.
6. Bates, C., (1989). Dynamic soil property measurements during triaxial testing, Géotechnique, Vol.39, No.4, 12-20.
7. Viggiani, G. and Atkinson, J., (1995). Stiffness of fine-grained soil at very small strains, Géotechnique, Vol.45, No.2, 249–265.
8. Jovičić, V. Coop, M. and Simić, M., (1996). Objective criteria for determining G max from bender element tests, Geotechnique, Vol.46, No.2, 357– 362.
9. Nash, D. F. D., Pennington, S. and Lings, M. L., (2001). Horizontally mounted bender elements for measuring anisotropic shear moduli in triaxial clay specimens.
10. Kramer, S. L., (1996). Geotechnical earthquake engineering. Pearson Education India.
11. Lee, J. S. and Santamarina, J. C., (2005). Bender elements: performance and signal interpretation, Journal of Geotechnical and Geoenvironmental Engineering, Vol.131, No.9, 1063–1070.
12. Kokusho, T., (1987). In-situ dynamic soil properties and their evaluations, in Proc. 8th Asian Regional Conference on Soil Mechanics and Foundation Engineering.