University of New Orleans University of New Orleans
ScholarWorks@UNO
ScholarWorks@UNO
University of New Orleans Theses and
Dissertations Dissertations and Theses
Fall 12-17-2011
Validation of Seaplane Impact Load Theory and Structural
Validation of Seaplane Impact Load Theory and Structural
Analysis of the Martin 270
Analysis of the Martin 270
Carrie SellFollow this and additional works at: https://scholarworks.uno.edu/td Part of the Other Engineering Commons
Recommended Citation Recommended Citation
Sell, Carrie, "Validation of Seaplane Impact Load Theory and Structural Analysis of the Martin 270" (2011). University of New Orleans Theses and Dissertations. 1365.
https://scholarworks.uno.edu/td/1365
This Thesis is protected by copyright and/or related rights. It has been brought to you by ScholarWorks@UNO with permission from the rights-holder(s). You are free to use this Thesis in any way that is permitted by the copyright and related rights legislation that applies to your use. For other uses you need to obtain permission from the rights-holder(s) directly, unless additional rights are indicated by a Creative Commons license in the record and/or on the work itself.
Validation of Seaplane Impact Load Theory and Structural Analysis of the Martin 270
A Thesis
Submitted to the Graduate Faculty of the University of New Orleans
in partial fulfillment of the requirements for the degree of
Masters of Science in
Engineering
Naval Architecture and Marine Engineering
by
Carrie Sell
B.S., University of New Orleans, 2010
ii
A
CKNOWLEDGEMENTSSeaplanes have been a passion of mine ever since I read “Where is Joe Merchant?” by Jimmy Buffett. Throughout the research process of my thesis, I have learned that there is still a small niche in the marine community that shares a great passion for flying boats. These individuals were the fuel for my study and their desire to help only aided in my desire to work.
I would like to first thank those who inspired me with their passion for seaplanes. Dr. William Vorus introduced me to the importance of seaplanes in Naval Architecture. His enthusiasm and encouragement gave me the stepping stones to take on this project. Dr. Colen Kennell taught me a tremendous amount about seaplanes and even after my research stage with the Navy, he continued to support my research. Bruce Barth reached out to me with his knowledge and friendship. His expertise and stories about Martin seaplanes gave me an appreciation for the men, including Barth, who served in the Navy on these amazing planes.
The Navy was a key contributor to my project, and without its support, this project would not have been possible. Steve Ouimette was the first person to actually support my research and through the Center for Innovation in Ship Design, supplied me with numerous contacts and resources. Ed Devine also supported my work, gave me direction on how to start my project and was always there to help me. The most important gesture I received from all of the Naval Surface Warfare Center Carderock Division employees I worked with was their continued support long after I had officially ended my summer internship.
Equally important is the support I received from the professors in the School of Naval
Architecture and Marine Engineering. Each and every one of them have been the key reason I stayed at the University of New Orleans to continue my education. I will always admire and appreciate their dedication and enthusiasm for teaching. I’d especially like to thank my thesis advisor, Dr. Brandon Taravella, for always making time for me when I needed help and advising me on my project. My classmate and teacher Chris McKesson has supported me not only as an advisor but as a friend in times when I needed reassurance. Also, Dr. Thomas Dobie advised me with his practical knowledge on flight from his experience flying in WWII. Last but not least, I’d like to thank my thesis board, including Dr. Lothar Birk and Dr. Pingsha Dong, who always displayed a willingness to help me over hurdles with my research.
iii
T
ABLE OFC
ONTENTSACKNOWLEDGEMENTS ...ii
LIST OF FIGURES ... iv
LIST OF TABLES ... vii
TABLE OF SYMBOLS ... viii
I. ABSTRACT ... xiii
II. INTRODUCTION ... 1
III. INTRODUCTION TO SEAPLANES ... 2
IV. IMPORTANT CONSIDERATIONS USING IMPACT THEORY ... 5
A. PLANING DATA ... 5
B. MODEL TEST RESULTS ... 5
C. RIGIDITY ... 5
D. 2-DIMENSIONAL VERSUS 3-DIMENSIONAL... 6
E. CHINE IMMERSION ... 6
V. LITERATURE REVIEW ... 6
A. VON KARMAN AND WATTENDORF (1929) ... 6
B. WAGNER (1932) ... 7
C. BLUNDELL AND JONES (1938) ... 9
D. MAYO (1945) ... 12
E. CREWE (1946)... 14
F. BENSCOTER (1947) ... 20
G. HAMILTON (1955) ... 25
H. AREAS OF FURTHER STUDY ... 33
I. IMPACT THEORY TRADE-OFF STUDY ... 34
VI. HULLFORM DESCRIPTION ... 35
A. GENERAL HULLFORM PARAMETERS ... 35
B. UNIQUE ATTRIBUTES ... 35
C. GEOMETRY ... 37
iv
A. DROP TEST ... 41
1. MODEL DESCRIPTION ... 41
2. STRUCTURAL DESIGN ... 42
3. TEST OUTLINE ... 45
4. INSTRUMENTATION ... 45
5. LOADING RESULTS ... 46
6. STRUCTURAL REACTION... 50
B. FLIGHT TEST ... 50
1. MODEL DESCRIPTION ... 50
2. TEST OUTLINE ... 50
3. INSTRUMENTATION ... 53
4. STRUCTURAL DESIGN ... 54
5. LOADING RESULTS ... 55
6. STRUCTURAL REACTIONS ... 56
VIII. MAESTRO MODELING ... 57
A. APPLIED LOADING ... 57
1. DESIGN LOADING OF M270 ... 57
2. CODE OF FEDERAL REGULATIONS LOADING ... 59
3. WAGNER’S IMPACT THEORY ... 61
B. MODELING STRUCTURAL COMPONENTS ... 71
C. LOADING THE MODEL ... 75
D. STRUCTURAL REACTIONS ... 78
IX. CONCLUSIONS ... 82
WORKS CITED ... 84
VITA ... 85
v
Figure 3. Typical oblique seaplane step landing (Crew 1946). ... 4
Figure 4. Draft and reaction variations during impact period (Benscoter 1947). ... 4
Figure 5. Definition of parameters to determine the impact forces on a hull using Wagner’s outer domain theory (Faltinsen 2005). ... 8
Figure 6. Transverse pressure distribution of the four hullforms used in experimental testing (Blundell and Jones 1938). ... 11
Figure 7. Prismatic float showing the velocity components and normal transverse flow plane (Mayo 1945). ... 12
Figure 8. Idealized single keel rectangular prismatic bottom hull form for both chine immersed and clear cases. Shows the splash-up of impact and the dimensions of pressure area (Crewe 1946). ... 17
Figure 9. Curves for estimating peak acceleration (Crewe 1946). ... 18
Figure 10. Curves for estimating peak acceleration (Crewe 1946). ... 19
Figure 11. Longitudinal and transverse reaction distribution on the loaded hull area (Benscoter 1947). ... 21
Figure 12. Ratio of maximum acceleration to squared initial speed for 3° (Benscoter 1947). ... 23
Figure 13. Ratio of maximum acceleration to squared initial speed for 12° (Benscoter 1947). ... 24
Figure 14. Longitudinal distribution of reaction (Benscoter 1947). ... 24
Figure 15. Pressure pick-up positions on the Sunderland Mk 5 (Hamilton 1955). ... 26
Figure 16. Measured maximum local pressures on rows A,B,C, and D compared to Wagner’s theoretical results (Hamilton 1955). ... 28
Figure 17. Measured vs. Wagner’s theoretical transverse pressure distribution in row A via method 1 (Hamilton 1955). ... 29
Figure 18. Measured vs. Wagner’s theoretical transverse pressure distribution in row A via method 2 (Hamilton 1955). ... 30
Figure 19. Measured vs. Wagner’s theoretical transverse pressure distribution in row B via method 1 (Hamilton 1955). ... 31
Figure 20. Measured vs. Wagner’s theoretical transverse pressure distribution in row B via method 2 (Hamilton 1955)... 32
Figure 21. M270 general dimensions and characteristics (Martin 1955). ... 36
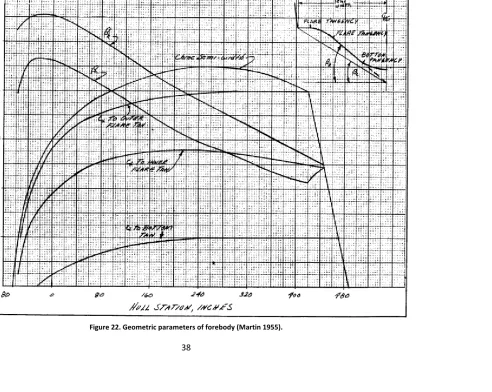
Figure 22. Geometric parameters of forebody (Martin 1955). ... 38
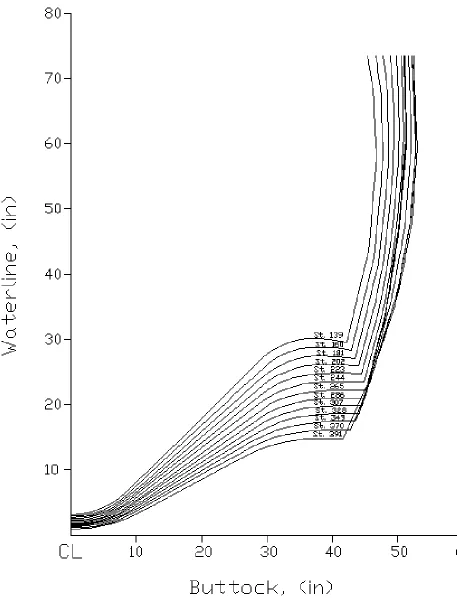
Figure 23. Forebody plan of station 391 to 139. ... 40
Figure 24. Drop test specimen under construction (Martin 1955). ... 41
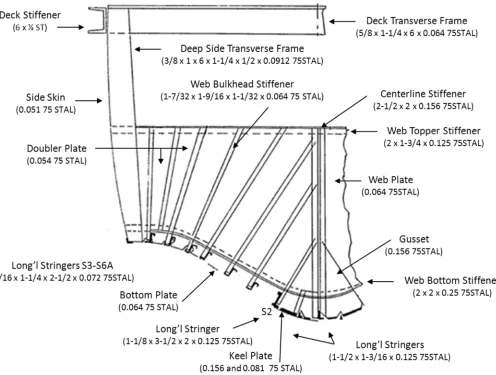
Figure 25. Structural drawing of floor frame 328 (Martin 1955). ... 43
vi
Figure 27. End Plate effects on longitudinal distribution of peak pressures for zero degree drops
ballasted at 10,000 pounds (Martin 1955). ... 48
Figure 28. Transverse peak pressure distribution for drop test specimen at zero degrees trim at impact velocity of Vn = 20, 25, 30, 35 and 40 ft/s. ... 49
Figure 29. M270 flight test (Martin 1955). ... 52
Figure 30. Impact velocity components and angles. ... 53
Figure 31. Effect of the resultant angle on the flight test peak pressure data at each pressure transducer buttock location. ... 56
Figure 32. Pressures used in the design of the drop test specimen compared with the measured peak pressures (Martin 1955). ... 58
Figure 33. Hull station weighting factor, K1 for calculating bottom pressures (14 CFR Ch.I 2010) ... 60
Figure 34. Drop test specimen averaged peak accelerations as a function of square contact speed for zero degree drop tests. ... 63
Figure 35. Transverse pressure distribution at each floor frame calculated using Wagner’s theory. ... 64
Figure 36. Wagner’s pressure distribution compared with zero degree trim drop tests at 20 ft/s impact speed. ... 65
Figure 37. Wagner’s pressure distribution compared with zero degree trim drop tests at 25 ft/s impact speed. ... 65
Figure 38. Wagner’s pressure distribution compared with zero degree trim drop tests at 30 ft/s impact speed. ... 66
Figure 39. Wagner’s pressure distribution compared with zero degree trim drop tests at 35 ft/s impact speed. ... 66
Figure 40. Wagner’s pressure distribution compared with zero degree trim drop tests at 40 ft/s impact speed. ... 67
Figure 41. Wagner’s pressure distribution compared with flight 29 landing 3 with oblique impact at speed Vn = 24.92 ft/s. ... 68
Figure 42. Wagner’s pressure distribution compared with flight 29 landing 7 with oblique impact at speed Vn = 25.53 ft/s. ... 68
Figure 43. Transverse pressure distribution comparison at station 328 using Wagner’s theory and the CFR. ... 69
Figure 44. Transverse pressure distribution comparison for the lowest pressure distribution using Wagner’s theory and all pressure distributions for CFR stations. ... 70
Figure 45. CFR pressure data in comparison with oblique flight test data. ... 70
Figure 46. Perspective view of the internal structure, modeled in Maestro. ... 73
vii
Figure 48. Maestro model of internal structure at Station 328 showing longitudinal stringers and
transverse frames. ... 74
Figure 49. Maestro model of internal structure at Station 328 showing web stiffeners. ... 75
Figure 50. Maestro pressure distribution on hull using CFR data. ... 76
Figure 51. Maestro pressure distribution on hull using Wagner’s data. ... 77
Figure 52. Stress in structure in the x-direction from Wagner’s theory, color scaled showing members with stress less than yield stress and structural members greater than yield stress in gray... 80
Figure 53. Stress in structure in the x-direction from CFR, color scaled showing members with stress less than yield stress. ... 81
L
IST OFT
ABLES Table 1. Perth Hull pressure distribution along one transverse section ( 60, 7,7.5°, and K=55) ... 10
Table 2. Physical quantities during impact ... 16
Table 3. Trade-off study between theories in literature search ... 34
Table 4. Percent difference between the two sources to determine geometric parameters of forebody relative to centerline ... 37
Table 5. Material properties used in the M270 design. ... 42
Table 6. Structural members used in the M270 design ... 44
Table 7. Stress strain gage locations on the drop test specimen. ... 46
Table 8. Flight test landing approach parameters ... 51
Table 9. Instrumentation locations of pressure transducers ... 53
Table 10. Hull station weighting factors and pressure distribution for each floor frame. ... 60
Table 11. Function u, speed of propagation, wetted semi-width, normal velocity, and acceleration used to calculate pressures at each station. ... 62
Table 12. Modified structural members for Maestro model. ... 72
viii
T
ABLE OFS
YMBOLSVon Karman (1929)
Maximum pressure
Impact velocity at the moment of first contact or sinking speed
Density of fluid
Wagner (1932) and Faltinsen (2005)
Wetted half beam
dc/dt Speed of propogation of the wetted-semi width dV/dt Vertical acceleration
Vertical distance of the surface height relative to the body
Hydrodynamic pressure
Atmospheric pressure
Time
Constant vertical velocity
Coordinate along the beam of pressure
Mass density of the water
Deadrise angle
Blundell and Jones (1938)
Span or beam
K Constant whose value depends on the position of the pressure station
Maximum pressure, psi
V Tangential or horizontal velocity of the keel of the V-shape at impact
! Velocity normal to the keel Vertical velocity at impact " Seaplane weight
∅ Angle between the normal to the plate and the vertical, i.e. deadrise angle
Angle of incidence at impact, i.e. trim angle
$ Angle between a side of the V-shape and the horizontal
Mayo (1945)
% Thickness of plane
&! Hydrodynamic force in the Vn direction
ix
( Theoretical coefficient, varies according to angle of deadrise )' Virtual mass of the flow in the plane
)* Virtual mass of flow plane at step, per unit distance in keel direction
)+ Virtual mass associated with hydrodynamic flow beneath float Initial intersection of keel line and water surface to an
individual flow plane ! Velocity normal to the keel
' Velocity of the float parallel to keel, rate at which flow planes Slide along and off step
, Depth of immersion, normal to plane of water surface - Penetration in the plane
Angle between flight path and plane of water surface
Angle of deadrise
Crewe (1946)
%!/% Acceleration of the craft normal to the craft bottom / Acceleration due to gravity
0 Draft of the bottom of the hull, usually that of the keel at the step (1 Associated mass coefficient
(2 Pressure area coefficient
Pressure, psi
q Constant that depends on the relationships between the various forces acting on a particular impact condition r Constant that depends on the relationships between the
various forces acting on a particular impact condition s Constant that depends on the relationships between the
various forces acting on a particular impact condition
3 Pressure area by projecting the surface of the bottom supporting the water pressure
Time measured from the instant the bottom first touches the water in the impact period considered
4 5"//6u is the pure impact associated water mass, which u’ is related and equal to 45 67
41 45 67
41 41at maximum acceleration of the craft normal to the craft bottom
x
! Craft normal velocity relative to the bottom 9 Craft velocity perpendicular to water : Flight path angle parameter
: Initial value of the flight path angle " Craft weight
x Constant which is dependent on the dimensional classic impact theory and is equal to 3 for 3D cases and 2 for 2D cases
Angle between craft bottom plane and water plane, i.e. keel altitude
Benscoter (1947)
) Additional mass of water or virtual mass ;< 2-dimensional mass of the seaplane
= Ratio of flight path angle to the tangent of the trim angle at instant of maximum acceleration
=> Ratio of flight path angle to the tangent of the trim angle at instant of entry
Step draft normal to keel at instant of maximum acceleration Time at instant of maximum acceleration
4 Ratio of additional mass of water to mass of seaplane at instant of maximum acceleration
> Velocity at instant of entry
-? Maximum acceleration normal to the keel
- Displacement or draft normal to the keel at instant of maximum acceleration
-@A Velocity normal to the keel at instant of maximum acceleration B Factor occurring in the definition of the coefficient that defines
the additional mass of the water
7 Factor occurring in the definition of the coefficient that defines the additional mass of the water
C̅ 2-dimensional coefficient that defines the additional mass of the water
Deadrise angle
E Length parameter
xi Hamilton (1955)
c Wetted half beam
K Constant in Wagner’s maximum pressure formula, equals 132 for design purposes when Pmax is in psi
Hydrodynamic pressure
Maximum value of hydrodynamic pressure F! Mean distributed pressure
! Velocity component normal to keel
x Distance from keel to point at which pressure is being measured
$G Local deadrise angle at any point on the hull planing bottom, degrees
$ Deadrise of line joining keel to chine
H Where, H /
Density of water
Crewe and Gerry (1977)
Planing beam
I∆ Beam loading coefficient
) Mass of the seaplane
ρ Density of the water
Code of Federal Regulations
I7 Constant
IL Constant
(7 Hull station weighting factor MN Pressure at the chine, psi O Pressure at the keel, psi
*B7 Seaplane stalling speed at the design water takeoff weight with flaps extended in the appropriate takeoff position, knots
Deadrise angle at the chine for each station O Deadrise angle at the flare tangency
Current Work
I' Coefficient of pressure
P Young’s modulus
xii ' Velocity parallel to the keel
Q Resultant velocity
9 Vertical velocity or rate of descent or sink rate
Trim angle of plane
Angle of resultant velocity relative to the normal velocity
Flight path angle
xiii
I.
A
BSTRACTFlight and drop tests of the Martin 270 (M270) seaplane were conducted in 1955. Theoretical and empirical pressures were determined by use of Wagner’s theory and also by the Code of Federal Regulations (CFR). The pressure results from the experimental tests on the hull were compared with pressures calculated from Wagner’s theory to determine how well the theory correlated with the measured pressures. The experimental pressure data was also compared with the CFR results to determine how the current industry standard of estimating impact loads compares with actual pressures a seaplane is subjected to.
Using the structural design and geometry of the M270 the seaplane hull was modeled in
Maestro with a coarse mesh finite element model. The pressures from Wagner’s theory and the CFR were applied to the model of the M270 hull. The structural reactions of the drop test section were compared with the reactions determined from Maestro.
1
II.
I
NTRODUCTIONThe purpose of this paper is to review seaplane impact theories studied by various authors and to determine theories which are applicable for the determination of impact loads on an actual fuselage. The project is governed by two different departmental criteria sets and requires two deliverables. The first of which was outlined by the Center for Innovation in Ship Design (CISD) at NAVSEA Naval Surface Warfare Center (NSWC) Carderock Division for the Naval Research Enterprise Intern Program (NREIP) and the second was outlined by the University of New Orleans’ School of Naval Architecture and Marine Engineering for a master’s thesis. CISD serves as mentor for the literature search and supplied the majority of the data and information needed to support the project. This project is the deliverable for the NREIP as well as for the master’s thesis requirements. The objectives of this project are to:
• Review past seaplane impact theory • Complete a master’s thesis study
The literature review was conducted the summer of 2011 to review past methods of determining seaplane impact loads. The study considered a wide range of papers including theoretical and experimental studies; however, due to the limited time frame of the 10 week duration of the research phase of the project, the literature search does not include all impact load theories available.
The master’s thesis for the University of New Orleans in the School of Naval Architecture and Marine Engineering expands on the studies done during the summer of 2011 for CISD at NAVSEA NSWC Carderock. The objective of the master’s thesis study is to apply the theoretical impact load theory previously studied to an existing seaplane hullform and compare the water loads on the hull to experimental results. After the determination of loads, a structural analysis is completed using Maestro, which is a global coarse mesh structural analysis tool, to compare the structural reactions from the experimental test to the structural reactions determined by Maestro.
Due to the lack of reference materials for seaplane structural drawings, very few seaplane possibilities to use for the study exist. The only structural arrangement that could be found is for an experimental flying boat, the Martin 270.
2
III.
I
NTRODUCTION TOS
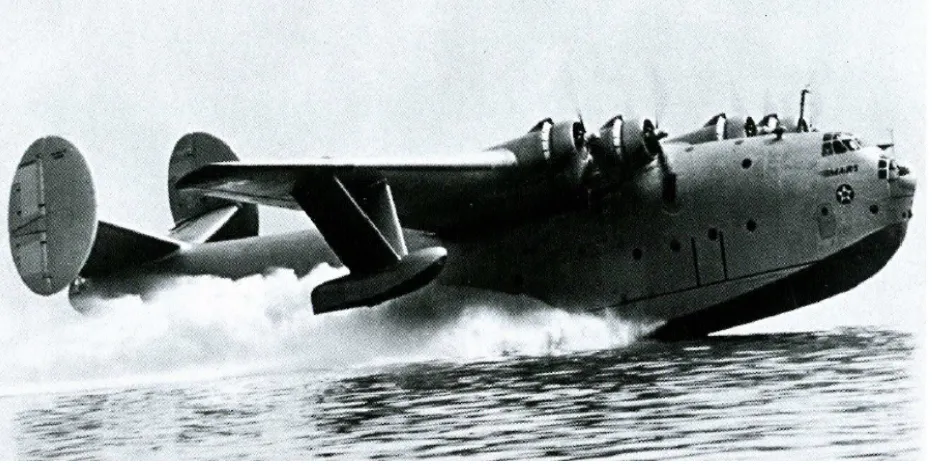
EAPLANESSeaplanes are divided into two categories: the flying boat and the float plane. The two types differ in their hullforms. Flying boats are fixed winged seaplanes where the fuselage is the hull and sponsons are normally installed under the wings for stability purposes. An example of a WWII flying boat where the fuselage serves as the hull of the plane is seen in Figure 1. For the floatplane (Figure 2), floats or pontoons are attached to the underside of the fuselage through struts and serve as the hull of the seaplane. Further, a floatplane pontoon design can be done in two different arrangements. The most common is the twin float design where two floats are attached on the underside of the fuselage. The second arrangement is the single float, where one larger float is attached underneath the fuselage and sponsons are attached under the wings for stabilization.
Whether the seaplane is a flying boat or a floatplane, the hull of the plane enters the water causing an impact load on the hull structure due to the force exerted by the water on the hull. These forces are related to the rate of growth of the waterplane area. The development of impact theory has been a main focus in seaplane engineering since the late 1920s and later gave rise to slamming theory on planing hulls. Key contributors such as Von Karman (1929), who studied conservation of momentum imparted from the seaplane to an associated water mass of the hull, and Wagner (1932), who studied transverse pressure distributions and wave rise during impact, helped set the baseline for other impact theories.
3
Early impact theories assumed that the momentum of the seaplane imparted to the virtual mass remained constant. However, this is only true in the case of vertical drop where the velocity parallel to the keel is zero. For typical oblique seaplane landings depicted in Figure 3, momentum of the seaplane is not only imparted to the virtual mass of the water connected or associated with the impact area of the hull but also to the downwash as the water slides off the step or the rear of the plane. The cross section at the step determines the momentum imparted to the downwash, whereas the forward cross sections have more effect on the virtual mass. Thus, applying equations that solely consider the vertical velocity during impact and not the resultant velocity of both vertical and horizontal velocities like in oblique landing, neglect the momentum imparted to the downwash (Mayo 1945).
Seaplanes with constant trim during landing will skip like a rock does when thrown nearly horizontally off the water. Each of these “skips” are impact periods and during each of these periods the force exerted on the hull from the water goes from zero before initial impact to a maximum force and then back to zero when the hull leaves the water. The first impact period produces the maximum impact force, and this decreases with each consecutive impact period.
During the impact period the lift force on the wing is about equal to the weight of the entire seaplane, so most theories assume they are equal. Benscoter (1947) shows this type of landing approach in Figure 4, and the reaction during the impact period of a “skip.” In most theories the horizontal velocity component of the seaplane during impact is kept constant. According to Crewe (1946), this is also true for full scale conditions.
4
It is important to determine the impact loads in order to perform a structural analysis on the hullform. Severe structural damage can be done to the plating and framing of the fuselage if the loads are not estimated appropriately. Since hydroelasticity is ignored in most seaplane impact theories assuming a rigid body, the average pressure is of importance to the structural response (Faltinsen 2005).
Figure 3. Typical oblique seaplane step landing (Crew 1946).
5
IV.
I
MPORTANTC
ONSIDERATIONSU
SINGI
MPACTT
HEORYIn much of the theory reviewed, there are several assumptions and physical conditions inherent in seaplane impact which is usually ignored. Thus, a review of some key underlying assumptions should be addressed in order to understand the limitations of the methods proposed.
Important considerations discussed include planing data, model test results, hullform rigidity, 2-dimensional versus 3-2-dimensional analysis, and chine immersion.
A. PLANING DATA
Some theories suggest using planing data in order to predict the impact loads; however a cautionary note should be advised when doing so. Overall, impact pressures are related to the rate of growth of the waterplane area. However, when using pure-planing data versus impact data, differences arise in local pressure. Crewe and Gerry (1977) conclude that local pressures in steady planing cannot exceed the water stagnation pressure, however in impact the local pressures maybe up to several times this amount. Therefore, planing conditions do not see these peak pressures near the water surface intersection during impact. The authors suggests determining the pressure distribution by a strip method calculation by means of both “planing theory” of a 2-dimensional longitudinal plate on a stream of finite depth proposed by Green (Green 1935) and vertical impact theory for lateral hull sections proposed by Wagner (Wagner 1932).
B. MODEL TEST RESULTS
To validate impact theory, the theoretical equations to predict such loads are usually compared with either model or full scale tests. Comparing experimental results with theoretical has its complications for many reasons since many effects that a normal seaplane experiences are not included in theory. These effects include, but are not limited to the following: airframe elasticity which affects the inertial loads, the
aerodynamic lift which varies during impact, ground effect on the wing lift which may greatly affect the trim and initial flight path, and after-body effects. Thus, additional safety factors should be applied when using theoretical loads (Crewe and Gerry 1977).
C. RIGIDITY
6
considered for small deadrise angles. Rigid structural analysis however, does not consider hydroelasticity or dynamic effects (Faltinsen 2005). The theories discussed for the most part assume a rigid hullform.
D. 2-DIMENSIONAL VERSUS 3-DIMENSIONAL
Many theories consider only 2D impact as opposed to 3D. The importance of 3D flow affects the maximum pressure by a ratio of 0.66 when comparing a cone and a wedge with small deadrise and constant velocity. Beukelman (1991) showed with experimental data that the forward speed has a strong influence on the pressure level when the deadrise angle is lower than around 2 degrees for 3D bodies (Faltinsen 2005).
E. CHINE IMMERSION
Another consideration sometimes not dealt with in theory is chine immersion. Most theories assume no chine immersion. Due to the effect of free water surface wave rise during penetration of impact, the chines may immerse before maximum acceleration occurs. In this case the acceleration would be less than if the chines had not been immersed. An estimate for the rule of chine immersion given in the equation below, is that for length-to-beam ratio hulls of around six, the maximum acceleration and
sometimes maximum penetration or draft occurs without chine immersion with normal loading or in other words typical beam loading coefficient in the order one (Crewe and Gerry 1977).
I∆ )
L
V.
L
ITERATURER
EVIEWA. VON KARMAN AND WATTENDORF (1929)
Empirical equations are derived by Von Karman (1929) to find the maximum pressure experienced by the float at initial impact. The theory is based on a prismatic wedge hull dropped vertically and striking a horizontal water surface. The force is derived using the momentum theorem, and can only be used by assuming a closed system and
conservation of momentum. Thus the effect of buoyancy decreasing momentum is neglected.
Von Karman determined that the added mass for the seaplane float is equal to the mass of the water contained in a semicircular cylinder of the diameter equal to the
7
assumed if the undersurfaces are not too sharply inclined. The following equation predicts the maximum pressure acting on the float and includes a dynamic pressure part which corresponds to the impact velocity and a term which correlates to the theoretical factor of increase for differing angles of deadrise.
)S >
7
2 T cot
The empirical formula corresponds well with experimental results performed for the paper; however, a limitation is that this method is not compared with oblique impact velocity component parallel to the keel.
B. WAGNER (1932)
Wagner’s (1932) method assumes blunt body impact and considers the local uprise of water. Wagner’s slamming model of a local small deadrise angle completed in 1932 is useful in the fact that it provides simple analytical results and has practical uses.
Faltinsen’s (2005) forms of Wagner’s equations were also used in this section of review of theory.
Wedge drop tests show that spray is close to atmospheric pressure and thus is not as important as the large pressures occurring at the spray root where there is green water loading, or where the air isn’t mixed with the flow. At the spray root large pressure gradients accelerate the water at high velocities into a “jet flow” causing a high free-surface curvature or wave uprise which then turns into spray under the influence of surface tension. Wagner devised the impact problem in separate domain theories. The proposed method concentrates on Wagner’s outer flow domain theory, which excludes the flow in the jet domain, which turns into spray, and also excludes the inner domain which includes the flow in the spray root (Faltinsen 2005).
This outer domain theory uses the intersections between the water surface and the hull surface, which is very close to the location of the spray roots (Faltinsen 2005). Figure 5, shows an impacting hull with the water surface in the outer flow domain where the hull hits with constant entry velocity. The derived pressure equation is given below where c is the wetted half beam, P is the hydrodynamic pressure, is the atmospheric pressure,
8
Y 57Y 76B/7%% Z %% 57Y 76B/7
The first term in this equation is the slamming pressure and is related with the rate of change of the wetted surface and the second term which is considered the added mass pressure (Faltinsen 2005). After chine immersion, the wetted half beam is constant, so the slamming pressure term goes to zero. Thus, after chine immersion the only pressure acting on the hull is due to the associated added mass of the hull.
Several variables in the pressure equation need further insight on how to determine them. Wagner’s theory is capable of handling non-prismatic hullforms, where the vertical distance of the surface height relative to the body, 56, can be defined a series which captures the bottom surface geometry and is given by the equation below.
56 Z B7Z 7LZ L\Z \]Z ⋯
To determine a function which relates the normal velocity to the speed of propagation of the wetted semi-width as the body submerges, the function u is defined by formula below (Wagner 1932).
4 456 %! %
2
T Z B Z4T 77Z2 3 LLZ3T 16 \\Z ⋯
With the function u calculated at a particular wetted half beam of interest, the speed of propagation of the wetted semi-width can be determined given an impact velocity. This quantity can then be substituted into the pressure equation to determine the
hydrodynamic pressure on the hullform.
As previously stated Wagner’s theory is useful since it provides simple analytical results and is practical. The theory is of value since it is capable of computing pressures for non-prismatic hullforms. However, the equations only use vertical impact velocity and chine
9
un-wetted conditions, which is not the impact scenario for typical oblique seaplane landing. Since Wagner’s theory is derived with only the vertical impact velocity, the momentum imparted to the downwash is not considered.
C. BLUNDELL AND JONES (1938)
Pressure and total impact force measurements were conducted on a variety of seaplane hulls including the Southampton and Perth seaplanes, the Singapore IIc, and on a V-shape hull by Blundell and Jones (1938). The Southampton and Perth seaplanes were tested to seaplane alighting impact conditions, whereas the Singapore IIc was tested in purely vertical impact. The results were then compared with impact theory using the equation below.
!
7
( cot ∅ , `0a=a cos ∅ cos $ cos
The equation given above is derived from V-shape model tests and gives the relation of the pressure, where the constant K varies depending on the location of impact interest and the loading. In previous tests, K equaled 68 for a location close to the chine and 47 for a location near the keel. This shows that the impact pressure is higher at the keel than at the chine for a V-shape hull. The pressure near the chine depends on the loading as well as the striking velocity, whereas the pressure near the keel is independent of the weight, or the loading, of the hull. It is however dependent on the deceleration through the water. It is important to note that this equation with the values of K provided is only for hull forms with the same order of loading on the hull bottom as the experimental hull form.
Figure 6 shows the varying hull shapes used in the paper and the peak pressures across transverse sections of each hull form. The Perth hull is of particular interest with the drastic change of the local deadrise from keel to chine varying from 5.5 degrees to 41 degrees. Table 1 summarizes a good agreement between the theoretical and
10
Table 1. Perth Hull pressure distribution along one transverse section (c defg
h, ij k fg
h, l k. m°, and K=55)
Station Deadrise Angle $° Empirical Pressure (psi) Recorded Pressure (psi)
Near Chine 11 5.5 24.5 22.0
12 14.0 14.2 14.0
13 22.5 9.1 -
14 41.0 4.5 6.2
16 41.0 9.0 8.0
Near Keel 17 41.0 18.0 17.0
The experimental and theoretical results also show that at constant immersion,
regardless of the impact velocity, the maximum force of impact occurs. Also under this condition, the experimental results showed that for all three seaplane hulls the chine was nowhere near chine wetting when the maximum force was measured. The theory also shows and is verified by experimental results that the pressure midway between the keel and the chine is proportional to the cotangent of the deadrise angle at a given impact velocity which is normal to the keel except when this angle is very small.
Comparing the recorded pressure of the three seaplane hulls and the V-shape used for experimental study with the maximum peak pressure equation, the results showed good agreement. Since there was good agreement with the seaplanes with curved transverse sections, Blundell and Jones imply that the theoretical equation can be applied not only to flat V-sided hulls but to curved hullforms and to hull forms with deadrise varying longitudinally. However, because the value of constant K seen in the pressure equation is deduced from experimental results from the seaplane hull forms listed, it is important to note that this method is limited to hullforms similar to those tested.
11
12
D. MAYO (1945)
By correcting previous impact theory, Mayo (1945) develops an improved theory to determine the force acting on the hull during impact of a prismatic hull with positive trim. The key contributions to the impact problem that Mayo considers include: flow in
transverse planes, momentum equations, aspect-ratio corrections, effect of generated wave on the virtual mass, distribution of surface pressure, and conditions for maximum impact force.
The forward velocity of the seaplane float causes momentum to be passed into the hydrodynamic downwash. For impact with trim the rate of penetration is determined not only by the velocity component normal to the keel but also by the velocity component parallel to the keel, which tends to reduce the penetration.
The motion of the hull for oblique impact considers not only perpendicular but parallel flow motions in respect to the keel. The paper considers transverse “flow planes” which are fixed in space and can be seen in Figure 7. The hull passes through these flow planes and when the step clears a flow plane the flow plane then becomes a part of the wake. Thus for oblique impact the flow plane comes into contact with all cross-sections as the hull form passes through it with time, whereas for solely vertical impact the flow plane is in contact with only one cross section.
For an ideal fluid, the growth of the of the intersected hull cross section as it passes a particular plane will only be used to determine the flow in that particular plane. The entire flow process for an individual plane begins when the keel line penetrates the individual plane and ends when the planes slide off the step or the rear of the hull.
13
For vertical impact with a hull with some trim angle, the accelerated water during impact is in the direction normal to the plating, thus the stationary plane in which the fluid moves is in the direction normal to the keel. As the keel immerses there is a difference in depth along the keel and this difference causes longitudinal pressure gradients. These longitudinal pressure gradients change the end effects of the flow and the cross-plane-flow. To account for the various differences in flow caused by the longitudinal pressure differences, an aspect-ratio factor is applied to the pressure equation.
The total impact force is found by total rate of change of momentum, which is equal to summing all the reactions of the individual flow planes that the hull encounters and also the momentum that is passed on to the downwash along with the flow planes that slide off the step. The total hydrodynamic force in the direction of the velocity normal to the keel is defined by the equation below.
&! % 5)% +!6 Z )*!'
However, in order to get the longitudinal load distribution, each reaction of each individual flow plane affected by the impact at a particular instant of loading must be determined.
In order to apply the equation above, this force equation is derived again with empirical equations for virtual mass and aspect-ratio corrections for the distributed load. A brief summary is provided, with key equations that determine the end result of the force acting normal to the hull.
The force acting on the hull due to an individual transverse flow plane given in the equation below, considers the momentum of the flow in that transverse plane.
&' % n(-% 7%%-%o
To obtain the total force, the forces acting on the hull from each individual flow plane can be integrated over the effected length of the hull. For fixed trim impact a total force equation is defined by the following equation, where the first term is related to the virtual mass of the flow beneath the hull and the rate at which the momentum of the seaplane is imparted to the downwash.
&!
(,7%!
%
3 sin 5cos 67Z (, 7!7
14
To account for the virtual mass of the flow in the transverse plane, Sydow’s theoretical equation for flow in normal planes of a triangular prism along with Pabst’s empirical aspect ratio factor to correct for end loss were used. The effective aspect ratio used in this case, is the length to mean-beam ratio. However, to correct for the inaccuracy of Pabt’s aspect-ratio factor determined by submerged vibration test a correction factor of 0.82 derived from experimental results was introduced into the equation for the virtual mass of the flow in the transverse plane. The resulting equation is given below.
)' 0.82 n2 Y 1oT 7
T2 -7% n1 Y tan
2 tan o
The equation above can only be used for small deadrise angles due to the aspect-ratio factor. With further substitutions and knowing that the total force equation already stated
was derived on the relationship that ( )'⁄-7% the )' equation can be substituted
into the normal force equation and gives the following final total force formula.
&' 0.822 n2 Y 1oT 7
n1 Y2 tan otan sin cos uT,7 3 cos Z , %%! !7v
When comparing this method to experimental data for planing, vertical drop, and oblique impact, the theory shows good agreement for the loss of momentum imparted to the downwash. Also, the oblique impact data shows that old theory used greatly
overestimates the impact force, thus the proposed theory gives good results especially for seaplanes landing with higher trim angles.
E. CREWE (1946)
Crewe’s (1946) theory assumes that the hull has a tangential-to-keel velocity relative to the water. The impact motions in this case have other forces in addition to the classical impact theory. These additional forces are the same types that occur in steady planing motions. Crewe refers to these forces as impact-planing forces. The impact-planing forces could be less than the similar forces developed during planing due to the impact not lasting long enough for the forces to build up entirely. The equations used to predict these impact-planing forces include a ‘time-lag’ coefficient to account for this lack of full force build-up as compared to the steady planing condition.
15
impact is dependent on the virtual mass. Like other impact methods, Crewe assumes that a hull form in motion has a corresponding mass of water that attaches itself with the hull, however the virtual mass moves with the normal-to-bottom velocity
component during impact. All water effects except the inertia forces of the added mass are neglected.
The impact gliding force is considered when the velocity component in the vertical direction is zero and the Froude number is large. These forces are due to the tangential velocity of the water relative to the bottom and are similar to that in a steady planing case. The normal drag comes from the component of flow of the water in the direction past the bottom.
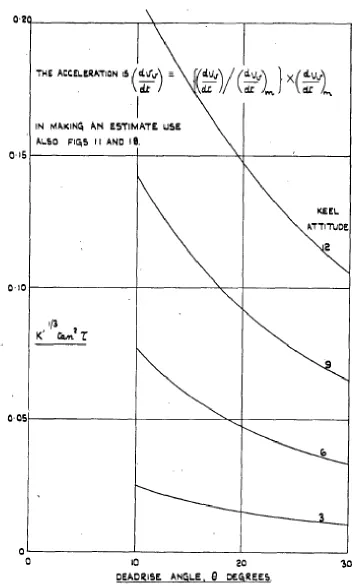
Additional derivations of important quantities such as the pure impact added mass at the moment of peak acceleration are given in the text, however one of the most unique and important aspects of the paper are the series of cures of numerical cases. These are very good for making seaplane performance estimates and they also include the time history of impact which many theories do not. The hull form shown in Figure 8 was used for the calculations for the curves is a “single keeled rectangular prismatic bottom.”
Important physical quantities can be determined in the Table 2. The product of columns 2, 3 and 4 give the quantities in column 1. In order to get values at the moment of peak acceleration, the prime term of the pure impact associated water mass value, 41, and the flight-path-angle parameter, :, should be replaced by their values at maximum acceleration in column 4 formulas. The series of curves of numerical cases discussed later provide the values for the columns in the table.
The quantities for determination in column 1 include: the draft of the bottom of the hull, usually that of the keel at the step, h, the pressure area by projecting the surface of the bottom supporting the water pressure, S, the time measured from the instant the bottom first touches the water in the impact period considered, t, the craft velocity perpendicular to the water, 9, the acceleration of the craft normal to the craft bottom,
5%!/%6, and average water pressure over the pressure area, p. Other quantities listed
16
Table 2. Physical quantities during impact
Quantity Required Functions Plotted
Column 1 Column 2 Column 3 Column 4
0 5"//65B/6 1 (⁄ 15B/6 415B/6
3 5"//65BwB/6 (
*⁄(15BwB/6 415BwB/6
5"//65B/6 8
⁄ 1 (⁄ 15B/6tan 41 5B/6
: x
%541⁄ 641 5B/6
5: :⁄ 6 yz{⁄z|{ }5~/6
A
9 8 tan :
5%!/%6 87⁄5"//65B/6 (15B/65tan 67 415BwB/6, 5:7Z : Z =6 51 Z 4⁄ 16
87 (15tan 67⁄144(2 5:7Z : Z =6 51 Z 4⁄ 16
Some of the quantities that can be determined from the design curves to apply to important design parameters include peak acceleration, time to reach peak acceleration to determine wing stresses, wetted area and draft when the velocity component
perpendicular to the water has become zero to determine frame stresses, average pressure at moment of first contact with water to determine plating stresses, and the variation of average pressure with pressure area to determine frames and plating strengths. Example graphs to determine the peak acceleration are included in Figures 9 and 10, where both graphs are used simultaneously to determine the value.
17
18
19
20
F. BENSCOTER (1947)
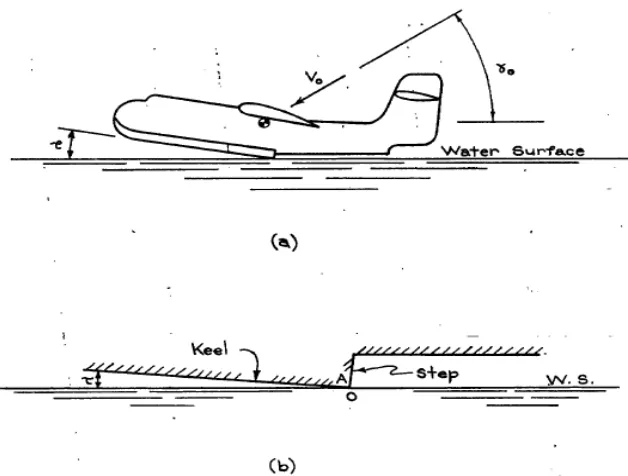
A step landing is proposed by Benscoter (1947) for an infinite beam and length wedge starting at the step with a flat-bottom without flare and no afterbody. The trim angle is assumed to remain constant and the initial velocity is in the direction of the flight path angle. In most analysis, the velocity component parallel to the keel is kept constant during the impact period. However, since for stepped landings the trim angle is kept small, then the horizontal velocity component will be kept constant which produces just slightly different results if the velocity component parallel to the keel were kept
constant.
As shown in the introduction section of the paper and Figure 4, the seaplane enters the water at the intersection of the keel and the step, which is marked at point O. Point O is considered the initial part of the “skip” where the plane enters the water and point P is where the plane exits the water.
We can see in Figure 4 that the seaplane’s reaction reaches a maximum upward acceleration before the point of maximum draft. This is proven in both experimental and theoretical results. Also it is important to note that this bottom reaction,
throughout the course of the impact period of the seaplane, is only proportional to the vertical acceleration when the wing lift equals the weight. It can also be concluded that the maximum acceleration is proportional to the initial velocity squared and inversely proportional to the draft at the time of maximum acceleration.
Benscoter considers the important parameters that affect the loading or motion of the seaplane to include the deadrise along the hull and the mass of the plane. If the plane is large then elasticity of the structure may also be important, however in this analysis it is ignored. As seen in Figure 11, the loaded area of the hull is similar to that of a triangle. However, the “calm water” intersection of the hullform is not enough to analyze. Due to water pile-up of the spray root, the transverse pressure distribution must be analyzed along with the longitudinal pressure distribution.
Now the problem has been turned into a 3D analysis with a longitudinal distribution. The problem could only be handled in the proposed state of Benscoter’s work via an aspect-ratio factor applied to the pressure at all the points along the loaded area. To analyze the total reaction distribution along the length of the hull, unit transverse strips of the loaded area are analyzed at stations along the longitudinal loaded area and then integrated along this longitudinal length of loading. Each individual strip’s reaction force is dependent on the draft of the keel at this particular station and the velocity
21
each individual unit strip. This method lacks the ability to determine the transverse pressure distribution as in Figure 11. Possible incorporation of other methods, such as Wagner’s, maybe integrated into this method.
First analyzing the 2D case, the theory considers a wedge dropped vertically in the water and the added mass associated with the impact. To account for the water pile-up, the added mass is multiplied by a correction factor. The theory shows that the water mass is proportional to the square of the displacement. The reaction force is caused by the rate of change of momentum of the fluid, where this momentum change is due to the change of velocity of the hull and also the change of added mass due to the change of the loaded width.
When creating the equation for the maximum acceleration that the hull experiences with its corresponding draft and time of occurrence, the buoyancy term is omitted because for maximum accelerations the buoyancy force is very small at the
22
corresponding displacement. The equation below is for the maximum acceleration in the 2D case and is the final result of a series of substitutions and assumptions. It is in terms of the physical properties of the float as well as the initial sinking speed.
-? Y n108o25 -> 7
-
Also the displacement, or draft, at the maximum acceleration is dependent on the mass of the seaplane and the coefficient of added mass and is defined by the equation below.
- 5 ∈<;<
Lastly, for the 2D case, the time for the maximum acceleration is defined in the following equation.
1615 n--@ >o
For 3D flow, the motion of each unit slice described in 2D flow is assumed to act independently of the adjacent unit slices, where the fluid of the loaded area is divided into unit slices that are perpendicular to the keel. The velocities, displacements and accelerations of each slice are assumed to act normal to the keel. The reaction on the hull is assumed to be the combined widths of the slices which then equal the entire wetted length of the hull.
A 3D virtual mass is derived in the paper and it contains the reduction factor for the aspect-ratio effect to compensate for the varying loaded area in the longitudinal direction. Through a series of assumptions and substitutions, the force per unit slice is integrated over the entire wetted length of the hull and produces the equation for maximum acceleration given below.
-? Y1
n
34
1 Z 4o
51 Z =67>75sin 67
1 Z =>75tan 67
The paper also gives formulas that are approximate for design. The formula for
aspect-23
ratio effect, the effect of piled-up water, and the dead-rise angle correction to flat-plate theory.
-?E
BA7 Y
7
4
n
34
1 Z 4o
51 Z =675sin 67
1 Z =>75tan 67
From Figures 12 and 13 which use an average value of 7L 1.1 and two different values of trim angle, the approximate maximum acceleration of any hullform can be determined. To get the reaction force, the acceleration determined from the graphs is simply multiplied by the mass of the seaplane. The longitudinal reaction distribution can then be determined as shown in Figure 14. There are two parts to the individual force acting on each individual strip which include a quadratic variation and a linear variation.
The theory for maximum acceleration gives good agreement with experimental results. However, the comparison between draft in theory and experimental results is harder to determine and more work should be done on this matter. Overall, the proposed theory gives a good method for determining the longitudinal variation the loading. However, more detailed work should be done on incorporating a more complete theory that includes the transverse pressure distributions.
24
Figure 13. Ratio of maximum acceleration to squared initial speed for ° (Benscoter 1947).
25
G. HAMILTON (1955)
To demonstrate the full scale impact forces and pressures and the magnitude different parameters affect the total outcomes, Hamilton (1955) used the Sunderland Mk.5 in full scale tests and compared the results with Wagner’s theory on pressure. Figure 15 shows where the experimental pressure pick-up positions were located longitudinally on the hull with three different rows along with transverse pick-ups on each of those rows for the experimental impact test.
To determine the maximum hydrodynamic pressure on a planing bottom for local impact, Wagner’s equation below was used for the theoretical calculations. Although this equation is for a wedge with flat-sides, Hamilton says it can be used for curved cross-sections because of the use of the local deadrise angle in the equation.
The value for the constant in Wagner’s maximum pressure formula, K, differs from full scale derivation to Wagner’s theory by an additional value of 8, and is respectively as follows, 132 and 144 when the maximum pressure is given in psi. The paper suggests K should be used as 132 for design purposes, and are the transient peak pressures near the leading edge of the pressure wave.
12 ! 7
( T2 cot $G
7
Z 1
Figure 16 plots every pick-up point’s maximum pressures against the impact velocity squared along with Wagner’s theory. Individual plots at each pick-up row can found in the paper.
To show the transverse pressure distribution of individual cross section rows at the transverse pick-up points, Figures 17, 18, 19, and 20 show several experimental runs versus Wagner’s theoretical transverse pressure distribution for rows A and B. There are two methods to determine the experimental pressure distributions. Figures 17 and 19 are generated by experimental method 1 and Figures 18 and 20 are generated by experimental method 2. Method 1 finds the transverse distributions from pressures indicated simultaneously on several pressure pick-ups in the rows, whereas method 2 finds the transverse distributions taken from the pressure time histories of one pick-up in each row by assuming that the pressure wave has a constant velocity for the
considered time interval. Wagner’s equation to equate the transverse pressure
26
B 7!7n
Bw Y
Bwo
To account for other factors that may affect impact loads such as chine immersion, hull and wing flexibility, and afterbody effects the following conclusions were made during experimental tests. Chine immersion is small and takes place after the theoretical time of maximum acceleration. As far as structure flexibility, wing vibrations were not amply excited to cause great differences in maximum acceleration and also hull flexibility is negligible.
Lastly, in order to convert the peak pressures, or the pressures confined to a small area, to the design pressures, or the pressures over larger areas, for 2D hulls a simple
27
expression is derived for the relative magnitude of peak and the mean distributed pressures.
F!
T477$ Z 1 H
T cot $ sinwBH Z H Y 12logF1 Z H
1 Y H
Overall this paper shows good agreement between the experimental and theoretical maximum pressures. However, the Sunderland Mk.5 hull almost matches the
description of a wedge shaped prismatic hull of constant deadrise that Wagner uses in his theory. Although the paper says that the theory can be used for curved cross-sections because of the local deadrise angle, additional experiments should be
28
29
30
31
32
33
H. AREAS OF FURTHER STUDY
After reviewing the theories outlined, it is concluded that additional research should be conducted in many aspects of the impact problem. Again it should be noted that there are many other theories that propose solutions to seaplane impact loading and further that the review of the theories described in this paper does not address every factor considered in the original papers. However several conclusions can be made on further areas of possible study, include the following:
1. Many theories do not provide a variation of pressure distribution with time along with the variation of penetration or draft with the corresponding pressure
distributions. This is necessary in order to further analyze the pressure distribution in both longitudinal and transverse direction.
2. More research in determining the virtual mass corresponding to the actual shape of the seaplane hull should be conducted. As previously discussed, the momentum of the seaplane is imparted to the virtual mass of the water connected or associated with the impact area of the hull and also with the downwash as the water slides off the step or the rear of the plane. Therefore, the virtual mass is critical in determining the impact loading.
3. As far as the effect of the afterbody, in main step landings, a suction force may occur on the afterbody. From experimental results such as the Sunderland Mk.5 this force was not calculated. The suction force is also not included in the theoretical
calculations seen in the papers reviewed. Further investigation in measuring experimental suction forces and incorporating them into theory is needed.
4. The theories studied only considered single step hull forms. A theoretical and experimental study could be done on multiple step seaplane hulls.
5. To account for non-calm water conditions, relative vertical motions and velocities between the hullform and the water where the hullform will hit is needed. It would be beneficial to account for the interactions between the impact loads and hullform motions.
34
I. IMPACT THEORY TRADE-OFF STUDY
The pressure data for the entire plane was limited to only a few stations and buttock locations. A theoretical method to determine the pressure distribution that could
accurately depict the pressure distribution for the M270 stations was needed in order to capture the complete picture of the loads acting on the hull during impact.
A simple trade-off study was conducted between the impact theories, where rating extends from three being the highest importance in each parameter to one being the lowest. Several impact theories were combined since they were related to one another. It is important to note, that the restricted timeline for the project to actually utilize the theory was a consideration.
The parameters used to rate the theories include the following: (1.) the theories practicality to apply to a preliminary study,( 2.) the availability of required information from the Martin Model M270 Water Loads Investigation (1955) report needed for the theory, (3.) the theories validation with experimental tests, (4.) the theories ability to be applied to non-prismatic hullforms, (5.) and the theories ability to capture the entire impact process. The ranking from the trade-off study is shown in Table 3. After the trade-off study was completed, it was concluded to use Wagner’s impact theory should be used for the theoretical study.
Table 3. Trade-off study between theories in literature search
Trade-off Study Parameters
(1.) (2.) (3.) (4.) (5.) Sum
Wagner (1932), Faltinsen (2005) and Hamilton (1955) 3 3 3 3 2 14
Von Karman and Wattendorf (1929) 3 1 2 3 1 10
Blundell and Jones (1938) 2 3 3 3 1 12
Benscoter (1947) 1 1 3 1 3 9
Mayo (1945) 2 1 3 2 2 10
35
VI.
H
ULLFORMD
ESCRIPTIONA. GENERAL HULLFORM PARAMETERS
The M270 general dimensions shown in Figure 21 from Martin (1955) include: full loading of 71,000 pounds, length of the waterline of 1186.8 inches, maximum beam of 90 inches, and the beam at the step of 80 inches. Station spacing is one inch and is defined by the following stations: station -65 is at the forward perpendicular, station 435.8 is the first section of the step, station 489 is the later end of the step, and station 1121.8 is at the aft perpendicular. The forebody extends between station -65 and 420, while the afterbody extends between station 420 and 1121.8 (Martin 1955).
B. UNIQUE ATTRIBUTES
The M270 experimental plane’s hullform was unique and combined several design parameters not considered in other seaplane design. Each design feature was chosen in order to decrease the impact loads. These design features include: high length-beam ratio hull, rounded forebody keel, long afterbody, and faired V-step.
Unlike traditional flying boat designs with a straight transverse step, the M-270 was designed to have a V-shaped step with deadrise of 60 degrees. For a step landing at reasonable angles of trim, the V-step should result in a smaller impact load when compared to a more traditional step design. This is due to a more gradual entry of the step as it enters the water.
36
37
C. GEOMETRY
The Martin (1955) report included drawings of the forebody plan, however a scale was not provided. Therefore, in order to produce an accurate scaled drawing of the station geometry of the forebody a comparison study was preformed between the body plan of the forebody and a geometric parameters graph of the forebody, shown in Figure 22.
As stated, there was no scale for the buttock lines on the x-axis or the waterlines on the y-axis on the forebody plan. Therefore the maximum beam of the fuselage provided on the basic airplane parameters drawing, Figure 21, was used to scale the drawing to the maximum beam of 90 inches. Stations 431 to 469 taken from the forebody plan, is where the maximum beam is located. Therefore the forebody plan half-breadth was scaled to the 90 inch beam or 45 inch half-breadth.
The discrepancy arose when comparing the scaled offsets of the body plan drawing with the geometric parameters of the forebody. Both sources of geometry data show
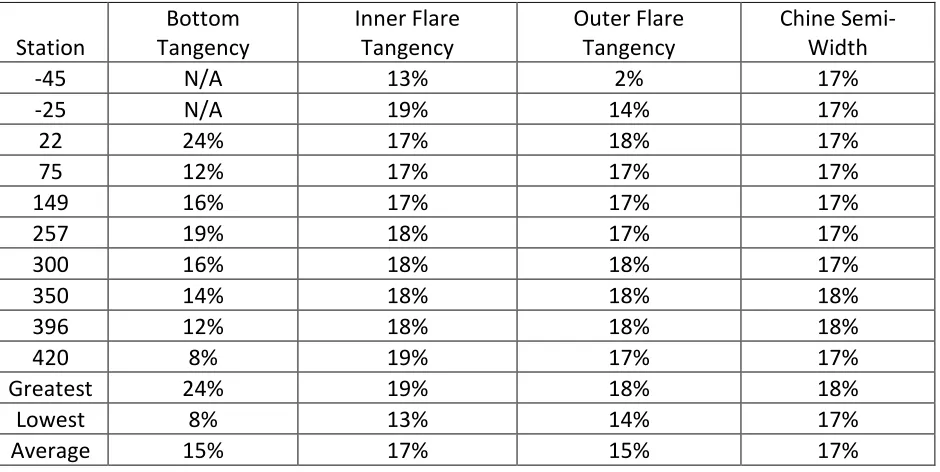
dimensions from centerline to the following locations: round bottom tangency, inner chine flare tangency, outer chine flare tangency and chine semi-width. Table 4 summarizes the percent difference in the offsets taken from the scaled body plan in comparison to the offsets taken from the geometric parameters graph for various stations ranging from station -45 to station 420.
Table 4. Percent difference between the two sources to determine geometric parameters of forebody relative to centerline
Station Bottom Tangency Inner Flare Tangency Outer Flare Tangency Chine Semi-Width
-45 N/A 13% 2% 17%
-25 N/A 19% 14% 17%
22 24% 17% 18% 17%
75 12% 17% 17% 17%
149 16% 17% 17% 17%
257 19% 18% 17% 17%
300 16% 18% 18% 17%
350 14% 18% 18% 18%
396 12% 18% 18% 18%
420 8% 19% 17% 17%
Greatest 24% 19% 18% 18%
Lowest 8% 13% 14% 17%
38
39
There is an average percent difference of 15% for the bottom tangency distance, 17% for the inner flare tangency, 15% for the outer flare tangency, and 17% for the chine semi-width, all of which are referenced from centerline. Since the chine semi-width had the least range of offset percent difference at each station, the body plan drawing was scaled to the chine semi-width offsets taken from the geometric parameters of the forebody table.
To validate the results of the geometry, the structural drawing for frame 328, provided by the Martin (1955) report was scaled to fit the station offsets. A direct correlation between the structural drawings centerline height of 72 inches and the scaled body plan was found. Thus, the comparison confirmed the newly scaled forebody geometry.
40
41
VII.
M
ODELT
ESTSA. DROP TEST
1. MODEL DESCRIPTION
The drop test specimen section tested in the Martin (1955) report was chosen since it was near the maximum pressure load on the hull. The cross section which the specimen dimensions were based on was for station 328-5/8. Overall the specimen is a constant deadrise section with a depth of 72 inches and longitudinal length of 71 inches as seen in Figure 24, illustrating the test specimen under construction.
Overall the specimen represents roughly one-sixth of the length of the M270’s forebody and the gross weight of the specimen was designed to be one-third of that of the M270 equaling 20,000 pounds. However, the actual maximum weight of the structure was only 19,800 pounds. This structure was ballasted to reach this weight, thus other loading conditions include: 19,800, 15,500, 11,590, and 10,584 pounds.
42
2. STRUCTURAL DESIGN
The M270 drop test specimen section represents a floor frame design that was typical to Glenn L. Martin Company structural designs (Martin 1955). The frames for the test specimen include 3 floor frames spaced 21 inches apart and a total of six intermediate floor frames, two frames in between each floor frame, and spaced seven inches from the floor frames.
The specimen is a riveted structure and was constructed of 75ST Alclad
aluminum alloy with material properties given in Table 5 (Niu 1988). Keel plating in the structure was designed to be removed in order to test different plate thicknesses during impact tests. Standard keel plate thickness for the M270 is however, 0.156 inches thick.
Table 5. Material properties used in the M270 design.
Material Properties
Young's Modulus, E Density, ρ Poisson Ratio Yield Stress Ultimate Tensile Strength
(psi) (lb/in3) (-) (ksi) (ksi)
75 ST-AL 1.03E+07 0.101 0.33 70 78
75 ST-AL Extrusion 1.04E+07 0.101 0.33 70 78
Structural details for the floor frame at station 328 are shown in Figure 25. The web plate is stiffened by channels running perpendicular to the bottom plating. At the chine and keel locations where high water pressure occurs during impact, doubler plates were added. At low areas of water pressure between the doubler plates, the bottom plating is only supported by longitudinal stringers.
The intermediate frames are attached to the side shell and the chine knees by the angle clips to longitudinal stringers S6A, S6, and S5A. Additional support at each intermediate frame is provided with shallow former plates attached to the five stringers on and closest to centerline.
43
The specimen only represents the hull of the seaplane and not the entire fuselage, therefore longitudinal steel channels were fastened to the upper corners of specimen. These channels simulate the skin and frames that would exist on the fuselage above the test specimen’s 72 in waterline. In addition, for model testing purposes end plates were attached the specimen ends, which projected roughly one foot below the bottom of the specimen. Table 6
summarizes the frames, stiffeners, and plate properties used in the construction of the test specimen that is typical of Glenn L. Martin Structural design and construction.