A
A
N
N
A
A
L
L
Y
Y
T
T
I
I
C
C
A
A
L
L
T
T
E
E
C
C
H
H
N
N
I
I
Q
Q
U
U
E
E
F
F
O
O
R
R
V
V
I
I
S
S
U
U
A
A
L
L
I
I
Z
Z
I
I
N
N
G
G
B
B
U
U
F
F
F
F
E
E
R
R
O
O
V
V
E
E
R
R
F
F
L
L
O
O
W
W
A
A
T
T
T
T
A
A
C
C
K
K
S
S
C
C
O
O
M
M
B
B
I
I
N
N
E
E
D
D
W
W
I
I
T
T
H
H
C
C
O
O
D
D
E
E
P
P
O
O
I
I
N
N
T
T
E
E
R
R
I
I
N
N
T
T
E
E
G
G
R
R
I
I
T
T
Y
Y
C
C
H
H
E
E
C
C
K
K
I
I
N
N
G
G
T
T
.
.
E
E
.
.
A
A
k
k
h
h
i
i
g
g
b
b
e
e
-
-
M
M
u
u
d
d
u
u
,
,
F
F
.
.
T
T
.
.
I
I
b
b
h
h
a
a
r
r
a
a
l
l
u
u
,
,
A
A
k
k
i
i
n
n
w
w
a
a
l
l
e
e
A
A
.
.
T
T
Department of Computer Science, Federal University of Agriculture, Abeokuta, Nigeria
Abstract: A buffer is a region of physical memory storage that holds a specific amount of data and when that capacity is reached, the data will overflow. A buffer overflow is a condition where in the data transferred to a buffer exceeds the storage capacity. Buffer overflow is susceptible to attacks therefore, creates a necessity for intrusion detection systems. This paper combines code pointer integrity with buffer overflow visualization to address overflows attacks. During monitoring and detection stage, users are requested to introduce some data at a time and when an overflow is detected, the system will process and display appropriate buffer status. Colors are used to represent the different level of operations. A model to analyze the buffer behavior of the random process is derived. The effectiveness of our technique is confirmed through a visualization experiment. Result shows that transmission process is suspended when buffer overflows thus facilitate intrusion analysis.
Keywords: - Buffer-overflow, visualization, model and integrity check.
1.0 INTRODUCTION
In computer science, a buffer is a region of a physical memory storage used temporarily to move data between processes within a computer. Buffers are used for many purposes including: - interconnecting two digital circuits operating at different rates, holding data for later use, allowing timing corrections to be made on a data stream, collecting binary data bits into groups that can then be operated on as a unit, delaying the transition time of a signal in order to allow other operations to occur etc. Buffer has a storage capacity and can only hold a specific amount of data, and when that capacity has been reached, the data has to overflow to somewhere else. A buffer overflow is the condition where in the data transferred to a buffer exceeds the storage capacity of the buffer and some of the data overflows into another buffer, one that the data was not intended to go into [K+12].
The Internet is fast becoming useful in the communication and commercial sectors of our everyday life. This had led to increasing number of attacks designed to infiltrate or disrupt the activities being performed by companies and individuals on the internet. We mean the networks are under constant attack by malicious users, creating a necessity for intrusion detection systems. In this paper the problem of buffer overflow attacks is addressed. Buffer
platform being attacked. Here the attacker is abusing the victim program’s buffers to store the attack code. The attacker does not have to overflow any buffer to do this. It is already there: - often the code to do what the attacker wants is already present in the program’s address space [Jaw12, Chi06]. Ways to Cause the Program to Jump to the Attackers’ Code : - All of these methods seek to alter the program’s control flow so that the program will jump to the attack code. The basic method is to overflow a buffer that has weak or non – existent bounds checking on its input with a goal of corrupting the state of an adjacent part of the program’s state, e.g. adjacent pointers. Activation Records: - Each time a function is called, it lays down an activation records on the stack that includes, among other things, the return address that the program should jump to when the function exists, i.e. point at the code injected. Attacks that corrupt activation record return addresses overflow automatic variables i.e. buffers local to the function. By corrupting the return address in the activation record, the attacker causes the program to jump to attack code when the victim function returns and dereferences the return address [C+00]. This form of buffer overflow is called a “stack smashing attack”.
2.0 RELATED WORK
Computer networks complexity has increased lately so also the complexity of defending against cyber attacks. This has caused researchers to develop tools to aid the security analysts to make the data more bearable to sort and understand. More recent research has focused on identifying the threats and impact of attacks to the computer network. Intrusion detection systems (IDS) analyze network traffic for malicious activity [VC12]. When potentially malicious or suspicious activity is detected, alerts are sent to the security analysts. When alerts are generated, analysts must quickly determine whether the activity has any current or future negative impact on the monitored network. [SB12] stated that intrusion detection systems are protective measures such as virtual private networks, authentication mechanisms or encryption techniques are very important to guarantee information security. They help to defend against the various threats to which networks and hosts are exposed to by detecting the actions of attackers or attack tools in a network or host – based manner with misuse or anomaly detection techniques. [A+12] expressed further that IDS should be situation aware in the sense that at any point in time it should know what is going on in its environment regarding attack instances. He made an important step towards this goal by introducing and evaluating a new technique for alert aggregation. [BP12] suggested that alerts
that belong to one attack instance must be generated to analyze the ongoing attack instances. Most existing IDS are optimized to detect attacks with high accuracy. However, they still have various disadvantages that have been outline in a number of publications and a lot of work has been done to analyze IDS in order to direct future research [SP12]. Another approach to buffer overflow alert correlation is presented by [SB12], where a weighte d attribute - wise similarity operator is used to decide whether to fuse two alerts or not. However, this approach suffers from high number of parameters that need to be set. The similarity operator presented in [KI12] has the same disadvantage – there are lots of parameters that must be set by the user and there is no or only little guidance in order to find good values. In [KI10], another clustering algorithm that is based on attribute- wise similarity measures with user defined parameters is presented. H owever, a closer look at the parameters setting reveals that the similarity measure, in fact, degenerates according to the source and destination IP addresses and ports of the alerts. The draw backs that arise therefore are the same as those mentioned above. In [Jaw12], three different approaches are presented to fuse alerts. The first group alerts according to their source IP only. The other two approaches are based on different supervised learning techniques. Besides a basic least – square error approach, radial basis function networks and decision in trees are used to decide whether to fuse a new alert with an already existing alert [C+10]. Due to the supervised nature, labeled training data need to be generated which could be quite difficult in case of various attacks instances. Drawback is the large amount of alerts produced.
3.0 METHODOLOGY
3.1 BUFFER BEHAVIOUR MODEL
We assume a situation where we have a concentrating node which receives messages from a number of sources and transmits them over a single aggregate output channe l. We clearly have a situation where queue is important – the messages are queued in a buffer for transmission. The streams of messages generated from terminals or data from computers are usually not steady flows: - they are quite often sporadic or bursty [KK77, TS11]. The buffer’s capacity and its storage allocation strategy are of great importance for the cost effective design of a computer communication system. Therefore, the analysis of buffer behavior, particularly, of the buffer overflow probability is of considerable importance. Let us consider a discrete time system in which
k
data units arrive in the kth slot for transmission (or processing). During the same interval
k data units will be sent (or processed). We assume that the two processes{ ,
k k}
are such that the difference{ }
k is defined by:{ }
k =
k-
k 1
k
(1) Let L be the size of the buffer capacity. Sometimes the buffer will be completely full and at these times the excess{ }
kof arrival over service will be lost and we call this event a buffer overflow [Chy12]. The traffic intensity
(2)Following [Ken53] notation, a queue may be specified in the form A/B/C/K/m/Z. Hence A specifies the inter – arrival time distribution, B the service time distribution, C the number of ser vers, K the system capacity, m the number in the source and Z the queue discipline. The shorter notation is used here: (M/M/1). This is a single server queue distribution model with exponential inter- arrival and service time distribution [Chy12]. We are considering a queue system with an arrival rate
, service rate
and a probabilityP t
t( )
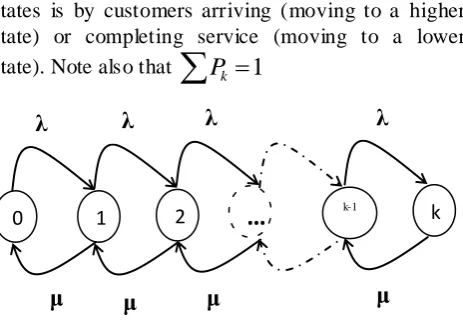
of having k – customers (including that being served at time t). In computer communication syste m, a customer is typically a message, packet, job, transaction etc. It is the unit of operational flow through a queuing system known in the traditional language of queuing theory [CKO11, NM10]. The system is represented by a state diagram (figure 1) where state k corresponds to having k – customers in the system. Movement between thestates is by customers arriving (moving to a higher state) or completing service (moving to a lower state). Note also that
P
k
1
Figure 1: state space diagram
The state
S
kcorresponds to the queuing system containing K – customers and occurs with a probabilityP
k. Let’s consider first the two states0
S
(empty system) andS
1(a single customer). The state moves fromS
0 toS
1 by a customer arriving and the change occurs with frequency
P
0. Similarly the state moves fromS
1 toS
0 by the customer completing service, and the change occurs with frequency
P
1. In equilibrium (steady state) the two must be equal and0 1
P
P
(3)Considering the pro babilities of entering and leaving
S
1, we have that0 2 1 1
P
P
P
P
(4)But as
P
0
P
1 , we ha ve
P
1
P
2 in general,1
k k
P
P
(5)Setting
and simplifying forP
k, we have0 k k
P
P
(6) Since the unknown quantities are probabilities, the sum of all probabilities is:p
0
p
1p
2
... 1
i.e.0 0
k
k
P
= 1 (7)0 1 2
…
k-1 kλ
λ
λ
λ
As
P
0 is the probability that the system is idle and
is the probability that the system is busy, it is clear that0
1
P
(8) Using the sum of geometric series, we obtain(1
)
kk
P
(9) The mean number of customers in the system, N is0 0
(1
)
kk
k k
N
kP
K
(10)Which gives
1
N
(11)As the average number being served is
, the average number waiting in the queue isN
i. e.
1
q
L
= 2
1
(number in queue) (12)Applying little’s formula, which states that if the N – customers are in the system for an average time T, Then
N
T
(Little’s formula), the time spent waiting is,q q
L
W
= 2
1
1
( )
( )( )
1
1
=
1
1
time in queue (13) Average time in the system,1
1
N
W
(14)Multiplying by
,
W
1
(15)For the finite buffer case, we denote the buffer occupancy sequence by {bk }, and defined as,
bk-1 + Ck
0
kb
bk + Ck0
b
k1
c
kL
L b
k1
c
k (16) And compare it with{ }
k defined as,1
max{0,
}
k k
c
k
(17)1
min{ , max{0, }} max{0, }
1 1 1b
L
c
c
(18)We assume that
b
k
k for some k, then for k+1:
min
L
,max 0,
b
k
C
k1
1 k
b
min{ , max{0,
L
k
c
k1}}
max{0,
k
c
k1}
k1} (19) Thus we have shown by mathematical induction thatk k
b
kSince the maximum value that
b
k can take isL
, it follows that,{
k}
{
k}
P b
L
P
L
For all k (20) Let us denote the distribution of the random variablesk
b
and
k in the limit ask
byP n
L( )
and( )
P n
respectively.Then equation (20) becomes,
( )
( )
(
1)
L x
n L
P L
P n
F L
(21)Where
F
x is the distribution function of x.Solving for the upper bound, the probability of buffer capacity L is full,
0
( 1)
( )
LL z
P L
B
B
Z*0 (L1) (22)Where
0
z
B
the root of the characteristic equations determined by the input and output statistics.The quantity
P
overflow( )
L
is therefore defined as,( )
overflow
offeredload carriedload
P
L
offeredload
=
k kE
Where
k is the expected amount of data lost per time in slot k and this upholds equation (1).3.2 Implementation
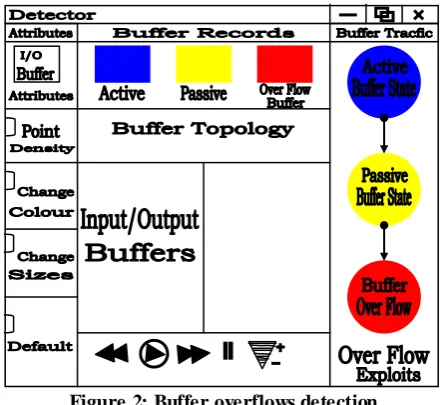
We combine the tasks of monitoring and detecting buffer overflow into one unique system interface. As shown in figure 2, our interface is composed of three windows:- buffer topology windows (bottom middle), and target window (right) and history window (top left). The topology window visualizes the current buffer topology, where users can interact with the topology with several routines tasks. The target window lists the different level of the buffer during operation with overflow indicator. We also collect information of each level of buffer operation for analysis, such as traffic history :- ( buffer density, inbound and out bound). To handle buffer overflow attacks in real time environment, we need to integrate user interaction with our buffer overrun detection and visualization methods. During the detection, the users are only required to introduce some sizable digits at a time and when an overflow is detected, the system will automatically process the detection result. Colors are used to represent the different level of operations – red indicating a possible overflow, blue color indicates active behavior of the buffer and yellow color indicates passive behavior of the buffer [S+10]. The top left locates the history window, bottom left includes parameter window and topology interaction window and the right lists the information of the potential buffer state.
Figure 2: Buffer overflows detection
4.0 EVALUATION
In our sample evaluation, we combine the task of monitoring and detecting buffer overflow into one unique interface. Our basic idea is to visualize the buffer status during transmission to prevent buffer overflow. We Create tcp client socket in connecting to server and
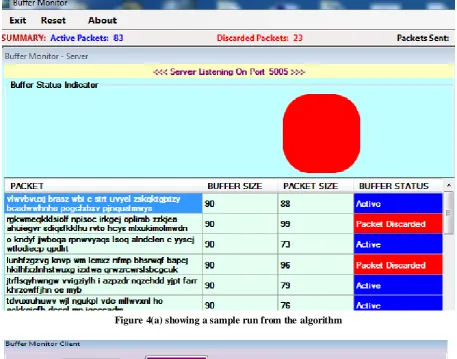
this is shown in our algorithms (figure 3a and 3b). The main loop of the algorithms, generate the data to send (here we generate random text using a user defined functions). It converts the data to send to array of bytes and check if the bytes to be sent are greater than the buffer size (step 8) and (step 8.1) of the buffer algorithms. Colors are used to represent the different level of operations – red indicating a possible buffer overflow, blue color indicates active behavior of the buffer and yellow color indicates passive behavior of the buffer. When buffer is overflowing, the transmission is suspended till the buffer queue is eased out. The sent data is displayed on the client output window and increases the number of sent packets by 1. The received data is displayed on the server output window and increases the received packets by 1. A sample run of these algorithms is displayed in figure 4(a) and 4(b) respectively.
BUFFER MONITOR ALGORITHM: CLIENT
Step 1: Obtain server IP and port number
1.1 Create a variable to hold the server IP address
1.2 Create tcp client socket to use in connecting to server.
1.3 Declare and initialize variables: Sent, Vs=0; Received, Vr=0; Discarded, Ds=0 Step 2: Connect to the tcp server using the tcp client
Step 3: Generate the data to send (Here we generate
random texts using a user defined functions our data)
Step 4: Compute the checksum of the data to send
Step 5: Make the checksum value a 10-digit string by
padding 0s to the beginning of the value if the number of digits of the computed value is less than 10.
Step 6: Append the 10-digit checksum value to the beginning of the generated data to be sent
Step 7: Convert the data to send to array of bytes.
Step 8: Check if the byte to be sent is greater than the
buffer size.
8.1 If packet size > buffer size discard packet. Set Ds=Ds+1
Else Send byte data to server
Step 9: Display appropriate buffer indicator. Yellow when it is passive, Blue when active and Red when packet has been discarded.
Step 10: Display sent data on the client output
window and increase the number of sent packets by 1 10.1 Set Vs=Vs+1
10.2 Wait for response from server. Server is of the format CHECKSUM#ACK
Step 11: Receive response from server
11.1 Check if received message ends with the string #ACK
11.3 Display received data on the server output window and increase the number of received packets by 1.
Set Vr=Vr+1
Step 12: Close tcp client socket
Step 13: End
Figure 3a: Buffer monitor algorithm- Client
PACKET COUNTER ALGORITHM: SERVER
Step 1: Obtain IP and port number
1.1 Create a variable to hold the server IP address
1.2 Create tcp listener to use in listening to connection from clients.
1.3 Create tcp socket to use in receiving data/sending response to client
While (server is still running) Begin
Step 2: Initialize tcp listener
Step 3: Start listening for connection at a specific port (5002 used for this implementation)
Step 4: Initialize the receiving buffer. Buffer size used is 8192 bytes
Step 5: Tcp socket accepts an incoming connection
Step 6: Read the received message from the buffer and convert it to characters.
Step 7: Store the converted message in a string variable Step 8: Extract the first 10 digits which is the checksum value and store in a variable chk
Step 9: Extract the main message from position 11 to
the end and store in variable msg
Step 10: Compute the checksum value for the
message stored in msg and store in variable
chksum. Pad up the checksum value with 0s
to make it a 10-digit string
Step 11: Compare the value of chk(received
checksum) and chksum(computed checksum) Step 12: If (chk = chksum)
12.1 Display the received message on the standard output device
12.2 Send an acknowledgement message with the format
chksum#ACK to the client
Step 13: Close tcp socket
Step 14: Close tcp listener End While
Step 15: End
Figure 3b: Buffer overflows Algorithms - server
4.1 Experimental Result
In order to merit the simulation model, appropriate statistical methods are essentially required to validate and verify the simulation results.
One way to achieve this is by using a statistical technique and determines the precision of our model. Let X be the number of repeated independent trials
and the measure of probability, P(x), associated with our x – variable is determined by x’s relative position with respect to the mean and standard deviation of the distribution. A binomial variable is discrete, whereas the normal random variable is continuous, therefore, we use a histogram to illustrate that the area of each bar over the value of x has an area equal to the probability (figure 5). The addition and / or subtraction of (0.5) to the x – value involved is commonly referred to as the continuity correction factor [Jon76]. It becomes our method for converting from a discrete to a continuous variable. Now let’s look at a normal distribution and the probability representation therein. We first need a normal distribution with a mean and standard deviation, mean,
np
,
npq
and the number of trials , n is 8. Therefore,
4
,
1.4
and the key to working with normal distribution is the standardscore,
x
Z
Recall that one of the basic properties of probability is that the sum of all probabilities is exactly 1.0. Since the area under the normal curve must be exactly one unit, then the area under the curve to the right of the mean is exactly
1
2
unit, and to the left, itis also
1
2
unit.P(0.5 ˂
Z
˂1.5) =0.5 4
1.5 4
1.4
1.4
P
P
< Z
= 0.04
P (1.5 < Z < 2.5) = 0.17, P (2.5 < Z < 3.5) = 0.34 P (3.5 < Z < 4.5) = 0, P (4.5< Z < 5.5) = 0.31 P (5.5 < Z < 6.5) = 0.16, P (6.5 < Z < 7.5) = 0.04 P (7.5 < Z < 8.5) = 0.01
Result obtained shows that suspending transmission when buffer overflows greatly reduces the c hance of buffer overflow attacks while preserving the functionality and
performance of the systems. Thus improving the effectiveness of intrusion response
Figure 4(a) showing a sample run from the algorithm
Figure 4(b) showing a sample run from the algorithm
5.0 CONCLUSION
This paper presents an analytical technique for visualizing buffer overflow attacks. Buffer overflow occurs when the aggregate arrival rate exceeds the buffer service rate, causing the buffer to fill and overflow. Buffer overflow is susceptible to attacks
buffer queue eases out. Thereby reduces the chance of buffer overflow attacks while preserving the functionality and performance of the existing systems. The effectiveness of our technique is confirmed through a visualization experiment thus facilitate intrusion analysis.
6.0 REFERENCES
[AA04] A. A. Akintola, M. O. Adigun -
Performance Analysis of doubles Buffer Technique (DBT) Model for mobility
Support in wireless IP Network,
Obafemi Awolowo University, Ile-Ife Nigeria. Proceedings of the 15th National Conference of computer Association of Nigeria (COAN), Vol.10, pages 204 -211, (2004).
[BP12] V. Bhoopathy, R. M. S. Parv athi -
Securing Node Capture Attacks for Hierarchical Data Aggregation in wireless Sensor Networks, International journal of Engineering Research and Applications, Vol. 2, Issue 2, pages 466 – 474 (2012).
[Chi06] Davide Chiarella - Worm Detection: A Monitoring Behaviour Based System, Doctorial Thesis, Scuola di Dottorato in
Scienzee Tecnologie per
I’Informazionee La Conoscenza, (2006). [Chy12] Andrzej Chydzinski - A Unified
Method of Analysis for Queues with Markovian Arrivals: Mathematical Problems in Engineering, Vol.12, Article ID 831956, 18pages. Institute of Informatics, Silesian University of Technology, Akadmicka 16, 44 – 100 Gliwice, Poland. 18 pages (2012). [C+00] Crispin Cowan, Calton Pu, Dave Maier,
Heather Hinton, Peat Bakke, Steve Beattie, Aaron Grier, Perry Wagle, Qian Zhang - StackGuaurd: Automatic Adaptive Detection and Prevention of Buffer Overflow Attacks, In 7th UNISEX Security Conference, pages 63 – 77 San Antonio, January (2000)
[Jaw12] Smita Jawale - Intrusion Detection System Using Virtual Honey pots, International Journal of Engineering Research and Applications, ISSN: 2248 – 9622, Vol. 2, Issue 2, pages 275 -279, (2012).
[Jon76] Robert Johnson - Elementary Statistics.
2nd edition, wadsmont Publishing
Company Inc, Belmont Calfornia, pages 218 – 242, 1976.
[CKO11] Jacques J. F. Commander, Siem J. Koopman, Marius Ooms – Statistical Software for State Space Methods,Journal of statistical software, Vol.41, Issue 1, 2001. [Ken53] G. Kendall - Stochastic Processes
occurring in the Theory of Queues and their Analysis by the Method of Imbedded Markov Chain, Ann. Statist. Vol. 24, pages 338 – 354, (1953). [KI10] K. R. Karthikeyan, A. Indra –
Intrusion Detection Tools and
Techniques – A Survey, International journal of Computer Theory and Engineering, Vol. 2, No. 6, pages 901 – 906 (2010).
[KK77] Hisashi Kobayashi, Alan G. Konhein -
Queuing Models for Computer
Communications System Analysis, IEEE Transactions on Communications, Vol. com – 25, No. 1, January 1977.
[NM10] Lopamudra Nayak, Natarajan Meghanathan - On Approaches for Detection and Resolution of Buffer Overflow Attacks. International Journals of Research and Reviews in Computer Science, Vol. 1, No. 14, Dec. (2010). [S+10] Stephen Schmidt, Rainer Bye, Joel
Chinnov, Kerstin Bsufka - Application – Level Simulation for Network Security, in proceedings of the 38th annual symposium on simulation vol. 86, No. 5- 6, pages 311 -330, (2010).
[SP12] B. Saikiran, N. Prasanna Balaji -
Hacking Attack Alerts with Generative Data Stream. International Journal of Advanced Computer and Mathematical Sciences, ISSN 2230 – 9624, Vol. 3, Issue 4, Pages 430 – 436 (2012).
[TS11] Branimir Trenkic, Mihajio Stefanovic
- One Approach in Evaluating the Overflow Probability Using the Infinite Fluid – Flow queue. Series Electrical Energy, Vol. 24, No.1, pages 1 – 8, April (2011).
[VC12] S. Vasanthi, S. Chandrasekar –