Abstract—Non Destructive Evaluation (NDE) is the method of evaluating material or object without to damage or make worse. This method is used in process and quality controls and it is also used to evaluate of aircraft, power plants, turbines, nuclear reactor. Electro thermal model is used to find the defects in metals, semiconductor and composite materials etc. till now research has not been taken place to find the defects in coating which leads to this research proposal. This proposed work will find the defects in coating by using electro thermal model based on MATLAB programming.
Keywords- NDE; Active thermograph; NI 316L SS coating; RC Analytical model;
IINTRODUCTION
Non Destructive Testing (NDT) refers to all test methods, which permit testing or inspection of an object without affecting it is future usefulness. In an industrial, the NDT is to check the materials or components for satisfactory performance of its intended function. The aim of NDT is the detection of damage of like flaws, inclusions, materials loss. The starting NDT was used two controls one is process control and second one is quality control. Now NDT are used worldwide and it have become a vital ingredient of modern engineering practices to achieve the required standards of quality in manufacturing, leading to enhanced reputation and profits for accompany[4,6]. NDT use not only of improving quality in the sense of ensuring operational safety and reliability, but it also of providing test inspection system used in manufacturing to optimize production. In the modern NDT are dividing of following categories where it plays an important role:
• Material property measurements
• Process design for materials manufacturing. • Online process control
• Quality control as various stages of manufacturing are completed.
M.R.Geetha Devi, Assistant Professor, Department of Electronics and Instrumentation Engineering, Asan Memorial College of Engineering and Technology, Tamilnadu India. (e-mail: [email protected]). J.Densi, Assistant Professor, Department of Computer Science Engineering, Asan Memorial College of Engineering and Technology, Tamilnadu India. (e-mail: [email protected]).
Fig:1.Thermal NDT approaches
Infrared and thermal testing methods are characterized by the use of thermal measurements of a test object as it undergoes a response to a stimulus. Thermal imaging cameras are the most sensing method. Electronics may be used to detect hot spots indicative of problem. The Imaging of objects after the application of energy can be used to monitor the flow of heat in the object, which is a function material properties as boundaries.
II ELECTRO THERMAL MODELING
Active thermography can be modeled in terms of electrical equivalent circuit by using the correspondence between the fundamental laws of heat transfer and electricity. One dimensional (1D), two dimensional (2D) and three dimensional (3D) electro-thermal models used for obtaining direct solutions of NDT problems. These models can be used to simulated and design of varies of circuit simulators, without the need of thermograph software. Further electro-thermal models of samples can be generated by a small computer MATLAB programming family of circuit simulators[3]
The equivalence of heat conduction to a specific circuit model can be most easily visualized by directly comparing the differential equations describing voltage variation in a lossy transmission line having
Quality Assurance of Coating by Using Electro
Thermal Model
negligible inductance and leakage, with that describing temperature variation in 1D heat conduction. Temporal (t) and spatial (x) temperature (T) variation resulting from 1D heat flow in material is described by
t
T
k
c
x
T
2 2
(1)
where ρ, c, and k are the mass density, specific heat and thermal conductivity of material respectively. The above equation can be expanded as,
t
T
d
A
k
C
x
T
.
.
'
2 2
(2)
where C’ is the heat capacity of a small element of thickness Δd and area of cross section A. Similarly, the differential equation describing temporal and spatial voltage(V) variation, in a loss transmission line having negligible inductance and leakage, is given by
t
V
C
R
x
V
l
l
2 2
(3)
Where Rl and Cl are the resistance per unit thickness and capacitance per unit thickness respectively. This above equation can also be expanded as
t
V
d
A
C
x
V
e
2 2
(4)
Where C is the electrical capacitance of a small element of thickness
d
, having cross –sectional area A and electrical conductivity
e. the apparent physical correspondences are from Eq.(3) and Eq.(4)
T
V
,k
e
,C
,
C
A coating thickness
d
, cross sectional area A, thermalconductivity k, density
and specific heat C, can be electrically modeled by an equivalent resistanceR
and capacitanceC
, using above equivalence between thermal and electrical parameters
kA
d
R
(5)
C
A
dc
(6) Correspondence the above equation are use to find theresistance and capacitance in varies regions[5]. These work was doing in both one dimensional and multi dimensional. The one dimensional heat conduction problem can be modeled electrically by dividing the given thickness of coating into smaller sections, with corresponding R and C values for each section, as stated in Eq.(5) and Eq.(6). Figure 2 shows the equivalent electrical model of one dimensional transient heat conduction model and it having a heat source at one end and another end it having reverse bias diode or high value of resistance for active thermography[2].
Fig: 2: One dimensional equivalent electrical model of heat conduction for active thermography
III ANALYTICAL MODELING
A semi infinitely extended material, heated from one side can be modeled electrically by an infinite RC ladder fed with a current source at the heating end. The voltage at this end will correspond to the surface temperature at the semi infinitely extended coating and an expression for it can be obtained by the Laplace transform technique of network analysis. Following the electro-thermal approach similar to that described, an electrical model for stepped thermo graphy and its analytical solution for estimation of defect area. By using absolute thermal contrast saturation to estimation of defect area. It is purely analytical method and it does not require any cure fitting techniques. An actual material having a defect, behaves as lumped over the defect and non-defect regions after some time of heating . Therefore a lumped electrical model has been used for extraction of information related to defect area, from the later time region of the temperature evolutions. According analytical equations the rate of rise in temperature over the defect should be greater than over the non defect region because of smaller thickness of coating over the defect. However, this happens only initially, because coating over the defect is connected laterally with non defect coating, However, this happens only initially, because material over the defect is connected laterally with non-defect material, due to which after some time, the temperature over the defect and non defect regions increases linearly at the same rate. After that it saturates the absolute thermal contrast. The analysis of the proposed electrical model shows a similar type of behavior[1].
C C C
I
q
R / 2
R / 2
Fig:3: Lumped RC model for defect area estimation
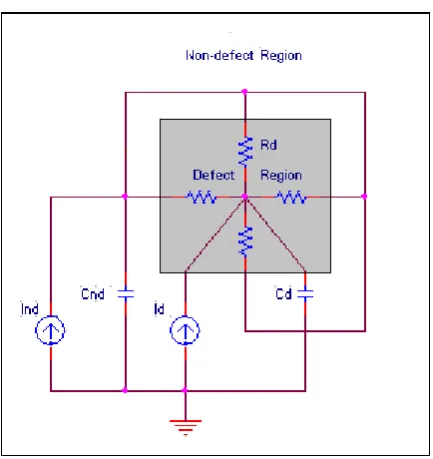
In Fig 3shows the lumped electrical model with connect defect and non defect parameters in parallel to estimate the defect area. In this model, the equivalent electro-thermal capacitances of the nickel coating over the defect region Cd
and the non defect region Cnd are connected between foure
equal parallel resistances Rd, the corresponding to the
thermal resistance over the defect region in lateral dimensions. The capacitors Cd and Cnd are fed by step current
sources Id and Ind, corresponding to the products of incident
heat flux F with the areas Ad and And, of the defect and the
non defect regions, respectively. Using Eq.(5) to Eq.(7), the thermal equivalence of the electrical quantities of this model are obtained, and given in a simplified circuit (Fig. 3), having a single resistance r, equivalent to the foure parallel resistances Rd. Voltages at node 1 (Vd) and node 2 (Vnd) in
fig.4 are analogous to temperatures at the centre of the defect Td and the non-defect Tnd regions, respectively[5]. To prove
the analogy between thermal and electrical by using fig.4 after apply the KCL on the circuit. In this circuit two current sources are used, one is source side and another one is output side are connected. The temperature of defect and non defect and also voltage of defect and non defect regions of equation derived from fig.6. By using this equation it will get good accuracy of analogy between thermal and electrical, in this process here using MATLAB programming. This is good for get accuracy of results as compare to stimulant. In this process is possible only for analytical. In simulation process also some time easy, but it will take some time as compare to MATLAB programming process of simulation results.
Fig:4: Simplified lumped electrical model with equivalent thermal parameters
Applying Kirchhoff’s current law at nodes 1 and 2, and transforming to the frequency domain, results in
s
C
V
r
V
V
s
I
d d nd d d
(10)s
C
V
r
V
V
s
I
nd nd nd d nd
(11)Vd and Vnd in the frequency domain, can be obtained by
solving the above equations,
)
(
)
(
2sr
C
C
C
C
s
sr
C
I
I
I
s
V
nd d nd d nd d nd d d
(12))
(
)
(
2sr
C
C
C
C
s
sr
C
I
I
I
s
V
nd d nd d d nd nd d nd
(13)After apply the inverse Laplace transformer in above equations on both sides, then the equation are shown as follows Vd and Vnd in the time domain,
2 ) ( exp 1 ) ( ) ( ) ( nd d nd d nd d nd d d nd nd nd d nd d d C C C rC t C C I C I C rC C C t I I t V (14)
2 ) ( exp 1 ) ( ) ( ) ( ) ( nd d nd d nd d nd d d nd d nd d nd d nd C C C rC t C C I C I C rC C C t I I t V (15)Each of the above equations has two terms: one varying linearly and the other one is exponentially with time. The difference between Eq.(14) and Eq.(15) will corresponding to the absolute thermal contrast, which is given by,
d nd
nd d nd d nd d d nd nd d C C C rC t C C I C I C r t V t V exp 1 ) ( ) ( (16)
d
d
A
t
d
d
A
k
F
cd
Ft
t
Td
d
d d
d
8
8
exp
1
)
(
(17)
d
d
A
t
d
d
A
k
F
t
T
t
T
d
d d
d
nd d
8
8
exp
1
)
(
)
(
(18)
Solving above Eq.(17) and (18) results in
cd
Ft
t
T
nd
)
(
(19)This is similar to Eq. (8), which showed the temperature over the non-defect region increasing linearly with time. After sufficient heating time, depending on the thermal diffusivity and area of the defect, the second term of Eq. (17) will reach its saturation value. The result of the saturation of absolute thermal contrast, ΔTsat, given by
d
d
d
d
A
k
F
t
T
t
T
T
d d d nd
d sat
8
)
(
)
(
(20)From above equation the area of defect as in terms of ΔTsat,
d
sat d d
d
d
T
d
d
F
k
A
8
(21)By using above equation to finding the defect area
Where dd is the defect depth, ΔTsat is absolute thermal
contrast and F is the known values of heat flux, k is the thermal conductivity, and d is thickness of coating. As explained earlier, using the distributed RC model, the initial temperature evolution over defect and non defect regions increase at constant rate a with the square root of time, where
c
k
F
a
2
1
(22)The above equation is similarly to Eq. (19), it is based on the lumped model, which holds after some time of heating, shows that the temperature over the non defect region increases at a constant rate b with time, where
cd
F
b
(23)Both a and b can be obtained from the corresponding slopes of the temperature evolution curves. The value of k/F can now be obtained from Eqs. (22) and (23) in terms of a, b and d and substituted in Eq. (21), to give defect area as shown
d
sat d d
d
d
a
T
d
bd
A
2 2
32
(24)
Further substituting the value of dd in the above equation
will give
1
32
2 2
td tnd
sat
t
t
a
T
bd
Ad
(25)
By using above equation to find the defect in terms of parameters it can be obtained directly from the temperature
and voltage evolution curves. It is especially advantages in situations where coating properties.
IV SIMULATION RESULTS
This section provides an simulation results temperature and voltage plots at 75um coating thickness for electro thermal RC modeling by using analytical equations from Eq.(14) to Eq.(20). In this section the simulation results plots in between the temperature and voltage with time and square root of time at different coating thickness of NI 316L STEEL SUSTRATE[3]. For a coating thickness of 75um, the MATLAB simulated result are shown in fig 5 to fig 6
Fig: 5Time Vs Temperature (75um coating thickness)
Fig: 6 Time Vs Voltage (75um coating thickness)
From the above given simulated results fig.5 and fig.6, the voltage and temperature plots are analogy it can be proved from the expressions derived in Eq.(14) to (20). Hence, the simulated results based on the analytical expressions proves that the voltage is analogous to temperature[1].
Fig: 7 Square root of time Vs Temperature (75um coating thickness)
Fig: 8 Square root of time Vs Voltage (75um coating thickness)
Table:1:
Comparison between temperature and voltage plots at75 um coating thickness for physical properties of nickel
Plots Defect Non defect Thermal
contrast
Temperature(oC )
15 8.8 6.2
Voltage(Volts) 16 9.8 6.2
V CONCLUSION
A simplified quality assurance of coatings by using electro thermal model for defect area and defect depth estimation by stepped infrared thermography has been presented. A purely analytical expression for defect area, in terms of defect depth and other parameters of the surface temperature evolution, has been derived from the proposed model using Laplace transform technique of network analysis. This is required for obtaining an accurate value of absolute thermal contrast, in order to estimate defect area and defect depth and also the analogy between voltage and temperature has been observed. Through the analytical expression simulated temperature plots and voltage plots at over etched and non etched regions as well as their difference
(absolute thermal contrast) regions by using MATLAB Programming.
6. Recommendations
The present work mainly deals with quality assurance of coating by using electro thermal model for defect depth by stepped infrared thermography. This work was mainly based on one dimensional electrical model of heat conduction for active thermography. A similar electro-thermal approach can also be implemented to two dimensional and three dimensional of active infrared thermography for obtaining direct and inverse solutions.
Image processing techniques can be introduced for reducing noise in thermal data. Software can be developed incorporating the proposed solutions for nondestructive evaluation of coatings.
REFERENCES
[1] Aamodt LC, Spicer JWM, Murphy JC. “Analysis of characteristic thermal transit times for time-resolved infrared radiometry studies of multilayered coatings”. J Appl Phys 1990;68(12):6087–98.
[2]Badghaish.A.A and Fleming.C.D, “Nondestructive inspection of composite using step heating thermography,” Proceedings of the American Society of Composites 22nd Technical Conference, Sept. 17-19, 2007, Seattle, WA, (2007).
[3] Brancik.L “Programs for fast numerical inversion of Laplace transforms in MATLAB language environment,” Sbornik 7. Proc. MATLAB 99, Prague, 27-39 (1999).
[4] Clark, M. R., McCann, D. M., and Forde, M. C. (2003). "Application of infrared thermography to the non-destructive testing of concrete and masonry bridges." NDT & E international, 36(4), 265-275.