Volume 3, Special Issue 1, ICSTSD 2016
Performance Evaluation of Flat Slab using
Pushover Analysis
Sayali A. Baitule
PG Student, Department of Applied Mechanics, Government College of Engineering Amravati 444604, Maharashtra, India
Prof. Ashish R. Akhare
Assistant Professor, Department of Applied Mechanics, Government College of Engineering
Amravati 444604, Maharashtra, India [email protected]
Abstract:
Flat slab buildings are becoming popular from architectural and aesthetic point of view and gaining importance as they have many advantages like reduced building height, shorter construction time, easier formwork, large clear ceiling height, easier reinforcement placement. So, construction of flat slab building is rapidly increasing everywhere including in high seismic zone. But performance of flat slab building in high seismic zone is very poor. Also in present era, modified storey height can be seen on various stories according to demand of structure. Large ground storey height is very common feature in the multistory construction. Some construction demands less ground storey height which can be possible by providing flat slabs in the building. Now a day, in modern multistory construction sometime it is needed to provide large or less floor to floor height at any intermediate storey which may cause collapse of structure during earthquake. In the present study performance of flat slab building with an effect of modified storey height at same storey and at various stories is evaluated by using pushover analysis. Also the performance of flat slab building with different number of bays and different number of stories is evaluated. Pushover analysis was performed by using ETABS software. Response in the form of capacity curve, demand capacity curve, plastic hinge mechanism and storey drift for models having different number of bays, different number of stories, modified storey height at same storey and modified storey height at various stories is obtained and compared.
Keywords—Flat slab; pushover analysis; storey height; bays; storey drift.
I. INTRODUCTION
A. Flat Slab
The flat slab is a slab directly supported by column without beam. The flat slab system since its inception in the USA by Turner in 1906 has been gained popularity all over the world [2]. The flat slab is often thickened close to the supporting
column which is known as drop to provide adequate strength in shear. In some cases, the top section of the column where it meets the floor slab or drop panel is enlarged which is known as column capital. Column capital increases the perimeter of the critical section, for shear and hence increases the capacity of the slab for resisting two-way shear and to
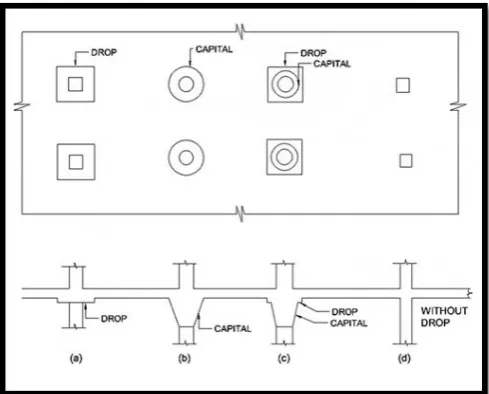
reduce negative bending moment at the support. In some cases beams are used where the slab is interrupted, as around staircases and discontinuous edges of slab [6]. If no drop or column capital is present in the system, the system is referred to as flat plate. Flat slab can be classified into following types according to demand of structure:
a) Flat slab with drop panel and without column capital. b) Flat slab with column capital and without drop panel. c) Flat slab with drop panel and column capital. d) Flat slab without drop panel and column capital.
Following Figure shows the different types of flat slab.
Fig.1 Types of flat slab
B. Pushover Analysis
Volume 3, Special Issue 1, ICSTSD 2016 when the building is subjected to design level ground
excitation. [11]
Fig. 2 Illustration of Pushover Analysis [11]
The pushover analysis generates the relationship between base shear (V) and roof displacement (∆roof) which is known as
pushover curve or capacity curve. The capacity curve and demand curve are plotted in the Acceleration Displacement Response Spectrum (ADRS) format which is having spectral displacement along horizontal axis and spectral acceleration along vertical axis. A point where the capacity curve intersects the demand curve is called performance point.
The pushover analysis requires the development of the force-deformation curve to know the critical sections of beam and column. The force-deformation curve is as shown in Figure 3. In this figure,
Point A corresponds to the unloaded condition.
Point B represents yielding state of an element. The stiffness reduces from point B to C.
Point C represents the nominal strength.
Then there is sudden reduction in lateral load resistance to point D, the response at reduced resistance to E and final loss of resistance thereafter.
The points between B and C represent acceptance criteria for the hinge, which are Immediate Occupancy (IO), Life Safety (LS) and Collapse Prevention (CP).
Fig. 3 Pushover curve with performance level [11]
i. Operational: This is the performance level related to functionality. Damage to the building’s structure is limited so that continued safe occupancy is not in question, and any required repairs are minor and can
be carried out without significant disruption to occupants.
ii. Immediate occupancy: This corresponds to the most widely used criteria for essential facilities. The structure’s space and systems are expected to be reasonably usable. Contents may be damaged. iii. Life safety: This level is intended to achieve a
damage state that presents an extremely low probability of threat to life safety, either from structural damage or from falling or tipping of nonstructural component.
iv. Collapse Prevention: This damage state addresses only the main structure frame or vertical load carrying system and requires only stability under vertical loads. The Various Performance levels are tabulated below with their affects on both Structural and Non-structural elements
.
II. LITERATUREREVIEW
Altuntop, Mehmet Alper [3] presented a paper on ‘Analysis of Building Structures with Soft Stories’. The objective of this paper is to determine the nonlinear behavior of the building structures having soft first stories by nonlinear static pushover and time-history analyses and to evaluate the accuracy and effectiveness of these methods. Several two dimensional analytical models with various number of stories and spans are investigated with nonlinear static pushover and nonlinear time history analysis methods by considering various first story heights and deformation levels. In view of these analysis results, the soft story behavior is investigated and the facts, reasons and results of this irregularity are explained in detail. In addition, various codes are evaluated considering the soft story irregularity and the provisions of these codes are summarized Triandas Srikanth [6] presented report on ‘Non-linear Pushover Analysis of Flat Slab Buildings with and without Seismic Retrofitting’. In this report the lateral behavior of a typical flat slab building which is designed according to IS:456-1978 is evaluated by means of non-linear pushover analysis. The inadequacies of these buildings are discussed by comparing the behavior with that of the conventional beam-column framing. The effect of retrofitting schemes is also studied..K. Soni Priya et.al. [7] presented a paper on ‘Non-Linear Pushover Analysis of Flat Slab Building by using SAP2000’. In this paper, pushover analysis was performed on (G+2) building with flat slab and resulting pushover curve is plotted. It is concluded that curve is initially linear but start to deviate from linearity as the columns undergo inelastic actions. Ravindra B N et.al. [8] presented paper on ‘Dynamic Analysis of Soft Storey Building with Flat Slab’. For linear and nonlinear analysis 5, 10 and 15 storey buildings modeled by using ETABS software considering response reduction factor, importance factor, zone factor, damping ratio, base shear and hinge reactions are obtained
Volume 3, Special Issue 1, ICSTSD 2016 The flat slab buildings with different parameters are
considered in this study. Effect of different number of bays, number of stories, modified storey height is taken to evaluate performance of flat slab building. Three storey and eight storey flat slab building having 2, 4, 6 bays are analyzed by using non-linear static analysis. Also the effect of modified storey height is considered. Storey height is modified as 2.5m and 5.5m. With these modified storey height total number of model reaches to 20. These structures are designed according to Indian Standards. Name of model is given in the format like (No. of stories-No. of bays-Modified storey no., modified storey height) e.g. (Model 3-4-5.5,1) represents model having 3 stories 4 bays with modified storey height of 5.5 m at first storey. Notation NOR is used for building having normal (3.5m) ground storey height. Other common data used for all flat slab models is given below.
TABLE I. PROPERTIESOFFLATSLABMODEL
1. Grade of concrete M25
2. Grade of steel Fe415
3. Normal storey height 3.5m
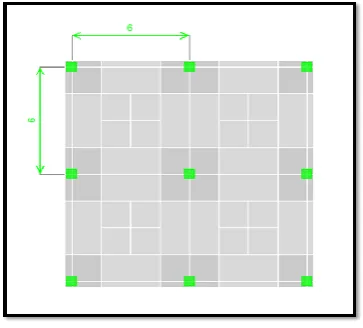
4. Size of panel 6m X 6m
5. Seismic zone IV
Following Figure shows the plan view of 8 storey 2 bays model:
Fig. 4 Plan showing 2 bays in both directions
With different number of bays, number of stories and storey height are also modified. Elevation and 3D view of flat slab building model 3-2-1,2.5 is shown below
.
Fig. 5 Elevation view of model 3-2-1,2.5
Fig. 6 3D view of model 3-2-1,2.5
IV. RESULTSFROMPUSHOVERANALYSIS
A. Capacity Curve
The pushover analysis generates the relationship between base shear (V) and roof displacement (∆roof) which is known as
pushover curve or capacity curve. The resulting capacity curves for the different flat slab models are shown below.
1) Capacity Curve for Modified Ground Storey Height
Volume 3, Special Issue 1, ICSTSD 2016
Fig. 7 Capacity curve for Modified Ground Storey Height
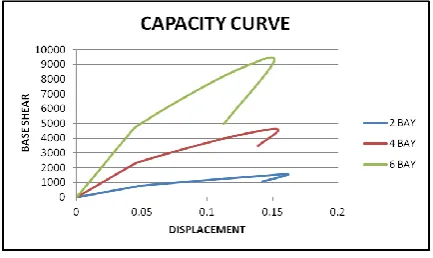
2) Capacity Curve for Different Number of Bays:
The effect of increasing number of bays in both directions is shown by considering the capacity curve of models having 3 stories and normal storey height of 3.5m for all stories. Number of stories and storey height are kept constant. Only the numbers of bays are increasing i.e. 2, 4 and 6. Following graph shows the capacity curve for models 3-2-NOR, 3-4-3-2-NOR, 3-6-NOR.
Fig. 8Capacity curve for different number of bays
3) Capacity Curve for Large Storey Height at Different Storey:
To evaluate performance of flat slab building having large ground storey height at different stories, models having 8 stories with 6 bays are taken. Storey height changes to 5.5m and remaining storey height is 3.5m. Following graph shows the capacity curve for model 8-6-1,5.5 , 8-6-4,5.5 , 8-6-8,5.5 .
Fig 9 Capacity curve for large storey height at different storey
B. Storey Drift
Storey drift for all models are obtained by performing analysis. Resulting storey drifts for X-direction are studied and performance of flat slab building with different number of bays, modified storey height at ground and various levels is evaluated.
1) Storey Drift for Modified Ground Storey Height
Following graph shows the storey drift for models 8-4-1,2.5 , 8-4-NOR and 8-4-1,5.5.
Fig. 10 Storey Drift for Modified Ground Storey Height
2) Storey Drift for Different Number of bays
Following graph shows the storey drifts for models 8-2-NOR, 8-4-NOR, 8-6-NOR.
Fig. 11 Storey Drift for different number of bays
Volume 3, Special Issue 1, ICSTSD 2016
Fig. 12 Storey Drift for large storey height at different storey
C. Plastic Hinge Mechanism
Level of hinges can be obtained from pushover analysis. Level and position of hinge formation for non-linear static load case PUSHX for these all flat slab models are studied. Following figure shows position of hinges obtained by performing pushover analysis
.
1) Plastic Hinge Mechanism for Modified Ground Storey Height
Following figure shows hinge formation for models 3-4-1,2.5 , 3-4-NOR and 3-4-1,5.5.
Fig 13 Plastic hinge formation in model 3-4-1,2.5
Fig 14 Plastic hinge formation in model 3-4-NOR
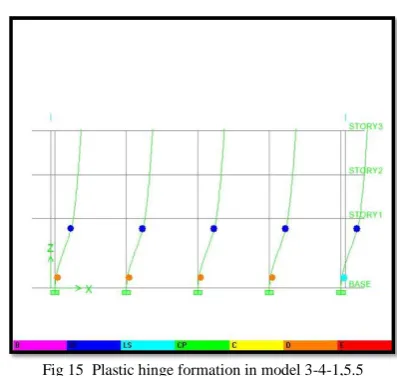
Fig 15 Plastic hinge formation in model 3-4-1,5.5
2) Plastic Hinge Mechanism for Different Number of bays
Following graph shows the storey drifts for models 3-2-NOR, 3-4-NOR, 3-6-NOR
.
Fig. 15 Plastic hinge formation in model 3-2-NOR
Volume 3, Special Issue 1, ICSTSD 2016
Fig.17 Plastic hinge formation in model 3-6-NOR
V. CONCLUSIONS
1. The results obtained in terms of capacity curve concluded that nature of pushover curve is same when ground storey height is modified. It can be concluded that for less ground storey height less yielding occurs.
2. It is observed that the nature of capacity curve for all models having different number of bays is same. It can be concluded that for nearly same roof displacement value base shear increases as number of bays increases.
3. It is observed that for nearly same value of base shear, displacement of model 8-6-4,5.5 is more as compare to displacement of model 8-6-8,5.5. It can be concluded from capacity that deformation capacity of model having large storey height at ground level is less as compare to other two.
4. There is increase in drift of mid storey is observed for models having ground storey height as 2.5m and 3.5m. Storey drift of top storey is less for model having 5.5m ground storey height as compare to other two.
5. It is observed that nature of graph of storey drift for 4 bays and 6 bays model is nearly same. Increase in storey drift of 5th storey is observed for 4 and 6 bays structure. For 2 bays structure storey drift of bottom and top storey is more but
storey drift at 5th storey is less than 4 and 6 bays models. As the number of bays increases the storey drift of bottom and top storey decreases. 6. It is observed that as the storey height increases
corresponding storey drift also increases. Maximum value of storey drift is observed at mid storey for models having large storey height 5.5m at mid and top storey.
7. When ground storey ht is 2.5m hinges of ground storey are in LS. When ground storey ht is 3.5m hinges of ground storey are in CP. When ground storey ht is 5.5m hinges of ground storey are in D.
8. For 6 number of bays hinges at ground storey is in LS while for 2 and 4 bays hinges at ground storey is in CP.
References
[1] Farzad Naeim, “The Seismic Design Handbook” Second edition 2008J. [2] Dr. V. L. Shah, Dr. S. R. Karve, Limit State Theory An Design of
Reinforced Concrete, Structures publication, India.
[3] Altuntop, Mehmet Alper “Analysis of Building Structures with Soft Stories”
[4] Sadashiva VK, MacRae GA, Deam BL, “Simple methods to evaluate structural irregularities effects”. New Zealand Society of Earthquake Engineering (NZSEE) Conference, Wellington, New Zealand, 26th - 28th March 2010. Paper No. 12.
[5] Mohd. Rizwan Bhina, Waseem Khan, and D.K.Paul, “Assessment of Different Aspects of R.C. Flat-Slab Building and Its Serviceability”, International Conference on Architecture And Civil Engineering (ICAACE'14) Dubai, December 25-26, 2014, pp. 87-91
[6] Triandas Srikanth “Non-linear Pushover Analysis of Flat Slab Buildings with and without Seismic Retrofitting”, Thesis report, IITK, India, July 1999
[7] K. Soni Priya, T. Durgabhavani, K. Mounika, M. Nageswari, P.Poluraju, “Non-Linear Pushover Analysis of Flat slab Building by using SAP2000”, International Journal of Recent Technology and Engineering (IJRTE) ISSN: 2277-3878, Volume-1, Issue-1, April 2012.
[8] Ravindra B., Mallikarjun S. Bhandiwad “Dynamic Analysis of Soft Storey Building with Flat Slab”, International research journal of Enee. And Technology, volume:02, july 2015.
[9] Rahiman G. Khan, M. R. Vyawahare, “Pushover Analysis of Tall Building with Soft Stories at different Levels”, International journal of engg .research and application, vol. 3, Aug 2013, pp.176-185.
[10] S R Satish Kumar & J L Srinivasan, “Performance Based Design of Reinforced Concrete Open Ground Storey Buildings”, 15th International
conference on Earthquake Engineering,2012.
![Fig. 3 Pushover curve with performance level [11]](https://thumb-us.123doks.com/thumbv2/123dok_us/8875447.1816590/2.595.68.253.525.640/fig-pushover-curve-performance-level.webp)