Research Article
Efficiency Determination of Hospitals of
Shiraz University of Medical Sciences Using
Simple and Super Efficiency DEA Models
© 2017 Shafaghat et al; licensee Iran University of Medical Sciences. This is an open access article distributed under a
Background and Objectives
Of the most important service providers in each community are health provider organizations that provide health services to the public, using resources and facilities.1 Over the past few decades, most countries
have faced with a significant increase in health care system costs in general, and medical and hospital costs in particular. This incremental trend of costs has been created due to the combined effects of demand-related elements such as demographic changes, widespread cognitive developments and social expectations. On the other hand, it can be caused by the combined effects of supply-related elements such as advanced technology and adequate available information about health care services. Also, due to the vulnerable economic infrastructures in confronting money and commodity
*Corresponding Author: Tahereh Shafaghat, Management Department, Management and Medical Information Faculty, Shiraz University of Medical Sciences, Shiraz, Iran, Tel: 09107006236, Email:sara.shafaghat@gmail. com
Tahereh Shafaghat
1*, Nahid Hatam
1, Mohammad Kazem Zarchi Rahimi
1, Zahra
Kavosi
2, Mohsen Bayati
21Management Department, Management and Medical Information Faculty, Shiraz University of Medical Sciences, Shiraz, Iran
2Department of Health Services Administration, School of Management and Medical Information, Shiraz University of Medical Sciences, Shiraz,
Iran
Background and Objectives: Analysis of performance and, specifically, efficiency evaluation of organizations will enable managers to optimally allocate resources. The efficiency can be calculated by determining the optimal scales for a hospital. The present study aimed to evaluate the efficiency of some hospitals using the super efficiency and simple data envelopment analysis (DEA) models.
Methods: This is a descriptive-analytic cross-sectional study performed from 21 March 2015 to 20 January 2016. The study population consisted of 11 hospitals affiliated to Shiraz University of Medical Sciences. The data were collected into 3 categories: input indicators, output indicators, and environmental-social indicators. In this study, super efficiency and simple DEA models were used for evaluating the efficiency of the hospitals.
Results: Based on the super efficiency model, hospitals 9, 5, and 4 had the highest efficiency. According to the input-oriented CCR model of DEA, among 11 studied hospitals, 4 (36%) were efficient and 7 (64%) were inefficient. Hospitals 3, 5, 7, and 9 were considered to be the most efficient ones with efficiency score of 1. The mean efficiency score of the hospitals was 0.845 and their maximum and minimum efficiency scores were 1 and 0.462, respectively. In terms of surplus production factors, the input of specialists had the highest surplus value. Conclusion: The study indicated that the super efficiency model led more accurate efficiency scores and provided a complete ranking of hospitals compared to the CCR model. Furthermore, managers should reconsider the number of hospitals and their allocation, improve their efficiency, and reduce repetitions by reducing their size or the scale of those kinds of hospitals which their efficiency was below the optimal line. Large hospitals should be divided into small-scaled and small-sized ones which could be managed more easily.
Keywords: Efficiency, Data envelopment analysis, Super efficiency, Teaching hospital
Abstract
market fluctuations, the developing countries are suffering from more consequences than any other countries.2 In
this regard, hospitals are as important as the largest and costliest operational units of the health care system.3,4
According to the World Health Organization (WHO), the share of health care costs in the gross domestic product (GDP) in Iran was 6.89% at 20145; most of this share had
been spent in hospitals. In other words, half to two-thirds of total government’s spending on health is used for hospital care.6 Therefore, the number of operational costs
of the hospital and lack of inadequate efficiency of the health care systems raise some questions about how these resources are spent by the hospitals. In developing or underdeveloped countries, when the issues of the capital and human resources supplement are combined with the lack of full-efficiency of the equipment, the level of overall efficiency or productivity falls following deficiency in capital and workforce disinvestment.7 On
training, the increase of security, and the establishment of infrastructure. Moreover, the rapid growth of health care spending is not sustainable for the national budget for a long time. For this reason, in order to reduce the rapid increase of the health care costs, the efficiency of this system should be improved.8 Therefore, in many
countries, the efficiency evaluation of health care services has become a serious issue which should be taken into consideration.9
Undoubtedly, the mission or the main aim of every system is to use its allocated resources in an efficient and effective way.10 Of the most important concerns of hospitals’
managers and authorities are evaluation of the use of the existing facilities, comparison of their performance with other similar organizations, identification of inefficient sections and the source of inefficiency, pinpointing the strengths and weaknesses along with their analysis, and providing appropriate solutions for improving the situation toward an efficient resource allocation procedure.11,12
Efficiency is measured by the ratio of total output to total input.11 One of the techniques often used for measuring
performance is data envelopment analysis (DEA).13 The
DEA technique provides the improvement path following efficiency evaluation of decision-making unit, and if the desired level of inputs and outputs is attained, that unit will reach the desired (efficient) state of the society.14 In the
DEA technique, one or a mixed of two or several efficient organizations are introduced as the benchmarking units for the inefficient ones.15
DEA provides a criterion called technical efficiency score which is a suitable criterion for the performance and efficiency evaluation in the public sector economy. This criterion – in addition to assessing the performance of each hospital – can be used for budget allocation between the hospitals.16 Therefore, more budgets can be
allocated to those hospitals which have higher levels of productivity with higher efficiency and inefficient hospitals will be guided to improve their performance and reach an acceptable level.15
Based on the above-mentioned information, efficiency evaluation of hospitals will contribute to performance improvement, resource allocation, and proper use of these resources. Therefore, the study aimed to determine the efficiency of hospitals in Shiraz, so that the managers and authorities can optimally use the available resources. However, regarding the use of super efficiency model in this study, it can be noted that despite the great benefits of DEA method, including the possibility of using different inputs and outputs with different measurement scales, simultaneous utilization of multiple inputs and outputs (evaluation of a set of factors),17-20 removal of
limitations caused by production function and production relations17,18,20 and the compensatory nature of models,19 it
has some disadvantages that the most important of which is the limitation in the indicators selection. This leads to a reduction in the number of input and output indicators. Therefore, in order to solve this problem, the super efficiency DEA Model was used in this study.
Methods
The current study is a descriptive-analytic cross-sectional one performed from 21 March 2015 to 20 January 2016. The research location was Shiraz and the research community consisted of all hospitals of Shiraz University of Medical Sciences which only 4 hospitals were not included in this study because of their different nature and characteristics in comparison with other hospitals. Therefore, the study was carried on 11 hospitals. Eight hospitals were teaching hospitals and 3 were non-teaching hospitals.
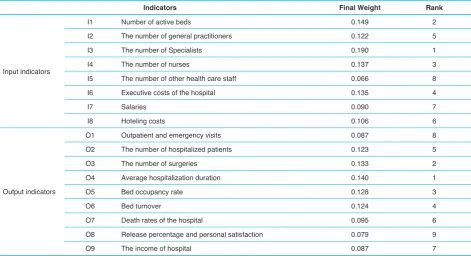
The data collection form was based on the indicators initially developed in the study of Shafaghat21 with the aim
of ranking and determining the indicators for efficiency evaluation of hospitals. This form consisted of 3 sections: input variables (8 variables), output variables (9 variables) (Table1), and the social-environmental variables including: type of hospitals, specialty of the hospital, and the specialty of hospital managers. The researchers collected the data for 9 months from April to December 2015. The data were collected after taking a permission letter from research deputy of the faculty, referring to each of the studied hospitals, and coordinating with the managers and the authorities of the hospital departments – mostly the medical records/statistics, personnel/administrative affairs, and accounting/financial departments.
The collected data were entered into the Excel spreadsheets. Subsequently, the coding, determining the super efficiency model, and applying the appropriate weights for the indicators (Table 1) in the form of constraints in the relevant model were done in the LINGO software and the efficiency scores and the ratings of hospitals were calculated. Then, for determining the efficient and inefficient hospitals, benchmarking hospitals for inefficient hospitals, as well as the excess and the deficiency in production factors for inefficient hospitals, the DEA Frontier software was used. At this stage, considering that with high number of input and output indicators and failure in reaching the suitable conditions for applying the simple
DEA model -No. DMUs ≤ 3(Xi + Yj- almost all the hospitals
In the DEA super efficiency model, hospitals can have efficiency scores greater than 1 (100%). In this case, the modified DEA method is used for efficiency evaluation in which the hospitals have no limitations to make themselves as a basis. Therefore, in the linear programming model which is designed and solved for the ith hospital, the
hospital itself is not considered as a part of basis boundary and if this hospital was fully efficient in the standard DEA model, in this method, its efficiency will be higher than 1.22
As an example, the score of 1.25 for an efficient unit, in rankings of the super efficiency model, means that this unit can increase the amount of its inputs up to 25% and still remains as an efficient unit.23
The objective function and limitations of super efficiency model in this study are indicated as follows:
Max Z= d0 St:
0.149 V1 + 0.122 V2 + 0.190 V3 + 0.137 V4 + 0.066 V5 +
0.135 V6 + 0.090 V7 + 0.106 V8 = 1
0.087 U1 + 0.123 U2 + 0.133 U3 + 0.140 U4 + 0.128 U5 + 0.124 U6 + 0.095 U7 + 0.079 U8 + 0.087 U9 – (0.149 V1 + 0.122 V2 + 0.190 V3 + 0.137 V4 + 0.066 V5 +0.135 V6
+ 0.090 V7 + 0.106 V8) + dJ = 0 Vi, Ur, dj ≥ 0.
After the complete ranking of hospitals using super efficiency model, the researcher used the input-oriented CCR model (the simple DEA model) in order to identify the inefficient hospitals and allocate a benchmarking hospital for them along with determining their shortage or surplus in input and output factors. So, the required coding was
done in DEA Frontier software. Since the No. Decision-making units (DMUs) ≥ 3(Xi + Yj) condition should be met in
order to do the CCR model, and regarding the number of studied hospitals (11 hospitals), the researcher inevitably used 2 input and 2 output indicators which were proved to have higher weight and prioritization in the study of Shafaghat (Table 1). The input indicators were the number of specialist doctors and the number of active beds and the output indicators were the average length of stay in hospital and the number of surgeries. Based on CCR model, those hospitals which had an efficiency score equal to 1 were efficient, and those hospitals with efficiency score less than 1 were inefficient. For inefficient hospitals, benchmarking hospitals were introduced. Benchmarking hospitals were the efficient hospitals that with the same amount of input or output variables in comparison with inefficient hospitals had the higher efficiency scores. Also, projection was carried out to determine which production factor, in comparison with the benchmarking hospitals, had the shortage and surplus problem of input and output resources.
Finally, the scale, technical and managerial efficiency scores were determined based on the assumptions of changeable return to scale and input minimization method.
Results
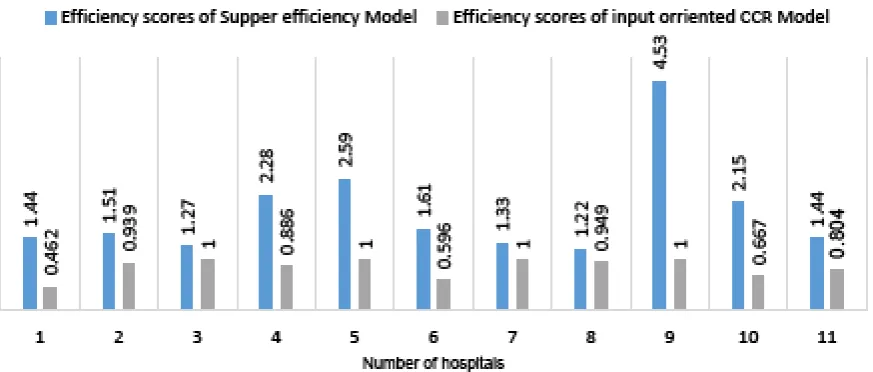
The results showed that based on super efficiency model, hospitals 9, 5, and 4 were identified as the most efficient hospitals (with an efficiency score higher than 1) with mean, minimum and maximum efficiency scores Table 1. The Final Weight (Normalized) and Rank of Input and Output Indicators for Evaluating the Relative Efficiency of Hospitals
Indicators Final Weight Rank
Input indicators
I1 Number of active beds 0.149 2
I2 The number of general practitioners 0.122 5
I3 The number of Specialists 0.190 1
I4 The number of nurses 0.137 3
I5 The number of other health care staff 0.066 8
I6 Executive costs of the hospital 0.135 4
I7 Salaries 0.090 7
I8 Hoteling costs 0.106 6
Output indicators
O1 Outpatient and emergency visits 0.087 8
O2 The number of hospitalized patients 0.123 5
O3 The number of surgeries 0.133 2
O4 Average hospitalization duration 0.140 1
O5 Bed occupancy rate 0.128 3
O6 Bed turnover 0.124 4
O7 Death rates of the hospital 0.095 6
O8 Release percentage and personal satisfaction 0.079 9
of 1.94, 1.22 and 4.53, respectively. However, based on CCR input-oriented model of DEA, among 11 hospitals of the study, 4 were efficient and 7 were inefficient. As can be seen in the Figure1, hospitals 3, 5, 7, and 9 were recognized as the most efficient ones with an efficiency score equal to 1. Also, according to CCR input-oriented model, the mean of efficiency score of the hospitals was 0.845 and the maximum and minimum efficiency score of them were 1 and 0.462, respectively. As can be inferred from the Figure 1, efficiency scores were more accurate in super efficiency model; also, it shows the hospital with the highest efficiency score. However, in CCR model, the highest efficiency score is equal to 1, and it was not clear which hospital had a higher efficiency. In fact, the super efficiency model offers a complete ranking of hospitals based on their efficiency scores.
The descriptive characteristics of input and output indicators which were used in CCR input oriented model are shown in Table 2. Also, the shortage and surplus amounts of the production factors based on CCR model is presented in Table 3. As you can see, the input indicator of specialist physician had the largest amount of surplus and this amount was mostly caused by hospital number 6.
The approximations which were related to scale, technical, and managerial efficiency scores of each hospital were analyzed and indicated in Table 4. As can be seen in the table, hospitals 3, 4, 7, and 9 – the benchmarking hospitals – have the highest technical and scale efficiencies.
Also, type of return to scale of the hospitals and the benchmarking units for each inefficient hospital are indicated in Table4. Accordingly, 4 hospitals had increased return to scale (IRS), 3 hospitals had decreased return to scale (DRS) and 4 hospitals had constant return to scale (CRS). Hospitals 5, 7, and 9 were the most frequent benchmarking hospitals, too.
Discussion
Those managers who use performance evaluation - especially efficiency evaluation- data of their organization are able to allocate resource optimally. Evaluation of technical efficiency of the health care centers and hospitals provides the opportunity of determining the optimal level of the scale for each unit, and increasing or decreasing the input and output factors. Furthermore, best decisions can be making on bed number developments and optimal resource allocations.24
Figure 1. Comparison of the Efficiency Scores and Rankings of the Hospitals Based on CCR Input-Oriented Model of DEA and Supper Efficiency DEA Model
Table 2. Descriptive Characteristics of Input and Output Indicators Used for CCR Model
Input/Output Indicators Number of Active Beds (I1)
Number of Specialists (I3)
Average Hospitalization Duration (O3)
Number of Surgeries (O4)
Maximum 690 87 1566 5.7
Minimum 84 4 308 1
Mean 227.818 21.363 756.818 3.522
Table 3. The Estimated Amount of Shortage/Surplus Factors for Efficient and Inefficient Hospitals Based on CCR Input-Oriented Model of DEA
No. of Hospitals Name of Inputs/Outputs The Amount of Inputs/Outputs
Estimated Amount of Shortage/ Surplus Factors
The Amount of Difference With the
Estimated Amount
The Percentage of Difference With the
Estimated Amount
1
The number of active beds 127 58.738 -68.261 -53.75%
The number of specialists 12 5.550 -6.449 -53.75%
Average of hospitalization duration 492 492 0 0%
The number of surgeries 1.3 1.3 0 0%
2
The number of active beds 238 265.882 -17.117 -6.05%
The number of specialists 15 14.092 -0.907 -6.05%
Average of hospitalization duration 876 876 0 0%
The number of surgeries 5.6 5.6 0 0%
3
The number of active beds 132 132 0 0%
The number of specialists 44 44 0 0%
Average of hospitalization duration 697 697 0 0%
The number of surgeries 3.91 3.91 0 0%
4
The number of active beds 178 157.728 -20.271 -11.39%
The number of specialists 12 10.633 -1.366 -11.39%
Average of hospitalization duration 447 447 0 0%
The number of surgeries 3.6 3.6 0 0%
5
The number of active beds 240 240 0 0%
The number of specialists 4 4 0 0%
Average of hospitalization duration 699 699 0 0%
The number of surgeries 4.22 4.22 0 0%
6
The number of active beds 84 50.064 -33.935 -40.40%
The number of specialists 87 7.814 -79.185 -91.02%
Average of hospitalization duration 745 745 0 0%
The number of surgeries 1 1 0 0%
7
The number of active beds 159 159 0 0%
The number of specialists 17 17 0 0%
Average of hospitalization duration 325 325 0 0%
The number of surgeries 4.35 4.35 0 0%
8
The number of active beds 165 156.652 -8.347 -5.06%
The number of specialists 10 9.494 -0.505 -5.06%
Average of hospitalization duration 308 390.015 82.015 26.63%
The number of surgeries 3.5 3.5 0 0%
9
The number of active beds 88 88 0 0%
The number of specialists 9 9 0 0%
Average of hospitalization duration 1566 1566 0 0%
The number of surgeries 1.5 1.5 0 0%
10
The number of active beds 690 460.756 -229.243 -33.22%
The number of specialists 12 8.013 -3.986 -33.22%
Average of hospitalization duration 1400 1400 0 0%
The number of surgeries 4.4 8.099 3.699 84.08
11
The number of active beds 360 289.496 -7.503 -19.58%
The number of specialists 13 10.454 -2.545 -19.58%
Average of hospitalization duration 770 788.990 18.990 0.47%
Based on the results of input-oriented CCR model, among 11 studied hospitals, 4 hospitals were efficient (on the efficiency boundary), 7 hospitals were inefficient (under the efficiency boundary) of which 4 hospitals had an efficiency score of 0.8 to 1, and 3 hospitals had an efficiency score equal to 0.8. Based on the utilized model, the minimum and maximum of efficiency scores were 0.462 and 1, respectively and mean ± standard deviation of the efficiency scores was 0.845 ± 0.180. In other words, the efficiency improvement capacity of the hospitals – without any rise in costs and with the same amount of inputs – was nearly 15.5%. In fact, it can be said that the studied hospitals could have the same amount of productions with 84.5% of their resources.
In this regard, Asadi et al analyzed relative efficiencies
of 13 hospitals in Yazd. Mean efficiency of these hospitals
was 0.945 and 9 out of 13 hospitals were efficient and 4 hospitals had an efficiency score lower than 1.25 The
difference between the mean efficiency score in this study and the present study can be caused by the difference in input and output indicators.
Goudarzi et al analyzed the efficiency of 13 hospitals of Lorestan University of Medical Sciences. The technical efficiency mean score of the studied hospitals was 0.93; in other words, the efficiency improvement capacity of the hospitals – without any rise in costs and with the use of same amount of inputs – was nearly 7%.26 Askari et
al concluded that technical efficiency mean score of the studied hospitals was equal to 0.958. Therefore, the efficiency improvement capacity of the hospitals – without any rise in costs and with the use of same amount of inputs – was nearly 5%. Furthermore, among all the studied hospitals, only 2 hospitals were indicated to had a
technical efficiency score equal to 1.23
The results of these studies were similar to the present study in their inclusion of all the university affiliated hospitals as the study sample and the same input and output indicators. However, there was a difference in mean efficiency score of the above-mentioned studies with present study. This can be caused by the difference between location of the study, the studied hospitals, the type of hospitals, and even the implementation of health care reform plan in the timeframe of present study.
Azar evaluated the relative efficiency of 22 hospitals of Tehran University of Medical Sciences from 2009 to 2011. The mean efficiency scores were 0.865, 0.859, and 0.870 in the study timeframe.19 These results were
similar to the results of the present study; maybe due to having the same input and output indicators that made the comparisons easier.
Poormohammadi indicated that 60% of the social security hospitals are technically efficient; so that the average technical efficiency is 0.96 by DEA method.27
In the study of Khatami Firoozabadi et al, the averages efficiency of hospitals, during the years 2014-2016, were 0.81, 0.82, and 0.76, respectively and most hospitals were inefficient.28 Also, Rahimi et al indicated that the mean
score of technical efficiency of the studied hospitals was 0.584; in other words, the efficiency improvement capacity of the hospitals – without any rise in costs and with the use of the same amount of inputs – was nearly 41.5%.4
Hatam used DEA method for evaluating the efficiency of social security hospitals, and the result was 0.899. Hatam believed that lack of technical efficiency was caused by the failure in using inputs like active beds, number of nurses, physicians and other personnel, lack of proper use
Table 4. The Amount of Scale, Technical and Managerial Efficiency Scores and Type of Return to Scale of Hospitals and The Benchmarks for Each Inefficient Hospital
Benchmarking Hospitals Return to Scale Managerial Efficiency Scale Efficiency Technical Efficiency Number of
Hospitals
Hospital 9, Hospital 7, Hospital 5 IRS 0.735 0.629 0.463 1
Hospital 9, Hospital 7, Hospital 5 DRS 1 0.940 0.940 2
Hospital3 CRS 1 1 1 3
Hospital 9, Hospital 7, Hospital 5 IRS 0.920 0.936 0.886 4
Hospital 5 CRS 1 1 1 5
Hospital 9, Hospital 3 IRS 1 0.596 0.596 6
Hospital 7 CRS 1 1 1 7
Hospital 7, Hospital 5 IRS 1 0.949 0.949 8
Hospital 9 CONS 1 1 1 9
Hospital 9, Hospital 5 DRS 1 0.668 0.668 10
Hospital 7, Hospital 5 DRS 1 0.804 0.804 11
of hospital beds, reduced length of stay in hospital and the number of occupied bed-day.29
Jat and Sebastian studied 40 local hospitals of India using DEA input oriented method. The technical efficiency mean score of the studied hospitals was 0.90 ± 0.14. Among these hospitals, 20 hospitals (5%) were efficient and the rest of them were inefficient with efficiency mean score of 0.79. It means that these hospitals were able to produce similar outputs with 21% lower inputs.30
Jehu-Appiah et al analyzed technical efficiency of local hospitals in Ghana using DEA method and concluded that among 128 local hospitals, 31 hospitals (24%) were totally efficient, 25 hospitals (19.5%) had an efficiency score of 0.7 to 0.99, and 71 hospitals (56.2%) had an efficiency score lower than 0.7. The hospitals which had the lowest efficiency had a score of 0.21 to 0.3.31
In the present study, the return to scale was also measured which shows an increase in the production factors along with the same increase in all other resources. In this measurement, 3 indicators were displayed: (1) the CRS; an increase in production factors leads to the same increase in amount of production; (2) the IRS; an increase in production factors leads to the more increase in amount of production; (3) the DRS; an increase in production factors leads to the less increase in amount of production.4
Based on the results of this study, 4 hospitals (36%) had the IRS, 3 hospitals (27%) had the DRS, and 4 hospitals (36%) had the CRS. Obviously, hospitals that had the CRS should continue to operate on the same scale. Hospitals with an IRS should increase their operation scale and hospitals with a DRS should reduce their operation scale. Therefore, 63% of the hospitals were not able to develop higher than their current level.
Azar in his study indicated that 63% of the hospitals had a CRS, 27% of the hospitals had a DRS, and 10% of the hospitals had an IRS.19 These results differed with the
results of the present study. This difference could be due to different size of the studied hospitals.
Khatami Firoozabadi et al in his study showed that 0.38% of hospitals had CRS, 0.38% had decreasing return to scale and 0.23% of them had increasing return to scale. Therefore, 0.76% of them did not have the capacity to develop beyond the status quo.28 Also, Rahimi
et al indicated that 65.4% of the hospitals had a DRS, 17.3% had a CRS, and 17.3% had an IRS.4 The results
of Pourmohammadi’s study indicated that in each of the years 2006 to 2007, 26 hospitals (41%) had a DRS. The number of those hospitals which had an IRS were 19 (30%) in 2006, 12 (19%) in 2007, and 15 (23%) in 2008. This indicated that, on average, 24% of Social Security hospitals should increase their production in order to reach
scale efficiency. Among all the hospitals, 19 hospitals had a CRS in 2006. Between the years of 2007 to 2008, the number of these hospitals had reached to 26 ones. Therefore, in these years, the number of those hospitals which worked in an optimal scale increased up to 11%.27
Moreover, in the present study, the highest inputs surpluses were related to the specialists input that was almost due to hospital number 6. In Goudarzi et al study, the highest input surplus was related to nurse input, and the lowest was related to beds.26 The reason for this
difference could be the implementation of the Iran’s Health System Development Plan and the retention of specialists’ physicians in hospitals which increased this input indicator. However, output indicators did not increase significantly, since they were dependent on the number of beds and also their increase requires hospital development in a long time; therefore, it has led to a reduction in the hospitals’ efficiency in this study.
In Askari et al study, the surplus capacity of production factors especially in nurse input was evident.23
Pourmohammadi’s study indicated that in each 3 years of the study; the most surplus mean was related to the input of other personnel in the hospital.27
Also, Rahimi et al indicated that the highest surpluses of inputs were related to specialists, beds, and nurse inputs.4
Generally, saving inputs, in addition to performance, productivity, and efficiency improvement in all the hospitals will release such kind of resources than can be used to improve the quality of treatment and to provide extension services and preventive activities (such as patient and staff training) and other purposes. This will help to make a huge difference.11
Conclusion
This study helps some functional models be introduced to the health care managers; also, more accurate planning can be designed for developing the capacity of health care services and saving the resources. Managers and authorities should reconsider the number of hospitals and their distribution, improve their efficiency and reduce repetitions by reducing the size or scale of inefficient hospitals which their efficiency scores were below the optimal line. Large hospitals should be divided into small scaled and small sized ones which could be managed more easily.
Also, the authorities of the medical sciences universities can appreciate hospitals with high efficiency scores and introduce them as a benchmark for other hospitals. In addition, as indicated in numerous studies, this ranking – which is done based on efficiency scores – can be used for budget allocation to hospitals. Therefore, limited resources will not be allocated to inefficient hospitals which cannot even operate efficiently in their current scale. Moreover, hospitals’ efficiency scores can be used as a part of their assessment and the validation system.
Abbreviations
DEA (Data Envelopment Analysis), CCR (Chames, Cooper and Rhodes), WHO (World Health Organization), GDP (gross domestic product), DMU (Decision-making unit),, IRS (increased return to scale), DRS (decreased return to scale).
Authors’ Contributions
TS has designed the study, collected and analyzed the data and prepared the manuscript draft. NH has provided assistance in the design of the study, supervised the study and revised the manuscript technically. MKZR has collected and analyzed the data and prepared the manuscript draft. ZK and MB have provided help for performing the study and assistance for analyzing the data.
Competing Interests
The authors have disclosed no conflict of interest.
Acknowledgements
This study was a part of a MSc dissertation approved by Shiraz University of Medical Sciences, approval number 7120-93 and the study complies with ethical considerations.
References
1. Rahmani N, Keshavarz A, Tabatabaei SS, Kalhor R. Assessing the role of hospital ownership on total factor
productivity changes in Qazvin hospitals using Malemquists Index and DEA. Journal of Payavard Salamat. 2012;6(4):300-10. [Persian].
2. Sepehrdust H, Rajabi E. Technical efficiency measurement of social security hospitals. Journal of School of Public Health and Institute of Public Health Research. 2012;10(3):91-9. [Persian].
3. Hatam N. Technical Efficiency Measurement of Hospitals of country’s Social Security Organization through Data Envelopment Analysis method. Management Quarterly. 2005;7:6-18. [Persian].
4. Rahimi B, Yusefzade H, Khalesi N, Valinejadi A, Gozali A, Akbari S, et al. Analysis of the efficiency and optimal consumption of resources in selected hospitals in Urmia province through data envelopment analysis. Journal of Health Administration. 2012;15(47):91-102. [Persian]. 5. Khosravi B, Soltani S, Javan-Noughabi J, Faramarzi A.
Health care expenditure in the Islamic Republic of Iran versus other high spending countries. Med J Islam Repub Iran. 2017;31:71. doi: 10.14196/mjiri.31.71.
6. World Health Organization (WHO). WHO global health expenditure atlas. Geneva:WHO; 2014.
7. Saber-Mahani A, Goodarzi G, Barouni M, KHakian M. Estimation of Technical Efficiency of General Hospitals of Kerman University of Medical Sciences by Data Envelopment Analysis (DEA) Method in 2007. Journal of Kerman University of Medical Sciences. 2010;16(1):59-67. [Persian].
8. Du J, Wang J, Chen Y, Chou SY, Zhu J. Incorporating health outcomes in Pennsylvania hospital efficiency: an additive super-efficiency DEA approach. Ann Oper Res. 2014;221(1):161-72. doi: 10.1007/s10479-011-0838-y. 9. Rebba V, Rizzi D. Measuring Hospital Efficiency through Data
Envelopment Analysis when Policy-Makers’ Preferences Matter: An Application to a Sample of Italian NHS Hospitals. Polit Econ. 2007;23(3):233-58.
10. Hashemi N, Hosein-Zadeh Lotfi F, Najafi E. Performance evaluation of educational groups using Data Envelopment Analysis. Development and Evolution Management. 2010;2:85-91. [Persian].
11. Alamtabriz A, Imanipour M. Measuring the relative efficiency of health care offered in hospitals of Shahid Beheshti University of medical sciences using Data Envelopment Analysis (DEA) Technique. Health Information Management. 2011;8(3):315-25. [Persian].
12. Alamtabriz A, Imanipour M. Measuring the relative performance of hospitals’ health care using DEA. Vision of Management DEA. Journal of Management Vision. 2009;8(31):139-57. [Persian].
Business Research. 2015;5(2):24-38.
14. Mohammadi Ardekani MA, Mirghafoori SH, Mirfakhr Aldini SH, Damaki AM, Moumeni HA. Evaluation of the relative efficiency of government hospitals in Yazd using DEA model (Data envelopment analysis). Journal of Shahid Sadoughi University of Medical Sciences and Health Services. 2009;17(2):67-75. [Persian].
15. Rashidian A, Jahanmehr N, Pourreza A, Majdzadeh SR, Godarzi G. Evaluating Performance of Medical Universities in Iran during 2002 to 2007: a Technical Efficiency Study. Hakim Research Journal. 2010;13(1):58-68. [Persian]. 16. Mohammadi A, Mohammad Hoseini Zadeh S. Use of DEA/
AHP integrated approach in rating the insurance agencies. Economic Bulletin. 2005:281-304. [Persian].
17. Dargahi H, Masuri N, Safdari R, Fazaeli S, Yousefi M. The Efficiency analysis of Medical Records Departments of Tehran University of Medical Sciences Hospitals with Data envelopment analysis (2007-2009). Journal of Payavard Salamat. 2010;4(1-2):9-17. [Persian].
18. Mehregan MR. Data Envelopment Analysis, Quantitative Models in Performance Evaluation of organizations. 2nd ed. Tehran: University’s book; 2012. [Persian].
19. Azar A, Valipour khatir M, Moghbel Baerz A, Hasas Yeganeh Y. Evaluation of Hospital Efficiency by Data Envelopment Analysis: Tehran University of Medical Sciences: 2009-2011. Journal of Health Administration. 2013;16(53):36-46. [Persian].
20. Narayanan S. Introduction to Data Envelopment Analysis and a Case Study in Health Care Providers [Thesis].
Pennsylvania: The Pennsylvania State University, The
Graduate School; 2009.
21. Shafaghat T. Efficiency measurement of hospitals of Shiraz University of Medical Sciences by using of Delphi, Fuzzy Analytic Hierarchal Process and Super Efficiency DEA methods, 2014 [MS Thesis]. Shiraz: Shiraz University of Medical Sciences, Management and Informatics Faculty; 2014. [Persian].
22. http://treatment.tbzmed.ac.ir/uploads/30/CMS/user/file/47/
aennameh/140.pdf. Accessed September 25, 2014.
23. Askari R, Goudarzi R, Fallahzadeh H, Zarei B, Dehqani Tafti A. Efficiency appraisal of Yazd university of medical science hospitals by quantitative approach data envelopment analysis (DEA). Journal of Payavard Salamat. 2012;6(3):215-24. [Persian].
24. Abolhallaj M, Najafi B, Ahmad Kiadaliri AA. Measuring Technical Efficiency of the Hospitals Related to Universities of Medical Sciences in 2007. Medicine and Purification. 2011;19(3):49-61. [Persian].
25. Asadi M, Mirghafoori SH, Sadeqhi Arani Z, Khosravanian H. Qualitative Performance Evaluation of Hospitals Using DEA, Balanced Scorecard and Servqual A Case Study of General
Hospitals of Yazd. The Journal of Shahid Sadoughi University of Medical Sciences. 2011;18(6):559-69. [Persian].
26. Goodarzi G, Imani Nasab MH, Jahanmehr N, Rostami KH, Omidifar R, Mahooti F. Hospital performance assessment of Lorestan University of Medical Sciences. Payesh. 2012;11(3):309-15. [Persian].
27. Poormohammadi K. Measurement of technical efficiency of Social Security hospitals in Iran using two methods of data envelopment analysis and Stochastic Frontier Analysis during 2006-2008 [MS thesis]. Shiraz: Shiraz University of Medical Sciences, Management and Informatics Faculty; 2010. [Persian].
28. Khatami Firouzabadi SMA, Shafiei Nikabadi M, Tebyanian H, Shoja N. Assessing the efficiency of hospitals in Semnan province using data envelopment analysis with input nature. Knowledge and Health. 2018;12(4):76-83. [Persian]. 29. Hatam N. The role of Data Envelopment Analysis (DEA)
pattern in the efficiency of social security hospitals in Iran. Iran Red Crescent Med J. 2008;10(3):211-7.
30. Jat TR, Sebastian MS. Technical efficiency of public district hospitals in Madhya Pradesh, India: a data envelopment analysis. Glob Health Action. 2013;6:21742. doi: 10.3402/ gha.v6i0.21742.
31. Jehu-Appiah C, Sekidde S, Adjuik M, Akazili J, Almeida SD, Nyonator F, et al. Ownership and technical efficiency of hospitals: evidence from Ghana using data envelopment analysis. Cost Eff Resour Alloc. 2014;12(1):9. doi: 10.1186/1478-7547-12-9.
Please cite this article as: