R E S E A R C H
Open Access
Video salient region detection model based
on wavelet transform and feature
comparison
Fuquan Zhang
1,2, Tsu-Yang Wu
3*and Guangyuan Zheng
2,4Abstract
With the advent of the era of big data, the Internet industry has produced massive amounts of multimedia video data. In order to process these video sequence data quickly and effectively, a visual information extraction method based on wavelet transform and feature comparison is proposed to perceive the target of interest by simulating the multi-channel spatial frequency decomposition function of human visual system which can quickly extract the significant distribution from the image and obtain region of interest (ROI). Firstly, the principle of visual attention mechanism and the visual salience detection were analyzed. Then, the DOG (Difference of Gaussian) function is taken as the wavelet basis function, and the wavelet data is used to decompose the image data in the spatial domain and frequency domain, thus applying to the multi-channel of the human visual system. Finally, the significant distribution in the entire image is obtained by global color comparison; thus, the region of interest is extracted. The extraction model of visual information proposed is simulated in MATLAB environment. The simulation results show that the proposed algorithm can extract ROI more accurately and efficiently, compared with the existing algorithms.
Keywords:Wavelet transform, Global feature, Video sequence, Region of interest, Significant distribution, DOG function
1 Introduction
With the rapid development of 4G communication tech-nology and mobile device performance, Internet socialization, multimedia entertainment, and emerging media have gradually penetrated into people’s daily life and work with explosion of and video and image data [1– 4]. Traditional manual processing methods can no longer cope with such a large number of video sequence data processing tasks [5]. At the same time, artificial intelligence technology is gradually helping humans to free themselves from purely repetitive work and becomes widely used. The relevant research has become a hotspot in recent years. However, how to make the computer understand the surrounding environment has always been the focus and difficulty of artificial intelligence research [5]. At present, the most commonly adopted route is to
establish an effective visual processing system by imitating how humans perceive the surrounding environment [6].
The human visual system (HVS) is the most direct and important way for humans to perceive the surrounding environment [7]. The human sense can perceive visual in-formation such as color, brightness, shape, and motion of the image through the eye visual system, and process them through the brain visual central system [8]. Experi-ment shows that more than 75% of all information re-ceived by humans from the outside is obtained through vision [5]. In the process of visual information generating, human can quickly focus on the region or object of inter-est (generally a significant distribution region) [9], so as to realize the perception of the visual scene [10]. The pur-pose of computer vision technology research is to enable the machine to process and analyze the visual information of the environment. By simulating the human visual sys-tem, the computer can realize the same visual function like human beings and can filter the image information for pattern recognition. By mimicking the mechanism of
© The Author(s). 2019Open AccessThis article is distributed under the terms of the Creative Commons Attribution 4.0 International License (http://creativecommons.org/licenses/by/4.0/), which permits unrestricted use, distribution, and reproduction in any medium, provided you give appropriate credit to the original author(s) and the source, provide a link to the Creative Commons license, and indicate if changes were made.
* Correspondence:[email protected]
3College of Computer Science and Engineering, Shandong University of
Science and Technology, Qingdao 266590, China
human visual system visual attention can achieve rapid and efficient processing of video data, which has become a research hotspot nowadays. It can quickly extract a few significant visual objects from the image, namely, the re-gion of interest (ROI). Scientific research has found that the human visual system can simultaneously process the temporal and spatial domain information to perceive the distributed ROIs in video information [11, 12]. Further-more, similar to camera devices, the human visual system exhibits high resolution in the central area and a low reso-lution in the peripheral region.
There are many state-of-the-art works on visually sali-ent regions detection. Gaussian filter is a frequsali-ently used method in visual salient analysis research works. How-ever, as the evaluation by Cheng et al. [13] shows, the resulting saliency maps are generally blurry [14] and often overemphasize small, purely local features, which makes this approach less useful for applications such as segmentation, and detection [15]. A saliency model called the phase spectrum of quaternion Fourier trans-form (PQFT) proposed by C Guo et al. [16] may fail when detecting large saliency regions. MM Cheng et al. [17] proposed a method to decompose an image into large-scale perceptually homogeneous elements for effi-cient salient region detection, using a soft image abstrac-tion representaabstrac-tion. While it may fail when a salient object is off-center or significantly overlaps with the image boundary.
By choosing an appropriate basis function, the wavelet transform method can analyze images or information within different scales, and realize multi-resolution ana-lysis, which perfectly simulates the human visual infor-mation extraction process [18]. Many studies have used wavelet transform method to simulate the extraction of visual information. Bhardwaj et al. [19] presented a sig-nificant frame selection (SFS) and quantization of coeffi-cient difference-based robust video watermarking scheme in the lifting wavelet transform domain (LWT). Literature [20] studied the computer binocular vision in-formation system under the condition of mixed illumin-ation interference. This paper considers the influence of illumination-changing environment on visual informa-tion processing model and proposes an adaptive image illumination interference filtering algorithm based on wavelet transform principle. It builds a computer bin-ocular vision information processing model under mixed illumination interference and improves the performance of visual information system in complex environment. Zhong and Shih [21] proposed an efficient bottom-up saliency detection model based on wavelet generalized lifting, which requires no kernel and prior knowledge. Song et al. [22] proposed an artificial retina model based on wavelet transform to simulate visual information ex-traction. The above methods use the wavelet transform
to decompose the image signal in frequency domain, and appropriately transform each image component to different channels corresponding to that of the human visual system, and then use the wavelet inverse trans-form to synthesize the image which is consistent with the information extracted by human vision. In addition, for ROI also appears fusion of temporal and spatial do-main features of video sequences, Liu et al. [23] used visual saliency and graph cutting to achieve effective image segmentation. Li et al. [24] proposed a visual sali-ency model analysis method based on frequsali-ency domain scale spatial analysis. It should be noted that since visual information is a complex combination of temporal and spatial domain information [25], if the HVS characteris-tics are used to analyze the visual saliency, the global uniqueness of the saliency region must be considered.
Based on the above research, in order to process video data quickly and effectively, we proposed a visual infor-mation extraction model combining wavelet transform and contrast principle by simulating the human visual system. It can quickly extract saliency distribution from the image and acquire ROI. The overall architectural de-sign of the model is shown in Fig.3. The DOG function is used as the wavelet basis function, and the wavelet data is used to decompose the image data in the spatial and frequency domains, thus it can be applied to the multi-channel of human visual system. By comparing the color global feature, we obtain the significant distri-bution in the entire image, and finally extract the region of interest. The simulation experiment is carried out on the test video data sequence, and good results have been achieved, which shows the effectiveness of the proposed method.
2 Fundamentals of algorithm 2.1 Visual attention
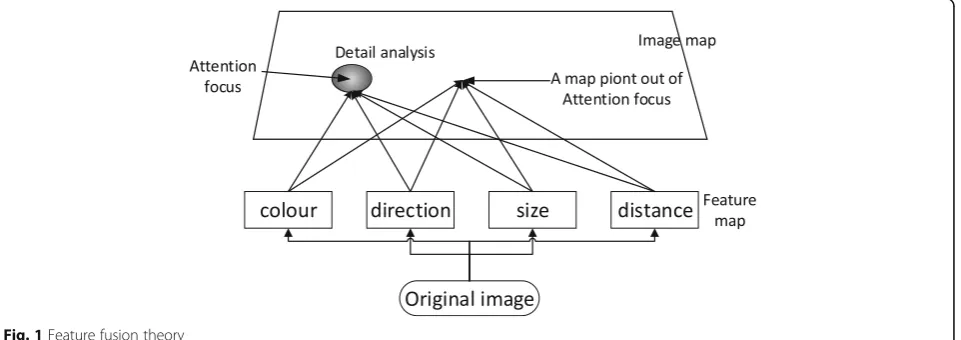
In human visual system, the human vision can produce different degrees of attention based on the distribution of different regions in the image. How much of the fo-cused attention is directly related to video visual sali-ency? Human’s vision can usually quickly locate the region with a large amount of information and focus on it. It is necessary to effectively integrate the temporal and the spatial domain information (color, intensity, dir-ection, motion). At this stage, most studies use the fea-ture fusion theory of Treisman and Gelade to achieve significant analysis of temporal and spatial domain infor-mation [26].
motion, etc.). These visual features are independent of each other and parallel. The vision system encodes the above contents differently, and then forms feature maps corresponding different channels. (2) Feature integration phase. In this phase, the visual system integrates the sep-arated features (feature representations) and their loca-tion to form a localoca-tion map, and then fuses the primary visual features on the location in a serial way to form an entity for further analysis and understanding. The principle of feature fusion theory is shown in Fig.1.
2.2 Principle of visual saliency detection
In order to simulate HVS to obtain a significant picture, it is necessary to use the principle of visual correlation saliency detection. This paper mainly adopts the contrast method in visual saliency detection method [13]. By using the contrast method, it can be judged whether an object will get the attention of human eyes, which can be embodied by the difference in color, texture, or shape of a certain area and its adjacent area. As shown in Fig.2, in column left, the points of pale orange in upper and lower images that get more attention for their color are different from others; in the middle column, the tilting 5 and red 5 in upper image are more attractive to others for their distinctive texture direction and color, so to the red short lines in the lower image; eyes prefer to focus more on the cross star in the right upper image, its shape is unique compared to the surrounding ones, and the minus sign in the right lower image is the same. The contrast can usually include two categories [27]: (1) glo-bal contrast and (2) local contrast.
The main principle of global comparison is to analyze the difference between the central area and the entire background area. This principle assumes that there is a large difference in features between the salient region and the global region. The general evaluate method is to calculate the distance between the color of an area and that of the entire image. Global comparison can achieve
significant area detection without too many parameters, but with poor robustness. The main principle of local contrast is to analyze the degree of difference between the center and its neighboring areas, and compare them to achieve significant area detection. Compared with the global comparison method, the local contrast method has a better ability to imitate the human visual system, but the anti-interference ability to noise is worse, and the implementation complexity is higher.
3 Visual information extraction method
Through the above analysis of the visual attention mechan-ism, it can be seen that the human visual process consists of many steps. Research shows that there are multiple discrete frequency channels in the process of visual infor-mation extraction [28], and the wavelet transform method can analyze an image into different scales by selecting an appropriate basis function, and realize multi-resolution ana-lysis characteristics. The simulation implements the human visual information extraction process.
3.1 Visual information extraction model
In this section, we simulate the process of perceptual interest of the human visual system and propose a method of video information extraction based on wavelet trans-form and feature comparison. As shown in Fig. 3, in the video sequence consisting of video frames, we analyze the image information in the spatial and frequency domains from a multi-channel perspective, perform wavelet trans-form on the visual intrans-formation. Based on the global fea-ture comparison of color, the visual salient distribution is obtained to extract the region of interest.
3.2 Wavelet basis functions
In general, a ∇2G filter can effectively satisfy the multi-resolution analysis characteristics, where ∇2 represents a Laplacian operator and G represents a two-dimensional Gaussian distribution function. The
work of Sui and Xu [29] proved that ∇2G filter can be better replaced by DOG function and the setting is as follows:
D rð Þ ¼ ffiffiffi1
2
p
πσ2
exp −r
2
2πσ2 2
− ffiffiffi1
2
p
πσ1
exp −r
2
2πσ2 1
ð1Þ
Where ris the radial distance, and σ1and σ2 are the
two standard deviations of the Gaussian distribution, respectively.
The basis function of the wavelet is the DOG function described in Eq. (1), then
f rð Þ ¼D rð Þ ð2Þ
Therefore, its wavelet family of 2D transform can be expressed as
ψa;bð Þ ¼r Da;bð Þ ¼r 1 ffiffiffi 2 p
πaσ2
exp −ðx−bÞ 2þ
y−b
ð Þ2
2πσ2 2a2
!
− ffiffiffi1 2 p
πaσ1
exp −ðx−bÞ 2þ
y−b
ð Þ2
2πσ2 1a2
!
ð3Þ
ais the expansion factor. To simplify the analysis, it usually takes σ1= 1 and σ2= 0.625. In most practical
scenarios, the input signal is usually discretely sam-pled based on the discrete value a0 of a, an=a0n,
then from the literature [29], the following can be derived:
ψm;bð Þ ¼r
1
am 0
ψ x−b
am 0
;y−b
am 0
ð4Þ
Therefore, the 2D wavelet transform can be expressed as
Fig. 2Contrast of color texture and shape
Wfðm;bÞ ¼ Z Z
∞f xð ;yÞψm;bðx;yÞdxdy ð5Þ
Therefore, the fobtained by inverse transformation of wcan be expressed as
f xð ;yÞ ¼ 1 C
X
m Z þ∞
−∞ Wfðm;bÞψm;bð Þdbr ð6Þ
Where C is the number of channels, and the value is generally 6. That is, six discrete channels. The discrete value of the spreading factor is a0= 1/0.625 [18].
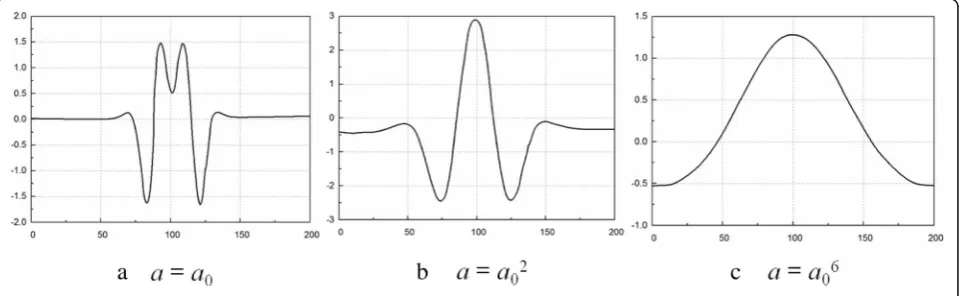
Fig-ure 4a–c shows cross-sectional views showing signal components included in respective wavelet coefficients when a=a0, a=a02, and a=a06, respectively. It can be
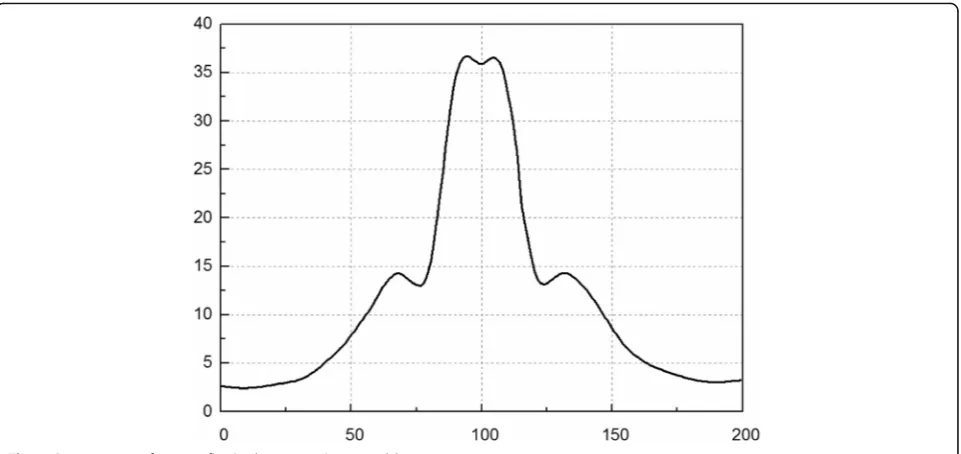
seen from Fig.4that when the value ofais continuously increasing, the frequency of the corresponding wavelet component is continuously decreasing, and the scalabil-ity of the expansion factor a is verified. Figure 5 is a cross-sectional view of output f(x,y) when a0= 1/0.625,
b= 0.
In the visual information extraction model based on wavelet transform, through the EEG information pro-cessing model, we have proposed [30], if the brain visual processing organ perceives the object of interest, the feedback link is used to change the spreading factorato increase the center frequency of the band pass filter, thereby expanding the bandpass width and reducing the observation scope. In addition, by modifying the param-eters to adjust the position of the observation center, the details of the prominent area can be extracted better. Figure 6 exhibits a specific adjust procedure for the wavelet transform model to an input image.
3.3 Visual saliency distribution based on color global feature comparison
In this paper, the global contrast feature calculation of CIELab color space is used to realize visual saliency de-tection. To simplify the analysis, let the coordinate
vector of the ith pixel be Pi, and the vector of the ith pixel in the CIELAB color space be Ci, as defined by Eq. (7):
Pi¼ xi yi ;Ci¼
li ai bi 2 4
3
5 ð7Þ
Different from the RGB color model, the CIELAB color model can better simulate the human visual sys-tem. In order to effectively extract the color global com-parison image of the image, the RGB color model of the input image needs to be converted into a CIELAB color model. The image is quickly divided into N superpixels R= {R1,R2, …,RN} by using the superpixel segmentation technique in [31]. The segmentation pictures and detail display are shown in Fig.7.
As can be seen from Fig.7b, the color values of all the pixels in the same superpixel are almost identical. The global comparison calculation method for the color of the superpixelRkis as shown in Formula (8):
C RKð Þ ¼X N−1
n¼1
CK;Cn
1þα XK;YK;Xn;Yn
ð8Þ
Where Nis the total number of superpixels, CK is the average value of the color of the Kth superpixel, and ‖ CK;CN‖is the Euclidean distance of two different super-pixel colors (used to indicate the degree of difference be-tween the two), which is to different the spatial distance of the superpixel position, a is the adjustment param-eter. If ais large, the color contrast is greatly interfered by the spatial position factor. Ifais small, the color con-trast is less interfered by the spatial position factor. Ac-cording to experience, this paper takesa= 3.
4 Experimental results and discussion
In this section, MATLAB simulation software is used to realize video information processing and interest region
extraction, and a large number of tests have been carried out. The experiment focuses on saliency detection or ROI extraction model, compares the quantitative indica-tors with the proposed method and existing methods, and verifies the effectiveness of the method.
4.1 Database
We collected 1000 real video of 60 s in length data as ex-perimental datasets. In the exex-perimental simulation of real video sequence data, the test video sequence selects several network video sequences of the same length. The test video sequence has a resolution of 328 × 248. During the calculationa= 3,a0= 1/0.625,σ1= 1, andσ2= 0.625.
4.2 Comparative analysis of visual information extraction results
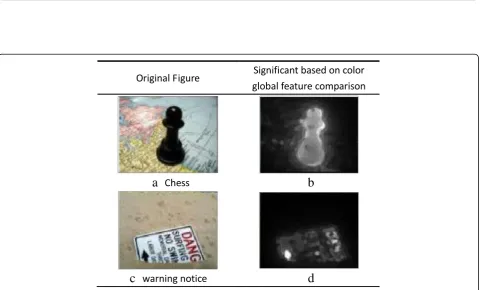
Figure 8 is a comparison of the results of the saliency map distribution when processing still images. Figure8a,
c shows a comparison of global color features of two dif-ferent input images. Figures8b, d are saliency diagrams calculated using color global feature comparisons. As can be seen from Fig. 8, a visual saliency map can be effectively obtained based on the global feature compari-son of colors. Significantly, the black chess main area in Fig.8b is brighter. Significantly, the arrow on the sign in Fig.8d is brighter. Using color global feature comparison can better detect visual saliency distribution.
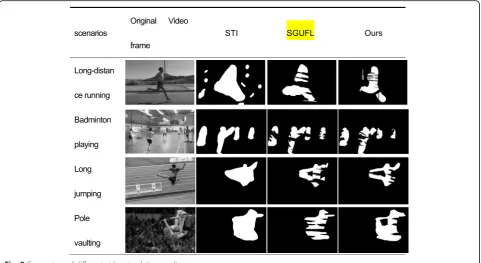
In four video sequence experiments, the proposed method is compared with the space-time domain infor-mation method (STI) [31] and the SGUFL method [32]. The ROI extraction results are compared as shown in Fig. 9. As can be seen from the above four figures, the result of the significant distribution detection is signifi-cantly reduced when processing the video sequence data compared to the processing result of the image in Fig.8. This is because the video sequence is dynamic, and the Fig. 5Cross section of outputf(x,y) whena0= 1/0.625 andb= 0
Fig. 7Examples of super-pixel segmentation.aThe comparisons between original images and the corresponding results of the images using super-pixel segmentation.bThe details of super-pixel segmentation in the bottom of right corner for Fig.7(a)
a
c
d
b
effect of performing superpixel segmentation on each frame is much lower than when processing a pair of still images alone.
Figure9 column“original video frame”shows the ori-ginal video frames of the long-distance running, the bad-minton playing, the long jumping, and the pole vaulting, respectively. Image patches in Fig. 9 column “STI” are ROIs detected after the STI algorithm processes the ori-ginal video frame, respectively. Patches in column
“SGUFL” are ROIs detected after the original video
frame is processed by the SGUFL algorithm, respect-ively. In the last column of Fig. 9, images are ROIs de-tected after the original video frame is processed by the method herein. It can be seen that the STI method can only detect the approximate position of the object, and it is vulnerable to noise interference, resulting in wrong ROI judgment, so the detection result ROI of the STI is the worst. Secondly, the ROI extraction result of the SGUFL method is similar to the method of this paper, but it does not perform well when processing motion in-formation. All experimental result shows that the hybrid method proposed in this paper has the best perform-ance, can detect the ROI region more accurately, and has better anti-interference ability, and it shows better accuracy when processing still and motion information.
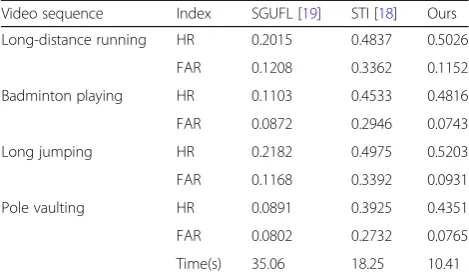
4.3 Comparative analysis of quantitative evaluation indicators
In order to further evaluate the performance of the vis-ual information extraction model, the parameters HR
(hit rate) and FAR (false alarm rate) were adopted to quantitatively evaluate the performance of the saliency detection [33].
HR¼E Y i
Oið Þ t S tð Þ !
ð9Þ
FAR¼E Y i
1−Oið Þt ð Þ S tð Þ
!
ð10Þ
Where Oi(t) is the black and white image after theith observer marks thetth frame image, then 1 indicates a re-gion of interest, and 0 indicates a background rere-gion.S(t) is the saliency distribution extracted by the saliency detec-tion algorithm. The performance evaluadetec-tion of the sali-ency detection algorithm or the ROI extraction model can be performed by the Formula (9) and the Formula (10). In this experiment, 20 observers were set up to manually mark the areas of interest in the experimental video se-quence. The eigenvalues ground truth of salient and non-salient regions of the videos are labeled manually and then are normalized to the interval of [0, 1].
0.1013, 0.3108, and 0.0898. The STD of HR are 0.55895, 0.40394, and 0.31849,. The STD of FAR are 0.01778, 0.02797, and 0.01638. All of these statistical analysis re-sults show that our method has significant superiority in various video scenarios.
5 Conclusion
By simulating the process of perceptual interest of hu-man visual system, this paper proposed a visual informa-tion extracinforma-tion method combining wavelet transform and contrast principle, which can quickly extract the sig-nificant distribution from the image and obtain ROI. First, the mechanism of visual attention and the principle of visual saliency detection were analyzed. Then, the DOG function is employed as the wavelet basis function, and the wavelet data is employed to de-compose the image data in the spatial and frequency do-mains, thus applied to multi-channel of human visual system. Finally, the significant distribution in the entire image is obtained by global color comparison, and finally the ROI is extracted. The simulation experiment is car-ried out on the test video data sequence, and the results are amazing, which shows the effectiveness of the pro-posed method.
Abbreviations
DOG function:Difference of Gaussian function; HVS: Human visual system; ROI: Region of interest
Acknowledgements
The authors thank the referees’careful reviewing and constructive suggestions. Also, we would like to thank the editorial boards for a great support and give a chance to modify our manuscript.
Funding
This work was supported by the Research Program Foundation of Minjiang University under Grants No.MYK17021, No.MYK18033, No.MJW201831408 and No.MJW201833313 and supported by the Major Project of Sichuan Province Key Laboratory of Digital Media Art under Grants No.17DMAKL01 and also supported by Fujian Province Guiding Project under Grants No.2018H0028. We also acknowledge the solution from National Natural Science Foundation of China (61772254 and 61871204), Key Project of College Youth Natural Science Foundation of Fujian Province (JZ160467), Fujian Provincial Leading Project (2017H0030), Fuzhou Science and Technology Planning Project (2016-S-116), Program for New Century Excellent Talents in Fujian Province
University (NCETFJ) and Program for Young Scholars in Minjiang University (Mjqn201601).
Availability of data and materials
We do not open our experimental data set.
Authors’contributions
FZ conceived the structure of the manuscript and gave analytical methods. T-YW performed the experiments and analyzed the results. GZ made lan-guage rendering and paper revision work. All authors read and approved the final manuscript.
Authors’information
Fuquan Zhang is an associate professor of Minjiang University, China. He have received silver medal of the 6.18 cross strait staff innovation exhibition, gold medal of nineteenth National Invention Exhibition in 2010. In 2012, his proposed project has won the gold award of the seventh international invention exhibition. He was awarded the“top ten inventor of Fuzhou” honorary title by Fuzhou City. He is now a member of the National Computer Basic Education Research Association of the National Higher Education Institutions, a member of the Online Education Committee of the National Computer Basic Education Research Association of the National Institute of Higher Education, a member of the MOOC Alliance of the College of Education and Higher Education Teaching Guidance Committee, ACM SIGCSE, CCF member, CCF YOCSEF member, director of Fujian Artificial Intelligence Society He has published about 70 research papers.
Tsu-Yang Wu received the PhD degree in Department of Mathematics, National Changhua University of Education, Taiwan in 2010. Currently, he is an associate professor in College of Computer Science and Engineering, Shandong University of Science and Technology, China. In the past, he is an assistant professor in Innovative Information Industry Research Center at Shenzhen Graduate School, Harbin Institute of Technology. He serves as executive editor in Journal of Network Intelligence and as associate editor in Data Science and Pattern Recognition. His research interests include video security and information security.
Guangyuan Zheng received the BS degree in 2010 from China University of Geosciences, China. Now is study in Beijing Institute of Technology. As a doctoral student, his major research interests include Machine learning, Computer vision, Medical image analysis and Computer safety.
Competing interests
The authors declare that they have no competing interests.
Publisher’s Note
Springer Nature remains neutral with regard to jurisdictional claims in published maps and institutional affiliations.
Author details
1Fujian Provincial Key Laboratory of Information Processing and Intelligent
Control, Minjiang University, Fuzhou 350117, China.2School of Computer Science & Technology, Beijing Institute of Technology, Beijing 100081, China.
3
College of Computer Science and Engineering, Shandong University of Science and Technology, Qingdao 266590, China.4Shangqiu Normal
University, Shangqiu 476000, China.
Received: 1 November 2018 Accepted: 29 March 2019
References
1. C. Deng, Z. Chen, X. Liu, X. Gao, D. Tao, Triplet-based deep hashing network for cross-modal retrieval. IEEE Trans. Image Process.27(8), 3893–3903 (2018) 2. E. Yang, C. Deng, C. Li, W. Liu, J. Li, D. Tao, Shared predictive cross-modal
deep quantization. IEEE Trans. Neural. Netw. Learn. Syst99, 1–12 (2018) 3. X. Huang, Image encryption algorithm using chaotic Chebyshev generator.
Nonlinear Dynamics.67(4), 2411–2417 (2012)
4. J.-S. Pan, L. Kong, T.-W. Sung, P.-W. Tsai, V. Snášel,α-Fraction first strategy for hierarchical model in wireless sensor networks. J.
Internet Technol.19(6), 1717–1726 (2018)
5. T. Schwitzer, R. Schwan, K. Angioi, I. Ingster-Moati, L. Lalanne, A. Giersch, V. Laprevote, The cannabinoid system and visual processing: A review on Table 1Comparison of the performance of the three methods
Video sequence Index SGUFL [19] STI [18] Ours Long-distance running HR 0.2015 0.4837 0.5026
experimental findings and clinical presumptions. Eur. Neuropsychopharmacol.25(1), 100–112 (2015)
6. J. Han, S. He, X. Qian, D. Wang, L. Guo, T. Liu, An object-oriented visual saliency detection framework based on sparse coding representations. IEEE Trans. Circuits Syst. Video Technol.23(12), 2009–2021 (2013)
7. A. Borji, L. Itti, State-of-the-art in visual attention modeling. IEEE Trans. Pattern Anal. Mach. Intell.35(1), 185–207 (2013)
8. Y. Zhou, L. Li, J. Wu, K. Gu, W. Dong, G. Shi, Blind quality index for multiply distorted images using Biorder structure degradation and nonlocal statistics. IEEE Trans. Multimedia.20(11), 3019–3032 (2018)
9. Y. Zhai, M. Shah, Visual attention detection in video sequences using spatiotemporal cues, Proceedings of the 14th ACM international conference on Multimedia, pp. 815–824, Santa Barbara, CA, USA, October 23–27, 2006, ACM New York, NY, USA
10. L. Li, W. Xia, W. Lin, Y. Fang, S. Wang, No-reference and robust image sharpness evaluation based on multiscale spatial and spectral features. IEEE Trans. Multimedia.19(5), 1030–1040 (2017)
11. G. Bhatnagar, Q.M.J. Wu, Z. Liu, Human visual system inspired multi-modal medical image fusion framework. Expert Syst. Appl.40(5), 1708–1720 (2013) 12. L. Itti, C. Koch, A saliency-based search mechanism for overt and covert
shifts of visual attention. Vis. Res.40(10–12), 1489–1506 (2000)
13. M.-M. Cheng, N.J. Mitra, X. Huang, P.H. Torr, S.-M. Hu, Global contrast based salient region detection. IEEE Trans. Pattern Anal. Mach. Intell.37(3), 569–582 (2015) 14. L. Li, W. Lin, X. Wang, G. Yang, K. Bahrami, A.C. Kot, No-reference image blur
assessment based on discrete orthogonal moments. IEEE Trans. Cybern.46(1), 39–50 (2016)
15. F. Perazzi, P. Krähenbühl, Y. Pritch, A. Hornung, Saliency filters: Contrast based filtering for salient region detection, 2012 IEEE conference on computer vision and pattern recognition, pp. 733–740, Providence, RI, USA, 16–21 June, IEEE Hoboken, NJ, USA
16. C. Guo, L. Zhang, A novel multiresolution spatiotemporal saliency detection model and its applications in image and video compression. IEEE Trans. Image Process.19(1), 185–198 (2010)
17. M.-M. Cheng, J. Warrell, W.-Y. Lin, S. Zheng, V. Vineet, N. Crook,Efficient salient region detection with soft image abstraction, Proceedings of the IEEE International Conference on Computer vision (2013), pp. 1529–1536 18. C.H. Sui and J. Ling:“A wavelet-based model of visual information
abstraction.”Laser & Infrared. 2002
19. A. Bhardwaj, V.S. Verma, R.K. Jha, Robust video watermarking using significant frame selection based on coefficient difference of lifting wavelet transform. Multimed. Tools Appl.77(15), 19659–19678 (2018)
20. R. Ke, Computer binocular visual information processing model in the case of hybrid light interference. Bull. Sci. Technol. (2), 230–232 (2014) 21. X. Zhong, F.Y. Shih, An efficient saliency detection model based on wavelet
generalized lifting. Int. J. Pattern Recognit. Artif. Intell.33(02), 1954006 (2018) 22. X. Song, Y. Zeng, F. Jiang, D. Chang, Discussion on the artificial retina model
based on visual information abstracting simulated by wavelet transform. Opt. Instrum.29(2), 36–40 (2007)
23. Y. Liu, B. Huang, H. Sun, Nanjing, Image segmentation based on visual saliency and graph cuts. J. Comput.-Aided Des.
Comput. Graph.25(3), 402–409 (2013)
24. L. Jian, D. Levine Martin, A. Xiangjing, X. Xin, H. Hangen, Visual saliency based on scale-space analysis in the frequency domain. IEEE Trans. Pattern Anal. Mach. Intell.35(4), 996–1010 (2013)
25. B. Hu, L. Li, H. Liu, W. Lin, J. Qian, Pairwise-comparison-based rank learning for benchmarking image restoration algorithms. IEEE Trans. Multimedia. (2019)
https://doi.org/10.1109/TMM.2019.2894958
26. E. Erkut, E. Aykut, Visual saliency estimation by nonlinearly integrating features using region covariances. J. Vis.13(4), 11 (2013)
27. X. Dong, X. Huang, Y. Zheng, L. Shen, S. Bai, Infrared dim and small target detecting and tracking method inspired by human visual system. Infrared Phys. Technol.62(1), 100–109 (2014)
28. K. Tiwari, P. Gupta, An efficient technique for automatic segmentation of fingerprint ROI from digital slap image.
Neurocomputing.151, 1163–1170 (2015)
29. S. Chenghua, X. Laiding, Abstraction and combination of image character by Multi-Frequency Channel wavelet transform.
Chin. J. Lasers.27(8), 733–736 (2000)
30. F. Zhang, Z. Mao, Y. Huang, X. Lin, G. Ding, Deep learning models for EEG-based rapid serial visual presentation event classification. J. Inf. Hiding Multimedia Sig. Process.9(1), 177–187 (2018)
31. X. Gu, G. Qiu, X. Feng, L. Debing, C. Zhibo, Region of interest weighted pooling strategy for video quality metric.
Telecommun. Syst.49(1), 63–73 (2012)
32. F. Zhang, B. Du, L. Zhang, Saliency-guided unsupervised feature learning for scene classification. IEEE Trans. Geosci.
Remote Sens.53(4), 2175–2184 (2015)