R E S E A R C H
Open Access
Replicated methylation changes associated
with eczema herpeticum and allergic
response
Meher Preethi Boorgula
1†, Margaret A. Taub
2†, Nicholas Rafaels
1, Michelle Daya
1, Monica Campbell
1,
Sameer Chavan
1, Aniket Shetty
3, Chris Cheadle
4, Sangjucta Barkataki
5, Jinshui Fan
6, Gloria David
7, Terri H. Beaty
2,
Ingo Ruczinski
2, Jon Hanifin
8, Lynda C. Schneider
9, Richard L. Gallo
10, Amy S. Paller
11, Lisa A. Beck
12,
Donald Y. Leung
13, Rasika A. Mathias
6†and Kathleen C. Barnes
1,14*†Abstract
Background:Although epigenetic mechanisms are important risk factors for allergic disease, few studies have evaluated DNA methylation differences associated with atopic dermatitis (AD), and none has focused on AD with eczema
herpeticum (ADEH+). We will determine how methylation varies in AD individuals with/without EH and associated traits. We modeled differences in genome-wide DNA methylation in whole blood cells from 90 ADEH+, 83 ADEH−, and 84 non-atopic, healthy control subjects, replicating in 36 ADEH+, 53 ADEH−, and 55 non-atopic healthy control subjects. We adjusted for cell-type composition in our models and used genome-wide and candidate-gene approaches.
Results:We replicated one CpG which was significantly differentially methylated by severity, with suggestive replication at four others showing differential methylation by phenotype or severity. Not adjusting for eosinophil content, we identified 490 significantly differentially methylated CpGs (ADEH+ vs healthy controls, genome-wide). Many of these associated with severity measures, especially eosinophil count (431/490 sites).
Conclusions:We identified a CpG inIL4associated with serum tIgE levels, supporting a role for Th2 immune mediating mechanisms in AD. Changes in eosinophil level, a measure of disease severity, are associated with methylation changes, providing a potential mechanism for phenotypic changes in immune response-related traits.
Keywords:Atopic dermatitis, Eczema herpeticum, Human epigenetics, DNA methylation, Infinium Methylation 450K array, Methylation EPIC array
Background
Atopic dermatitis (AD), a complex chronic skin disease, affects up to 30% of children. It often persists into
adult-hood [1, 2]. A primary symptom of AD is incessant
pruritus [3] which typically has an intermittent course with flares and remissions. Eczema herpeticum (EH) is a rare but serious complication of AD. The primary
predisposing factor for EH is HSV-1 exposure (in 2005– 2010, 54% of persons in the USA aged 14–49 had HSV-1 infection [4]). In spite of HSV-HSV-1 infection being the primary environmental risk factor in the development of EH, only a small subset (less than 3%) of patients with AD have a history of EH (ADEH+). ADEH+ patients typically represent the severe end of the disease spectrum, with more severe skin disease. They have re-duced interferon responses and are highly allergic with increased serum tIgE levels and eosinophilia [5–9]. Yet, the factors contributing to ADEH+ are unclear. To date, there is considerable evidence for genetic determinants associated with viral dissemination [10–12] and out-comes associated specifically with risk of ADEH+ and disease severity [6,8,9,13–20].
© The Author(s). 2019Open AccessThis article is distributed under the terms of the Creative Commons Attribution 4.0 International License (http://creativecommons.org/licenses/by/4.0/), which permits unrestricted use, distribution, and reproduction in any medium, provided you give appropriate credit to the original author(s) and the source, provide a link to the Creative Commons license, and indicate if changes were made. The Creative Commons Public Domain Dedication waiver (http://creativecommons.org/publicdomain/zero/1.0/) applies to the data made available in this article, unless otherwise stated. * Correspondence:[email protected]
†Meher Preethi Boorgula and Margaret A. Taub contributed equally to this work.
†Rasika A. Mathias and Kathleen C. Barnes are equally contributing senior authors.
1University of Colorado, Denver, CO, USA
14University of Colorado Denver, 13001 E. 17th Place, 5th Floor East, 5330A,
Aurora, CO 80045, USA
DNA methylation, an epigenetic mechanism by which gene expression is regulated without alterations in nu-cleotide sequence, has been shown to contribute to the risk of complex diseases, notably autoimmune disorders and diseases of inflammation [21–24]. Risk of AD has been shown to be correlated with changes in genomic DNA methylation patterns [25–27] in lesional versus non-lesional AD skin [28]. However, no study has exam-ined patterns of methylation specific to ADEH+.
Com-mon contributors to both ADEH−and ADEH+ are skin
barrier abnormalities and immune dysregulation while risk factors for ADEH+ are early-onset and persistent se-vere AD [5,29]. In spite of these known risks, the patho-physiology of ADEH+ still is not completely understood [30]. In addition to identifying a methylation-specific sig-nature for ADEH+, a goal of the current study was to determine whether an easily accessible tissue such as whole blood can be the source of a biomarker which might facilitate the early diagnosis of patients with AD prone to disseminated viral infections, and whether or not methylation changes in the blood can distinguish
be-tween ADEH+ and ADEH−.
Using blood as a surrogate tissue to identify methyla-tion changes associated with AD, and ADEH+ specific-ally, raises the challenge of performing an analysis that will control for signatures of immune response present in the blood. To account for differences in eosinophils across subjects, we estimated eosinophil fractions from the methylation data and included these fractions, along with those of other cell types composing each sample, in linear models. We contend that the CpGs associated with ADEH+ status and severity in this analysis should be independent of the specific immune response reflected by eosinophil levels.
However, similar to other recent reports focused on asthma and IgE-mediated allergic disease [31, 32], we found in further unadjusted analysis that the strongest factor to influence methylation differences was eosino-phil count. To explore this phenomenon in our data, we also examined methylation differences without adjusting for eosinophil fractions in discovery subjects and found many sites that were different between ADEH+ and healthy control individuals and which were related to various disease severity measures. We present discovery and replication results for all analyses and conclude with a discussion of the challenges of interpreting results from blood methylation analysis for an immune-related disease like AD.
Results
Estimation of cell-type composition and assessment of model calibration
Estimated cell fractions were included in all models to ensure removal of confounding effects for either 7 or 6
cell types (neutrophils and eosinophils combined as granulocytes). See Additional file1for further details on models and plots to assess model calibration.
Differentially methylated position (DMP) analysis: genome-wide dichotomous comparison
Differential methylation analysis was performed for all pairwise comparisons of phenotype groups, adjusting for seven cell types, including eosinophils, estimated from
the data: ADEH− against healthy controls, ADEH+
against healthy controls, and ADEH− against
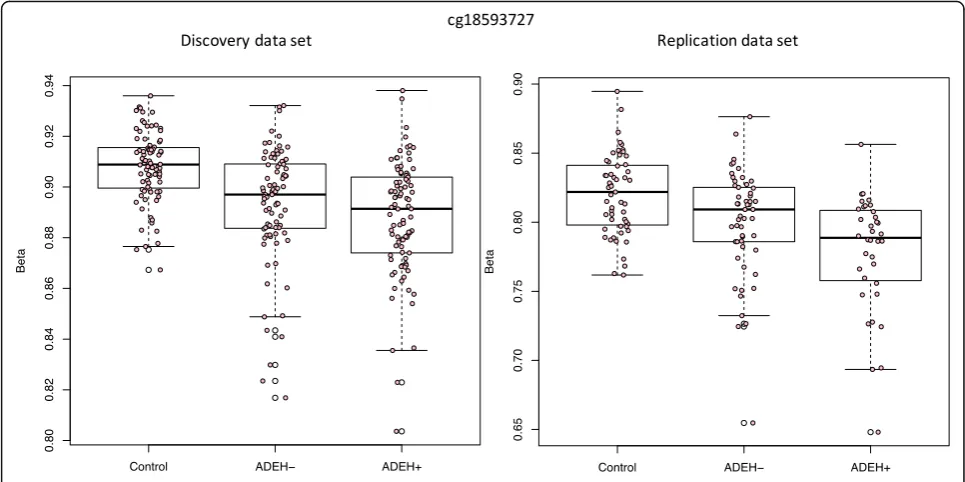
ADEH+ (see Table 1 for clinical characteristics of sam-ples included in analysis). One CpG (cg18593727) showed genome-wide significantly differential methyla-tion between the ADEH+ patients and the healthy con-trol group in our discovery analysis and showed suggestive replication (discovery FDR adjusted q-value 0.0426, replication nominal pvalue 0.0345, Fig. 1). This
CpG was annotated to the HCLS1 gene (Hematopoietic
Cell-Specific Lyn Substrate 1), a substrate of the antigen receptor-coupled tyrosine kinase, which plays a role in antigen receptor signaling for both clonal expansion and deletion in lymphoid cells.
Differentially methylated position (DMP) analysis: targeted gene dichotomous comparison
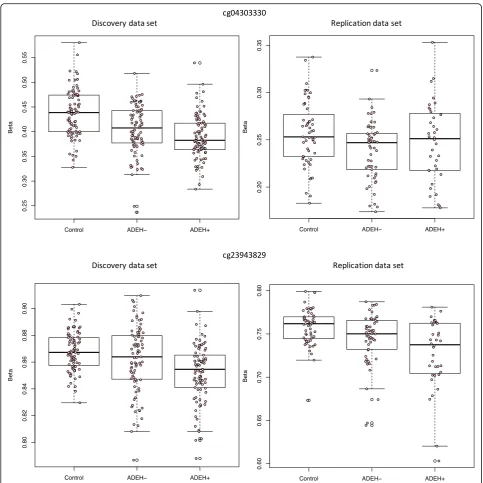
Two CpGs, one in IL4 (cg23943829) and one in IL13
(cg04303330), showed significant differential methylation between ADEH+ and healthy controls in the discovery analysis (FDR adjusted q-values of 0.03 and 0.04, re-spectively) and suggestive significance, including similar effect sizes in the same direction, in replication (nominal pvalues of 0.051 and 0.094, respectively, Table2, Fig.2, Additional file2: Table S2).
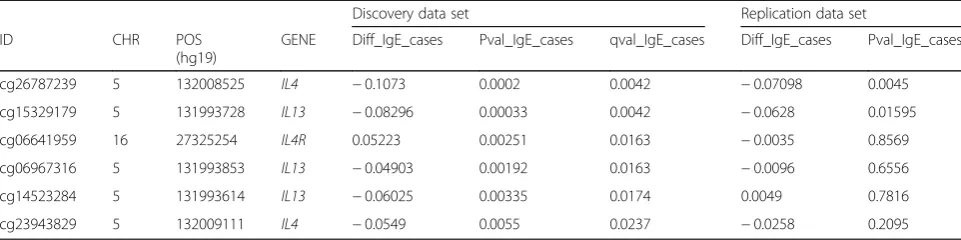
DMP analysis: serum tIgE levels inIL4,IL13, andIL4R
To address a previous link between IL4, IL13, and
IL4R and serum tIgE levels [33–35], we performed a
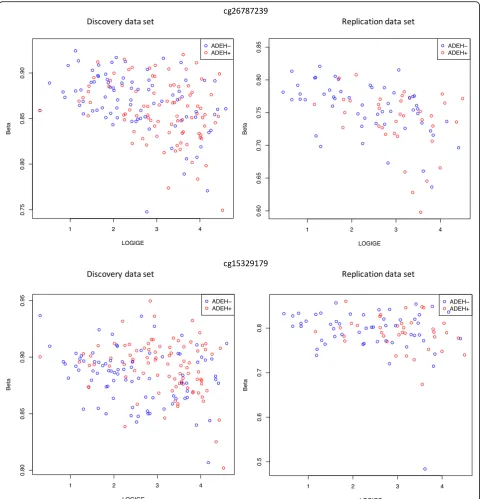
severity analysis limited to the 26 CpGs in these three regions. We found six CpGs in the discovery analysis, one of which replicated after Bonferroni correction for the 9 tests carried out in the
replica-tion analysis (cg26787239 in IL4, discovery FDR
ad-justed q-value 0.0042, replication p value 0.0045) and one with suggestive replication (cg15329179 in IL13, discovery FDR adjusted q-value 0.0042, replication p
value 0.016), both showing association between
serum tIgE and methylation levels (Table 3, Fig. 3,
Additional file 2: Table S3).
Differentially methylated position (DMP) analysis: dichotomous comparisons with six cell types
asthma, Arathimos et al. [31], Wei Chen et al. [32]), we investigated differential methylation patterns without adjusting for differences in eosinophil fraction between subjects. Differential methylation analysis was performed for all pairwise comparisons of phenotype groups, adjusting for the six main cell types estimated from the data: ADEH− against healthy controls, ADEH+ against
healthy controls, and ADEH−against ADEH+.
Compar-ing ADEH+ with healthy controls, 490 CpGs were differ-entially methylated (FDR-adjusted q-value < 0.05) and comparing ADEH−with Controls, six CpGs were differ-entially methylated (FDR-adjusted q-value < 0.05) (Add-itional file 3: Table S4), of which five were also in the group of ADEH+ to healthy control DMPs. Interestingly, there were no CpGs that were significantly different
be-tween the ADEH− and ADEH+ phenotype groups,
al-though mean methylation among ADEH−individuals at
CpGs with significant ADEH+ to healthy control differ-ences was to a large extent intermediate (452 of 490 CpGs, 92.2%) between ADEH+ and healthy controls’ methylation (Additional file1: Figure S5).
DMP analysis: severity measures with six cell types To further investigate the trend whereby ADEH− indi-viduals have methylation values intermediate to healthy controls and ADEH+ individuals but show no statisti-cally significant differences when compared to the ADEH+ patients, we performed an analysis investigating the relationship between different AD severity measures and methylation at the 491 CpGs that were significant (FDR adjusted q-values < 0.05) for at least one pairwise
comparison. Severity measures included serum tIgE levels, eosinophil counts [36–38], EASI score, and Rajka-Langeland score; analyses were performed within the
collective AD group (ADEH−, ADEH+; N= 173) for
each of these sub-phenotypes.
The strongest associations were observed for eosinophil counts with 431 out of 491 sites showing significant associ-ation (FDR-adjusted q-values < 0.05) between methylation and eosinophil counts (Additional file 4: Tables S5–S8, Additional file 1: Figure S6). A significant association was observed for serum tIgE levels at 335 sites, for EASI scores at 337 sites, and Rajka-Langeland scores at 276 sites.
Gene ontology analysis for results from analysis with six cell types
Gene ontology (GO) analysis was performed on the 490 CpGs with significant association from the analysis adjust-ing for six cell types comparadjust-ing ADEH+ to healthy controls. Two GO terms were enriched (FDR-adjustedq-value < 0.1) in the ADEH+ versus healthy controls group. Both terms, GO:0002761 and GO:0002573, are biological processes in-volved in the regulation of myeloid leukocyte differentiation (Additional file5: Table S9).
Discussion
With adjustment for the full set of seven cell types in the model, one CpG significant in the discovery phase showed suggestive replicated association with the ADEH+ phenotype compared to healthy controls
in a genome-wide test (Fig. 1). This CpG is located
1 kb upstream of the HCLS1 gene (Hematopoietic
Cell-Specific Lyn Substrate 1), encoding a substrate of the antigen receptor-coupled tyrosine kinase, which plays a role in antigen receptor signaling for both clonal expansion and deletion in lymphoid cells. One of its related pathways includes the
Im-mune response FcεRI pathway and FcεRI-mediated
dendritic cell signaling and antigen presentation, which promotes the development and activation of Th2 cells and contributes to allergic inflammatory
diseases [39], suggesting a potential role in allergic disease.
Given extensive prior work conducted on the genetics of AD, we focused our attention on a specific subset of candidate genes for AD. Using a set of 129 CpGs that belong to AD candidate genes of interest (FLG [5, 17, 18,25,29,40],LCE1B[40,41],RPTN[41,42],IL4,IL13 [18,30,33–35, 40] and its receptors,IFNs [6,7, 10] and TSLP [13, 14, 18, 30, 40], see Additional file 1 Table
S10), we identified CpGs significant by phenotype in the discovery and suggestive in the replication data sets in the IL13 and IL4 genes (Fig. 2, Table 2). This suggests there is a significant association between methylation and phenotype in these genes, even when taking differ-ences in eosinophils into account. We also found repli-cated association between methylation and serum tIgE levels for a CpG in the IL4 gene region and suggestive
replication for a CpG in the IL13 gene region (Fig. 3, Table 3). The CpG in theIL4gene region, cg26787239, which was significantly associated with serum tIgE levels, was also the most significant signal in recent work per-formed in an asthma cohort [43].
Reviewing published work examining the association between changes in epigenetics and AD, we found no prior study that accounted for differences in eosinophil
levels, so we used our 491 methylation changes associ-ated with phenotype without adjusting for eosinophils for comparison. Compared to Everson et al. [44], which focused on both case-control differences in AD and a comparison of individuals with low or high IgE levels, 11 of our CpGs overlapped with the top 22 CpGs signifi-cantly different between individuals with AD compared to controls [44]. However, we found no overlap with the top 140 CpGs presented in [45], which were the result of a related study that used random forests to compare individuals with and without eczema. Reasons for this lack of overlap include methodological differences and differences in the phenotype being considered.
In addition to AD status, we also considered measures of AD severity, specifically serum tIgE levels, which has previously been associated with AD severity [36–38]. The selection of the IL4, IL13, and IL4Rregions for in-vestigation of serum tIgE levels was in fact based on prior work showing that suppression of these Th2 cyto-kines decreases serum tIgE levels [34], that these genes
are involved in the pathway influencing cytokine- and receptor-mediated regulation of IgE [35], and that they are implicated in genetic association studies examining serum tIgE levels as an outcome [33]. In addition, gen-etic loci near IL13 were shown to be methyl-QTLs for CpGs in the promoter of IL13 indicating that methyla-tion could play a funcmethyla-tional role, linking genetics to out-come [46]. In this context, our results linking methylation nearIL13andIL4to serum tIgE levels implicate a role for methylation in determining the presence of serum tIgE or vice versa.
Recent work has shown that a major contributor to observed differences in methylation from whole blood between groups with different allergic disease pheno-types is a cross-sample variation in cell type compos-ition, in particular, the eosinophil fraction [24, 31, 32]. Specific to AD, prior work has shown that the peripheral eosinophil counts or serum levels of eosinophil-derived proteins are a measure of disease severity [36–38]. To
explore this, we modeled the outcome between
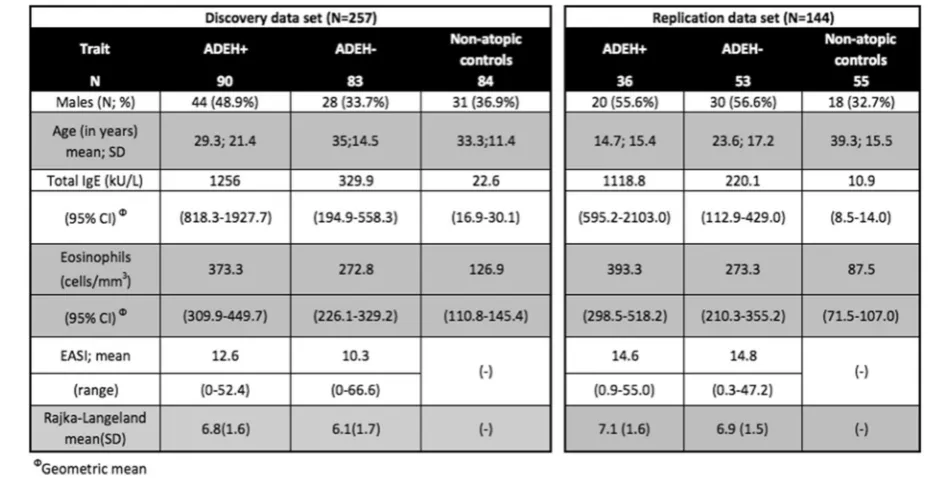
Table 1Clinical characteristics table for samples analyzed in discovery and replication data sets
Table 2Summary statistics from discovery and replication from gene-based analysis comparing ADEH+ individuals to non-atopic healthy controls, adjusted for Eos and Neu fractions. Both significant CpGs from the discovery stage were suggestive for replication (based on a Bonferroni correction for 9 tests)
Discovery data set Replication data set
ID CHR POS
(hg19)
GENE Diff_EHNA Pval_EHNA qval_EHNA Diff_EHNA Pval_EHNA
cg23943829 5 132009111 IL4 −0.1425 0.0002 0.0287 −0.0996 0.0509
cg04303330 5 131992430 IL13 −0.1516 0.0007 0.044 −0.1226 0.0941
methylation and phenotype without adjusting for the es-timated fraction of eosinophils in each sample to deter-mine whether differences in eosinophil fractions might contribute directly to differences in methylation that then affect the outcome of interest. This analysis with adjustment for six default cell types (eosinophils and neutrophils combined as granulocytes) identifies bio-logically relevant signals strongly associated with differ-ent diseases from previous studies [40, 47]. The two gene ontology (GO) terms associated with these 490 CpGs were both biological processes involved in the regulation of myeloid leukocyte differentiation. While we were not able to find specific links between myeloid leukocyte differentiation and AD, we identified at least one reference discussing the role of myeloid dendritic cells in AD [48]. Interestingly, from the severity analyses targeting serum tIgE levels, eosinophil counts, EASI score and Rajka-Langeland scores, eosinophil counts showed the largest number of CpGs that correlated with methylation levels. Given the strong evidence that ADEH+ patients have higher serum tIgE levels and cir-culating eosinophil counts compared to ADEH−patients [5, 36–38], it is of interest that we found methylation changes associated with both of these phenotypes.
Other phenotypes related to allergic response, such as asthma, face similar challenges with cell composition confounding. In fact, methylation analysis recently per-formed in asthma patients identified CpGs strongly asso-ciated with asthma that were also significant in our analyses, in both cases without adjustment for eosinophil
fractions. Specifically, cg10159529 (IL5RA) and
cg27469152 in the 3′UTR region of theEPX gene were
highly significant in the asthma analysis [31] and in our comparisons of ADEH+ patients versus healthy controls (FDR-adjustedq-value < 0.05) when not adjusting for eo-sinophils. These genes have known links to both
eosino-phil functions and allergic sensitization. DNA
methylation in CpGs annotated to the ZFPM1
(cg04983687, cg08940169) and ACOT7 (cg09249800,
cg21220721, cg11699125) genes were also shown to be strongly associated in the asthma study and in our ana-lysis focusing on ADEH+. However, as in our AD study, if eosinophil fractions were adjusted for in the asthma analysis, residual differential methylation comparing asthma cases to controls was nearly absent. While there is strong confounding between differences in eosinophil count, differences in methylation and AD status, these changes in methylation could lead to functional differ-ences that are a consequence of this change in cellular composition.
Conclusions
In summary, we find replication for one CpG associated with serum tIgE in the IL4 gene and suggestive replica-tion for four CpGs associated with EH compared to healthy controls or with AD severity measures, three of which fall in two genes of interest,IL13andIL4. As pre-vious gene expression studies have identified higher ex-pression of IL4 and IL13 in a specific disease group and have led to a treatment using a monoclonal antibody (dupilumab) to block these molecules [34], our hope is that a similar treatment could arise from the results of this study, in conjunction with further work on the epi-genetics of eczema herpeticum. We also show that eo-sinophil level plays a significant role in methylation patterns in individuals with AD, presenting both a po-tential confounder and a popo-tential mechanism for enact-ing methylation changes that could lead to phenotypic changes.
Methods Study Subjects
Discovery
ADEH+ subjects were defined as patients with AD who had at least one previous EH episode as physician docu-mented in Beck et al. [5]. ADEH−subjects were defined
Table 3Summary statistics from discovery and replication from gene-based analysis for serum tIgE levels, not adjusted for Eos and Neu fractions. One significant CpG from the discovery stage replicated (based on a Bonferroni correction for 9 tests) with an additional CpG suggestive of replication
Discovery data set Replication data set
ID CHR POS
(hg19)
GENE Diff_IgE_cases Pval_IgE_cases qval_IgE_cases Diff_IgE_cases Pval_IgE_cases
cg26787239 5 132008525 IL4 −0.1073 0.0002 0.0042 −0.07098 0.0045
cg15329179 5 131993728 IL13 −0.08296 0.00033 0.0042 −0.0628 0.01595
cg06641959 16 27325254 IL4R 0.05223 0.00251 0.0163 −0.0035 0.8569
cg06967316 5 131993853 IL13 −0.04903 0.00192 0.0163 −0.0096 0.6556
cg14523284 5 131993614 IL13 −0.06025 0.00335 0.0174 0.0049 0.7816
cg23943829 5 132009111 IL4 −0.0549 0.0055 0.0237 −0.0258 0.2095
Diff_IgE_casesdifference in methylation values (M-value scale),Pval_IgE_cases pvalue obtained from differential methylation analysis for serum tIgE levels,
as patients with AD with no history of EH. Non-atopic subjects were defined as having no individual or family history of atopy and average total IgE less than 100 kU/ L, as in [5]. Methylation studies were conducted on a subset of participants including 100 ADEH+, 100 ADEH −, and 100 non-atopic subjects (NA), see Additional file 1: Table S1.
Replication
In order to replicate our initial findings, methylation
stud-ies were conducted on 56 ADEH+, 56 ADEH−, and 56
non-atopic subjects (NA), see Additional file1: Table S1.
Measurements of AD severity
All study participants underwent a detailed history, physical examination, disease severity assessment, and blood draw. For all AD patients, disease severity was assessed by the Rajka-Langeland and the Eczema Area and Severity Index (EASI) scoring systems. The total eo-sinophil count (cells/mm3) was calculated from the “CBC with differential” blood test. Log-transformed values for IgE, Eosinophil count, EASI, and phadiatop were used for the analysis. In order to adjust for any values less than 1 in the data set, before applying a log10 transformation, we added 10 to all eosinophil counts and 1 to all EASI and phadiatop values. A Box-Cox trans-formation with a lambda of 1.5 was applied to the Rajka-Langeland score in order to normalize the distribution.
Quality control and preprocessing
Sample preparation
Standard protocols for preparing DNA methylation data using Illumina’s array technology were followed for discovery and replication. See Additional file 1 for further details.
Discovery data set
Methylation data was quality control tested using the “minfi” R-package [49]. All analyses throughout, with one exception below, were run using R version 3.3.1 and minfi 1.18.6. A total of 39 samples (15 Controls, 15
ADEH− and 9 ADEH+ samples) were removed from
further analysis as a result of either low methylated/ unmethylated median values (Additional file 1: Figure S1) (12 controls, 14 ADEH−, and 7 ADEH+ samples) or due to gender mismatches (4 controls: 1 also failed QC,
1 ADEH−, and 2 ADEH+ samples) between the
pheno-type annotations and the calls generated by the minfi getSexfunction (Additional file1: Figure S2). Three sam-ples (2 Controls and 1 ADEH+ sample) were excluded from the study as they did not meet the requirement of “Non-Hispanic” and were ineligible per the protocol re-quirements. One of the three samples (Control) was also a QC failure so there were 41 samples excluded. Samples
were run in seven batches and excluding 41 samples left the last batch with just two samples (ADEH−). In order to balance the samples within batches on their pheno-type, these two samples were also excluded. After filter-ing samples for quality control (see Additional file 1),
the remaining 257 samples (Table 1) were normalized
using the minfi stratified quantile option. Probes map-ping either to the X or Y chromosomes or in close prox-imity to SNPs (at the CpG site or in the single-base extension site for the array probe) were removed, leaving 456,513 CpG probes for analysis.
Replication data set
Because the Methylation 450K array was discontinued by Illumina between generation of the discovery data set and the replication data set, the Methylation EPIC chip with 866,836 probes was used for our replication sam-ples. Of the CpGs interrogated by the Methylation 450K array, 93% were also included on the EPIC 850K chip. The CpGs moved forward to replication from our dis-covery data set were among those included on the new platform.
Methylation data was quality control tested using the minfi R-package [49]. Of the 168 samples run, there was one sample that failed the initial experimental QC. One hundred and sixty-seven samples were run through the QC pipeline. Including that sample, a total of 6 samples (1 Control, 3 ADEH−, and 2 ADEH+ samples) were re-moved from further analysis as a result of either
tech-nical issues while performing the assay or low
methylated/unmethylated median values (Additional file 1: Figure S1)(1 Control, 1 ADEH−, and 1 ADEH+ sam-ples) or due to gender mismatches (2 ADEH−: 1 also failed QC and 2 ADEH+ samples) between the pheno-type annotations and the calls generated by the minfi getSexfunction (Additional file1: Figure S2). There were 19 samples that were inadvertently included in discovery and replication data sets. These 18 samples (ADEH+) were excluded (1 was a QC failure) from the analysis. After filtering samples for quality control (see Additional file 1), the remaining 144 samples (Table 1) were nor-malized using the minfi stratified quantile option. Probes mapping either to the X or Y chromosomes or in close proximity to SNPs (at the CpG site or in the single-base extension site for the array probe) were removed, leaving 817,465 CpG probes for analysis. See Additional file 1 for further details about QC.
Data analysis
Cell type distribution
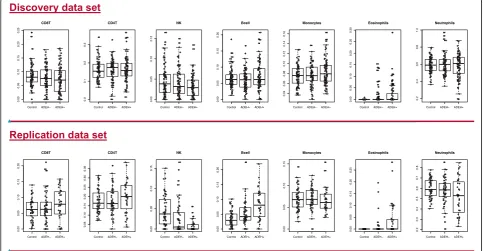
Significant heterogeneity among different cell types as found in blood (either whole or in PBMC fractions) has been conclusively demonstrated to confound differential methylation studies [50]. To test and control for the pos-sibility of apparent changes in methylation status that may result from changes in cell-type composition across group, we used the minfi R-package, which incorporates the method of Jaffe and Irizarry [50] to predict blood cell count distributions for up to seven cell types: CD4T, CD8T, eosinophils, neutrophils, B-cells, natural killer cells, and monocytes. Boxplots of estimated cell fractions of each of seven cell types for individuals split by pheno-type group are shown in Fig.4. We included these seven components in our initial models. In addition, a com-bined granulocyte signal composed of eosinophil and neutrophil components can be estimated, resulting in six cell-type fractions. We used these six cell-type estimates in later analyses.
Batch adjustment
The missMethyl package was developed specifically for analysis of 450K and EPIC array data and offers an im-plementation of RUV-inverse [51] called RUVm [52] as a solution for removing batch effects and unknown, un-wanted variation from the data. We used this method to ensure we were appropriately adjusting for batch effects in our linear models.
Detection of differentially methylated positions (DMPs)
In both the discovery and replication analyses, DMPs were detected using standard linear modeling ap-proaches with covariates age, sex and batch, and esti-mates of either six or seven cell-type fractions, along with batch effect factors (estimated by RUVm). More specifically, our model was of the form:
DNAmðM−valueÞ β0þβ1ðPredictor of interestÞ þβ2ðSexÞ þβ3ðAgeÞ þβ4ðCD8TÞ
þβ5ðCD4TÞ þβ6ðNKÞ þβ7ðB cellÞ
þβ8ðmonocytesÞ þβ9ðeosinophilsÞ þβ10
neutrophils
ð Þ þXLl¼1γlCl
where the term PLl¼1γlCl includes factors estimated to
control for batch effects, and M-value refers to logit-transformed percent methylation values.
P-value distribution adjustment was performed using bacon [53] and then FDR-adjusted q-values were esti-mated. In all cases, an FDR cutoff of 0.05 was used to declare significance in discovery; for the 9 results carried forward to replication, a Bonferroni adjustment was used, giving apvalue cutoff of 0.0056. For further details of modeling choices, please see Additional file 1. The following analyses were carried out:
1. Genome-wide tests of differential methylation by group (ADEH+ vs healthy control, ADEH−vs
healthy control, ADEH+ vs ADEH−) adjusting for 7 cell types.
2. Gene-based tests of differential methylation by group (ADEH+ vs healthy control, ADEH−vs healthy control, ADEH+ vs ADEH−), adjusting for 7 cell types.A set of 129 CpGs that mapped to a set of genes previously shown to be of interest in EH, specificallyFLG,LCE1B,RPTN,IL4,IL13and its receptors,IFNs, andTSLPwas considered. 3. Genome-wide tests of differential methylation by
group (ADEH+ vs healthy control, ADEH−vs healthy control, ADEH+ vs ADEH−) adjusting for 6 cell types (granulocytes instead of eosinophils and neutrophils). For all CpGs significant from this analysis, further modeling was performed using the discovery data to assess the association between severity measures (eosinophil counts, total serum IgE (tIgE) levels, EASI score, and Rajka-Langeland score) and methylation. Results from this analysis were declared significant ifq< 0.05. No results from this analysis were carried forward for replication. 4. Gene-based tests of differential methylation by
serum tIgE level, adjusting for 6 cell types (granulocytes instead of eosinophils and
neutrophils). A set of 26 CpGs in theIL4,IL13, and IL4Rgenes was considered to test a specific hypothesis of the role of these genes on serum tIgE.
Gene ontology (GO) enrichment analysis
Gene ontology enrichment analysis was performed with the gomethfunction in missMethyl, which is designed specific-ally to address potential biases in measuring gene-set en-richment with the 450K methylation array [54].
Additional files
Additional file 1:Supplementary text.Figure S1. QC plot of methylated to unmethylated median intensities for discovery and replication data sets.Figure S2. Plot of chrX vs chrY median intensities to identify gender mismatches for discovery and replication data sets.Figure S3. QQ plots ofpvalues (three phenotype comparisons) from models with seven cell types (top) and six cell types (bottom) prior and post bacon adjustment. Figure S4. QQ plots ofpvalues (severity analysis) from models with seven cell types (top) and six cell types (bottom) prior and post bacon adjustment.Figure S5. Box plots for top 27 CpGs significant in ADEH+ vs controls analysis.Figure S6. Scatter plots of top 27 CpGs significant in eosinophil-methylation analysis showing eosinophil levels against methylation values.Table S1. Clinical Characteristics table for all samples in discovery and replication data sets.Table S10. References to support the selection of genes for our gene-based analysis. (DOCX 4040 kb)
Additional file 2:Table S2andS3. DMPs significant from gene-based analysis for both phenotype groups and severity scores. (XLSX 31 kb)
Additional file 3:Table S4. DMPs significant from ADEH−vs controls and/or ADEH+ vs controls analysis at an FDR threshold of 0.05 from model adjusting for six cell types. (XLSX 91 kb)
Additional file 4:Tables S5–S8.DMPs significant from severity analysis to follow up on results in Additional file3: Table S4. (XLSX 120 kb)
Additional file 5:Table S9. Gene ontology (GO) analysis results for ADEH+ vs healthy controls. (XLSX 11 kb)
Abbreviations
AD:Atopic dermatitis; ADEH−: Atopic dermatitis without a history of EH; ADEH+: Atopic dermatitis with a history of EH; DMP: Differentially methylated probe; EASI: Eczema Area and Severity Index; EH: Eczema herpeticum; FDR: False discovery rate; NA: Non-atopic
Acknowledgements
We thank Kasper D. Hansen and Ivana Yang for technical suggestions and Pat Oldewurtel for technical assistance. We also thank Alan E. Berger and Li Gao for their assistance.
Authors’contributions
KCB led the project, RAM and MAT led the analytical strategies, and MAT and MPB performed the analysis. JF, SB, and MC generated the raw data by running assays in the lab. MAT, MPB, CC, RAM, and KCB wrote the manuscript. THB, IR, NMR, and MD guided and SC and AS helped with the analysis. GD, JH, LCS, RLG, ASP, LAB, and DYL led the experimental design and sample collection. All authors contributed to the interpretation of the results and approved the final manuscript.
Funding
Funding for this work was provided by NIH/NIAID U19 AI117673, The Atopic Dermatitis Research Network. KCB was supported in part by the Mary Beryl Patch Turnbull Scholar Program.
Availability of data and materials
The data sets generated and/or analyzed during the current study are not made publicly available due to data security requirements.
Ethics approval and consent to participate
All the samples used for this study were obtained following written informed consent from participants. The University of Colorado, Johns Hopkins University, and National Jewish Health Institutional Review Board approved the conduct of this study.
Consent for publication Not applicable
Competing interests
R.L. Gallo is a board member of MatriSys Bioscience, received consulting fee from Sente, has pending grants through Novan and Regeneron, and has stock in Sente and MatriSys. K.C. Barnes receives royalties from UpToDate. The other authors declare that they have no competing interests.
Author details
1University of Colorado, Denver, CO, USA.2Department of Biostatistics,
Bloomberg School of Public Health, Baltimore, MD, USA.3Center for Patient
Derived Models (CPDM), Dana-Farber Cancer Institute, Boston, MA, USA.
4Elsevier Inc, Rockville, MD, USA.5Qiagen Sciences Inc, Frederick, MD, USA. 6Department of Medicine, Johns Hopkins University, Baltimore, MD, USA. 7Rho, Inc, Chapel Hill, NC, USA.8Oregon Health & Science University,
Portland, OR, USA.9Boston Children’s Hospital, Boston, MA, USA.10University
of California San Diego, San Diego, CA, USA.11Northwestern University,
Chicago, IL, USA.12University of Rochester, Rochester, NY, USA.13National
Jewish Health, Denver, CO, USA.14University of Colorado Denver, 13001 E.
17th Place, 5th Floor East, 5330A, Aurora, CO 80045, USA.
Received: 25 April 2019 Accepted: 22 July 2019
References
3. Fleischer AB Jr, Boguniewicz M. An approach to pruritus in atopic dermatitis: a critical systematic review of the tacrolimus ointment literature. J Drugs Dermatol. 2010;9(5):488–98.
4. Bradley H, Markowitz LE, Gibson T, McQuillan GM. Seroprevalence of herpes simplex virus types 1 and 2--United States, 1999-2010. Journal of Infectious Diseases. 2013;209(3):325–33.
5. Beck LA, Boguniewicz M, Hata T, Schneider LC, Hanifin J, Gallo R, et al. Phenotype of atopic dermatitis subjects with a history of eczema herpeticum. Journal of Allergy and Clinical Immunology. 2009;124(2):260–9.e7.
6. Leung DYM, Gao P-S, Grigoryev DN, Rafaels NM, Streib JE, Howell MD, et al. Human atopic dermatitis complicated by eczema herpeticum is associated with abnormalities in IFN-γresponse. Journal of Allergy and Clinical Immunology. 2011;127(4):965–73.e5.
7. Bin L, Edwards MG, Heiser R, Streib JE, Richers B, Hall CF, et al. Identification of novel gene signatures in patients with atopic dermatitis complicated by eczema herpeticum. Journal of Allergy and Clinical Immunology. 2014;134(4):848–55. 8. Oh DY, Schumann RR, Hamann L, Neumann K, Worm M, Heine G.
Association of the toll-like receptor 2 A-16934T promoter polymorphism with severe atopic dermatitis. Allergy. 2009;64(11):1608–15.
9. Potaczek DP, Nastalek M, Okumura K, Wojas-Pelc A, Undas A, Nishiyama C. An association of TLR2-16934A >T polymorphism and severity/phenotype of atopic dermatitis. J Eur Acad Dermatol Venereol. 2011;25(6):715–21. 10. Ovsyannikova IG, Haralambieva IH, Kennedy RB, O’Byrne MM, Pankratz VS,
Poland GA. Genetic variation in IL18R1 and IL18 genes and inteferonγ ELISPOT response to smallpox vaccination: an unexpected relationship. The Journal of Infectious Diseases. 2013;208(9):1422–30.
11. Khor CC, Chau TNB, Pang J, Davila S, Long HT, Ong RTH, et al. Genome-wide association study identifies susceptibility loci for dengue shock syndrome at MICB and PLCE1. Nature Genetics. 2011;43(11):1139–41. 12. Pulendran B, Miller J, Querec Troy D, Akondy R, Moseley N, Laur O, et al. Case
of yellow fever vaccine–associated viscerotropic disease with prolonged viremia, robust adaptive immune responses, and polymorphisms in CCR5 and RANTES genes. The Journal of Infectious Diseases. 2008;198(4):500–7. 13. Cianferoni A, Spergel J. The importance of TSLP in allergic disease and its
role as a potential therapeutic target. Expert Review of Clinical Immunology. 2014;10(11):1463–74.
14. Gao P-S, Rafaels NM, Mu D, Hand T, Murray T, Boguniewicz M, et al. Genetic variants in thymic stromal lymphopoietin are associated with atopic dermatitis and eczema herpeticum. Journal of Allergy and Clinical Immunology. 2010;125(6):1403–7.e4.
15. De Benedetto A, Slifka MK, Rafaels NM, Kuo IH, Georas SN, Boguniewicz M, et al. Reductions in claudin-1 may enhance susceptibility to herpes simplex virus 1 infections in atopic dermatitis. Journal of Allergy and Clinical Immunology. 2011;128(1):242–6.e5.
16. Howell MD, Gao P, Kim BE, Lesley LJ, Streib JE, Taylor PA, et al. The signal transducer and activator of transcription 6 gene (STAT6) increases the propensity of patients with atopic dermatitis toward disseminated viral skin infections. Journal of Allergy and Clinical Immunology. 2011;128(5):1006–14. 17. Gao P-S, Leung DYM, Rafaels NM, Boguniewicz M, Hand T, Gao L, et al.
Genetic variants in interferon regulatory factor 2 (IRF2) are associated with atopic dermatitis and eczema herpeticum. Journal of Investigative Dermatology. 2012;132(3):650–7.
18. Kim KW, Myers RA, Lee JH, Igartua C, Lee KE, Kim YH, et al. Genome-wide association study of recalcitrant atopic dermatitis in Korean children. Journal of Allergy and Clinical Immunology. 2015;136(3):678–84.e4.
19. Narbutt J, Wojtczak M, Zalińska A, Salinski A, Przybylowska-Sygut K, Kuna P, et al. The A/A genotype of an interleukin-17A polymorphism predisposes to increased severity of atopic dermatitis and coexistence with asthma. Clinical and Experimental Dermatology. 2014;40(1):11–6.
20. Wilkowska A, GleńJ, Zabłotna M, Trzeciak M, Ryduchowska M, Sobjanek M, et al. The association ofGM-CSF-677A/C promoter gene polymorphism with the occurrence and severity of atopic dermatitis in a Polish population. International Journal of Dermatology. 2013;53(3):e172–e4.
21. Javierre BM, Fernandez AF, Richter J, Al-Shahrour F, Martin-Subero JI, Rodriguez-Ubreva J, et al. Changes in the pattern of DNA methylation associate with twin discordance in systemic lupus erythematosus. Genome Research. 2009;20(2):170–9.
22. Liu Y, Aryee MJ, Padyukov L, Fallin MD, Hesselberg E, Runarsson A, et al. Epigenome-wide association data implicate DNA methylation as an intermediary of genetic risk in rheumatoid arthritis. Nature Biotechnology. 2013;31(2):142–7.
23. Heyn H, Moran S, Esteller M. Aberrant DNA methylation profiles in the premature aging disorders Hutchinson-Gilford Progeria and Werner syndrome. Epigenetics. 2013;8(1):28–33.
24. Potaczek DP, Harb H, Michel S, Alhamwe BA, Renz H, Tost J. Epigenetics and allergy: from basic mechanisms to clinical applications. Epigenomics. 2017; 9(4):539–71.
25. Ziyab AH, Karmaus W, Holloway JW, Zhang H, Ewart S, Arshad SH. DNA methylation of the filaggrin gene adds to the risk of eczema associated with loss-of-function variants. Journal of the European Academy of Dermatology and Venereology. 2012;27(3):e420–e3.
26. Liang Y, Wang P, Zhao M, Liang G, Yin H, Zhang G, et al. Demethylation of the FCER1G promoter leads to FcεRI overexpression on monocytes of patients with atopic dermatitis. Allergy. 2011;67(3):424–30.
27. Wang IJ, Chen SL, Lu TP, Chuang EY, Chen PC. Prenatal smoke exposure, DNA methylation, and childhood atopic dermatitis. Clinical & Experimental Allergy. 2013;43(5):535–43.
28. Rodríguez E, Baurecht H, Wahn AF, Kretschmer A, Hotze M, Zeilinger S, et al. An integrated epigenetic and transcriptomic analysis reveals distinct tissue-specific patterns of DNA methylation associated with atopic dermatitis. Journal of Investigative Dermatology. 2014;134(7):1873–83.
29. Boguniewicz M, Leung DYM. Atopic dermatitis: a disease of altered skin barrier and immune dysregulation. Immunological Reviews. 2011;242(1):233–46. 30. Boguniewicz M, Leung DYM. Recent insights into atopic dermatitis and
implications for management of infectious complications. Journal of Allergy and Clinical Immunology. 2010;125(1):4–13.
31. Arathimos R, Suderman M, Sharp G, Burrows K, Granell R, Tilling K, et al. Epigenome-wide association study of asthma and wheeze in childhood and adolescence. Clin Epigenetics. 2017;9:112.https://doi.org/10.1186/s13148-017-0414-7.
32. Chen W, Wang T, Pino-Yanes M, Forno E, Liang L, Yan Q, et al. An epigenome-wide association study of total serum IgE in Hispanic children. Journal of Allergy and Clinical Immunology. 2017;140(2):571–7.
33. Potaczek DP, Kabesch M. Current concepts of IgE regulation and impact of genetic determinants. Clin Exp Allergy. 2012;42(6):852–71.
34. Beck LA, Thaçi D, Hamilton JD, Graham NM, Bieber T, Rocklin R, et al. Dupilumab treatment in adults with moderate-to-severe atopic dermatitis. New England Journal of Medicine. 2014;371(2):130–9.
35. Oettgen HC. Fifty years later: Emerging functions of IgE antibodies in host defense, immune regulation, and allergic diseases. J Allergy Clin Immunol. 2016;137(6):1631–45.
36. Kim HS, Kim JH, Seo YM, Chun YH, Yoon J-s, Kim HH, et al. Eosinophil-derived neurotoxin as a biomarker for disease severity and relapse in recalcitrant atopic dermatitis. Annals of Allergy, Asthma & Immunology. 2017;119(5):441–5.
37. Liu F-T, Goodarzi H, Chen H-Y. IgE, Mast cells, and eosinophils in atopic dermatitis. Clinical Reviews in Allergy & Immunology. 2011;41(3):298–310. 38. Walker C, KäGi MK, Ingold P, Braun P, Blaser K, Bruijnzeel-Koomen CAFM, et
al. Atopic dermatitis: correlation of peripheral blood T cell activation, eosinophilia and serum factors with clinical severity. Clinical & Experimental Allergy. 1993;23(2):145–53.
39. Shin J-S, Greer AM. The role of FcεRI expressed in dendritic cells and monocytes. Cellular and Molecular Life Sciences. 2015;72(12):2349–60. 40. Bin L, Leung DYM. Genetic and epigenetic studies of atopic dermatitis.
Allergy Asthma Clin Immunol. 2016;12:52.
41. Baurecht H, Hotze M, Brand S, Büning C, Cormican P, Corvin A, et al. Genome-wide comparative analysis of atopic dermatitis and psoriasis gives insight into opposing genetic mechanisms. The American Journal of Human Genetics. 2015;96(1):104–20.
42. Trzeciak M, Sakowicz-Burkiewicz M, Wesserling M, GleńJ, Dobaczewska D, Bandurski T, et al. Altered axpression of genes encoding cornulin and repetin in atopic dermatitis. International Archives of Allergy and Immunology. 2017;172(1):11–9.
43. Liang L, Willis-Owen SAG, Laprise C, Wong KCC, Davies GA, Hudson TJ, et al. An epigenome-wide association study of total serum immunoglobulin E concentration. Nature. 2015;520(7549):670–4.
44. Everson TM, Lyons G, Zhang H, Soto-Ramírez N, Lockett GA, Patil VK, et al. DNA methylation loci associated with atopy and high serum IgE: a genome-wide application of recursive Random Forest feature selection. Genome Med. 2015;7:89.
46. Schieck M, Sharma V, Michel S, Toncheva AA, Worth L, Potaczek DP, et al. A polymorphism in the TH 2 locus control region is associated with changes in DNA methylation and gene expression. Allergy. 2014;69(9):1171–80. 47. Ober C, Yao T-C. The genetics of asthma and allergic disease: a 21st century
perspective. Immunological Reviews. 2011;242(1):10–30.
48. Novak N, Peng W, Yu C. Network of myeloid and plasmacytoid dendritic cells in atopic dermatitis. Adv Exp Med Biol. 2007;601:97–104.
49. Aryee MJ, Jaffe AE, Corrada-Bravo H, Ladd-Acosta C, Feinberg AP, Hansen KD, et al. Minfi: a flexible and comprehensive Bioconductor package for the analysis of Infinium DNA methylation microarrays. Bioinformatics. 2014; 30(10):1363–9.
50. Jaffe AE, Irizarry RA. Accounting for cellular heterogeneity is critical in epigenome-wide association studies. Genome Biology. 2014;15(2):R31. 51. Gagnon-Bartsch JAJL, Speed TP. Removing unwanted variation from high
dimensional data with negative controls. Berkeley: Tech Reports from Dep Stat Univ California; 2013. p. 1–112.
52. Maksimovic J, Gagnon-Bartsch JA, Speed TP, Oshlack A. Removing unwanted variation in a differential methylation analysis of Illumina
HumanMethylation450 array data. Nucleic Acids Research. 2015;43(16):e106–e. 53. van Iterson M, van Zwet EW, Heijmans BT. Controlling bias and inflation in
epigenome- and transcriptome-wide association studies using the empirical null distribution. Genome Biology. 2017;18:1.
54. Geeleher P, Hartnett L, Egan LJ, Golden A, Raja Ali RA, Seoighe C. Gene-set analysis is severely biased when applied to genome-wide methylation data. Bioinformatics. 2013;29(15):1851–7.
Publisher’s Note