R E S E A R C H
Open Access
Evaluation of suitable reference genes for
normalization of real-time reverse transcription
PCR analysis in colon cancer
Lise Aa Sørby
1*, Solveig N Andersen
2,3, Ida RK Bukholm
3,4,5, Morten B Jacobsen
1,3,6Abstract
Background:Real-time reverse transcription PCR (qRT-PCR) is frequently used for gene expression quantification due to its methodological reproducibility and sensitivity. The gene expression is quantified by normalization to one or more reference genes which are presumed stably expressed throughout a given experiment. The aim of this study was to validate a standardized experimental setup to identifying reference genes for normalization of qRT-PCR in the metastatic and non-metastatic colon cancer.
Methods:In this study, expression of 16 commonly used reference genes was quantified in tumour tissue and individual-matched normal mucosa in 18 non-metastatic colon cancer patients and 20 colon cancer patients with distant metastases using TaqMan Low Density Array (TLDA). The expression stability was determined and
compared by means of geNorm and NormFinder.
Results:Two pairs of genes, HPRT1/PPIA and IPO8/PPIA, were identified to be suitable to normalize gene expression data in metastatic and non-metastatic colon cancer patients, according to geNorm and NormFinder respectively.
Conclusion:We propose a standardized approach of finding the most suitable reference gene(s) in every qRT-PCR experiment using TLDA.
Background
qRT-PCR is one of the most sensitive methods for mRNA detection and quantification. The method has also become the preferred method for validating results obtained by other techniques, such as microarray [1]. There are differences among different qRT-PCR assays due to biological and technical variations [2,3]. In order to identify truly gene specific variations it is important to use a suitable normalization method. One of the most commonly used approaches involves relative quantifica-tion of target genes against one or more reference genes which are thought to be stably expressed in the examined tissue [4]. There have been a number of reports that demonstrate that the expression levels of putative refer-ence genes vary extensively in different tissues and dis-eases and thus are unsuitable for normalization purposes
[5-15]. Consequently, each research group has to validate multiple reference genes in their own experimental setup and normalize qRT-PCR data against a few reference genes tested from independent pathways using at least one algorithm. It appears that improvements in methods of identifying reference genes are more important than the identification of the particular reference genes them-selves [16].
It has been argued for use of multiple genes in the nor-malization of qRT-PCR analysis and several algorithms have been developed [17-20]. Vandesompele et al., 2002, used the geometric mean of the most stable genes to improve the accuracy of the analysis in a method called geNorm [19]. This method relies on the principle that the expression ratio of two ideal reference genes is identi-cal in all samples regardless of the experimental condi-tions. For every reference gene geNorm determine the pairwise variation with all other reference genes. The average pairwise variation of a particular gene is defined as the internal control stability measure; M. Genes with
* Correspondence: [email protected] 1
Quality and Research Department, Ostfold Hospital Trust, 1603 Fredrikstad, Norway
Full list of author information is available at the end of the article
the lowest M values are the most stable ones. Another algorithm in which the expressional stability of genes is evaluated is NormFinder [17]. NormFinder estimates the intra-group and the inter-group expression variation. Both of these sources of variation are combined into a stability value. This method can account for heterogene-ity of the tested tissue samples. Genes with the lowest stability value have the most stable expression.
Colorectal cancer is among the most frequent malignant diseases worldwide, and is one of the leading causes of cancer-related deaths [21]. The majority of colorectal tumours develop along a well-defined adenoma-carcinoma sequence in which oncogenes are activated and tumour suppressor genes lose their function [22]. Despite a high 5-year survival rate in early colorectal cancer, only 10% of the patients with distant metastases survive after five years [23]. Thus, it is important to elucidate the biology that contributes to this progression, especially those processes that facilitates the switch to invasive and metastatic dis-ease. Biological changes are a result of partly differential gene expression, which can be confirmed by qRT-PCR. It is necessary to validate reference genes in the particular experimental system in order to trust the differential gene expressions which are detected. Previous studies have tried to find universally stable reference genes across sev-eral types of cancers, including colon cancer [24-26]. Recent reports, however, claim that stably expressed genes in one tumour type may not predict stable expression in another tumour type [12,27]. Moreover, results in one tumour type, like colorectal cancer, show stably expressed genes in one experimental in which are different from the stably expressed genes in another experimental setup [28-30]. Hence, reference genes should be validated and selected in every experiment in any tissue type. Recently, it has been suggested that the focus should be on introdu-cing and validating novel approach for reference gene identification and standardizing experimental setup rather than giving general suggestions for different tissues [16]. Applying TaqMan Low Density Array (TLDA) to examin-ing reference genes is a step towards a more standardized experimental setup. TLDA was evaluated in colorectal cancer by Lü et al., 2008, as a roughly robust and labour-saving method for gene quantification compared with rou-tine qRT-PCR [31]. Well-designed TaqMan probes require little optimization, and TLDA allows simultaneously real-time detection of many gene products in several samples offering higher through put than established single array method [31,32]. Hence, in the present study we used TLDA to find potential reference genes for data normali-zation in qRT-PCR experiments in metastatic and non-metastatic colon cancer patients. The gene expression of 16 commonly used reference genes in tumour tissue and individual-matched normal mucosa of metastatic and non-metastatic colon cancer patients were analyzed and
the expression stability was determined and compared using geNorm and NormFinder.
Methods
Patients and tissue specimens
RNAlater-stored tumour tissue samples and individual-matched normal mucosa were obtained from 38 patients with colonic adenocarcinoma who underwent resection at Akershus University Hospital Trust between 2004 and 2009. The dissected tissue samples were collected in the operating room and stored immediately in approxi-mately five volumes of RNAlater (Ambion Inc., Austin TX, USA) and frozen at -80°C. Eighteen patients with non-metastatic disease, Dukes B (with a minimum of 12 negative lymph nodes) where no metastases occurred during 5 years follow up, and 20 patients originally staged as Duke C who displayed distant metastases dur-ing a 5 year follow-up (Duke C) or patients classified as Dukes D were included in the study. There were 22 women and 16 men with a mean age of 69 +/- 14 years (range 29-92) at surgery. Three sectioned pieces of the tumour samples were made. The central piece was further processed for RNA isolation, while the two end pieces were fixed in formalin and embedded in paraffin (FFPE). Fourμm sections of FFPE samples were stained with Hagens Hematoxylin and examined by a patholo-gist for determination of percentage tumour cells. To avoid bias from necrosis or minimal tumour representa-tion we included tumour tissue samples with more than 70% tumour cells.
mRNA isolation
Total RNA isolation was performed using the method of Wei and Khan, 2002, [33] modified according to T. Lüders (unpublished work) to also include miRNA for further analyses. Approximately 60 mg frozen tissue was homoge-nized in TriReagent (Ambion) using Mixer Mill MM301 (Retch) for 2 × 2 min at 30 Hz. After phase-separation with chloroform, the aqueous phase (containing RNA) was mixed with 1.5 volumes 100% ethanol and transferred to an RNeasy Mini spin column (Qiagen). Further proces-sing was performed following the manufacturer’s protocol. A DNase treatment was included in the procedure. RNA was eluted in 60μl RNase-free water and stored at -80°C. The concentration of each RNA sample was obtained from A260 measurements using the NanoDrop 2000
(Thermo Fischer Scientific Inc.). The RNA integrity num-ber (RIN) was tested by using the Agilent 2100 Bioanalyzer (Agilent Technologies).
cDNA synthesis
Complementary DNAs (cDNAs) were produced from 1
the manufacturer’s instructions. The following thermal cycler conditions were used: 5 min at 25°C, 30 min at 42°C and 5 min at 85°C. Three random RNA samples were additionally run in the absence of reverse tran-scriptase enzyme to assess the degree of contaminating genomic DNA. Real-time PCR with genomic DNA spe-cific assay revealed that RNA was free of genomic DNA (data not shown).
TLDA design and preparation
TaqMan Endogenous Control Assays (Applied Biosys-tems) are 384-well microfluidic cards containing 16 preop-timized human TaqMan Gene Expression Assays commonly used as endogenous controls and genes that exhibit minimal differential expression across different tis-sues (Table 1). The assay was performed in triplicates. 50
μl cDNA (1μg mRNA) was used as a template. Matched samples from 4 patients where loaded on each card. NTC (no template control) was added in one loading port. PCR amplification was performed using the ABI Prism 7900 HT Real Time PCR System (Perkin-Elmer Applied Biosys-tems, Foster City, California, USA). Thermal cycling con-ditions were used as follows: 2 min at 50°C, 10 min at 94.5°C, 30 sec at 97°C, and 1 min at 59.7°C for 40 cycles.
TLDA analysis and Statistical analysis
RealTime Statminer 3.0 Software (Integromics, Madrid, Spain) was used for implementation of quality controls in addition to calculation of optimal endogenous controls.
This program uses the comparative Ct method for relative quantification analysis, and the results are expressed as a fold change of expression levels (DDCt values). The mean value of triplicates was applied for all calculations. Med-ians were used to replace missing values that occurred due to inconsistencies between replicates rather than from low expression. The detectability threshold was set to 36, meaning failing detectors are those with a Ct greater than or equal to 36. To measure the expressional stability of the candidate endogenous control genes, two commonly used programs were employed: geNorm [19] and NormFinder [17], both of which available in RealTime Statminer. Ct coefficients of variations (CtCV%) were calculated for every reference gene across all samples. All data are expressed as means ± SD. Except from the analyses in RealTime Statminer, all other calculations were performed using SPSS (version 14.0; SPSS, Chicago, IL, USA).
Research Ethics
This project was approved by the Regional Committee for Medical Research Ethics, Eastern Norway. The Nor-wegian Social Science Data Service has approved the collection and analysis of data.
Results
RNA quality control
mRNAs of 16 potential reference genes were quantified by qRT-PCR using equal amounts of RNA templates from every tissue samples. The integrity of RNA (RIN)
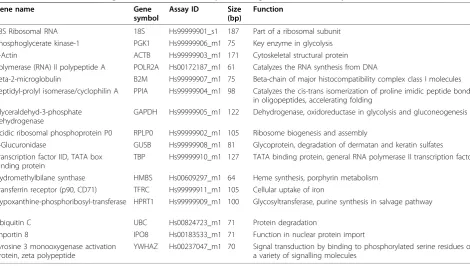
Table 1 Candidate reference genes included in the TaqMan Endogenous Control Assay
Gene name Gene
symbol
Assay ID Size (bp)
Function
18S Ribosomal RNA 18S Hs99999901_s1 187 Part of a ribosomal subunit
Phosphoglycerate kinase-1 PGK1 Hs99999906_m1 75 Key enzyme in glycolysis
Β-Actin ACTB Hs99999903_m1 171 Cytoskeletal structural protein
Polymerase (RNA) II polypeptide A POLR2A Hs00172187_m1 61 Catalyzes the RNA synthesis from DNA
Beta-2-microglobulin B2M Hs99999907_m1 75 Beta-chain of major histocompatibility complex class I molecules
Peptidyl-prolyl isomerase/cyclophilin A PPIA Hs99999904_m1 98 Catalyzes the cis-trans isomerization of proline imidic peptide bonds in oligopeptides, accelerating folding
Glyceraldehyd-3-phosphate dehydrogenase
GAPDH Hs99999905_m1 122 Dehydrogenase, oxidoreductase in glycolysis and gluconeogenesis
Acidic ribosomal phosphoprotein P0 RPLP0 Hs99999902_m1 105 Ribosome biogenesis and assembly
Β-Glucuronidase GUSB Hs99999908_m1 81 Glycoprotein, degradation of dermatan and keratin sulfates
Transcription factor IID, TATA box binding protein
TBP Hs99999910_m1 127 TATA binding protein, general RNA polymerase II transcription factor
Hydromethylbilane synthase HMBS Hs00609297_m1 64 Heme synthesis, porphyrin metabolism
Transferrin receptor (p90, CD71) TFRC Hs99999911_m1 105 Cellular uptake of iron Hypoxanthine-phosphoribosyl-transferase
1
HPRT1 Hs99999909_m1 100 Glycosyltransferase, purine synthesis in salvage pathway
Ubiquitin C UBC Hs00824723_m1 71 Protein degradation
Importin 8 IPO8 Hs00183533_m1 71 Function in nuclear protein import
Tyrosine 3 monooxygenase activation protein, zeta polypeptide
was ranged from 7.2 to 10.0, with a mean value of 8.9, which indicates good preservation of the RNA; thus sui-table for RNA studies.
Range of expression of candidate endogenous control genes
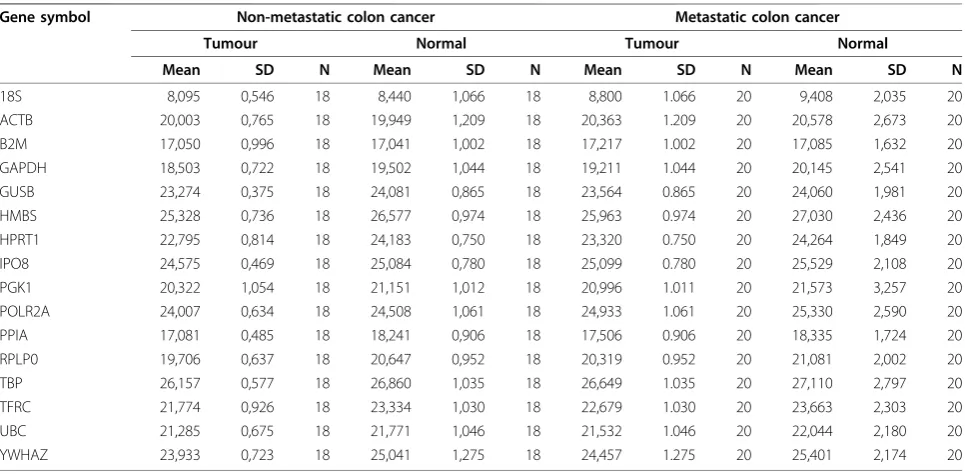
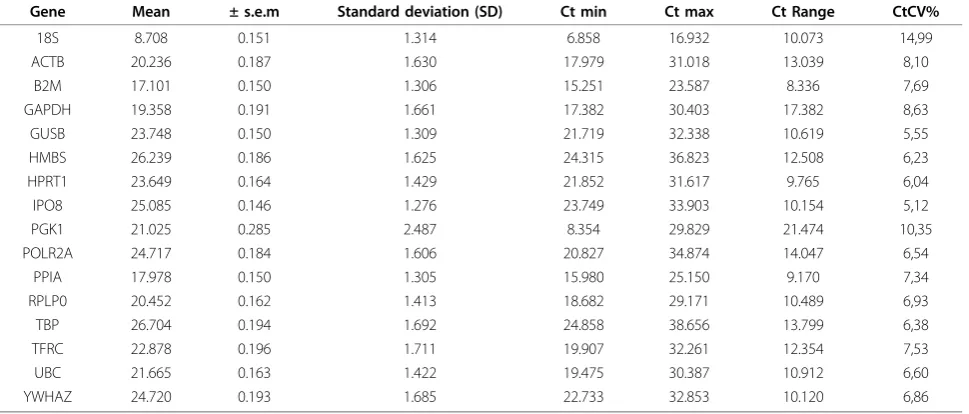
Table 2 presents the mean Ct and SD values obtained across the candidate endogenous control genes in nor-mal and tumour tissue separated into the two groups of patients; non-metastatic and metastatic colon cancer patients. Additional calculations across all patients are shown in Table 3. Mean Ct values ranged from 8.71 (± 1.31 SD) (18S) across all samples to 26.70 (± 1.69 SD) (TBP). The gene with the lowest standard deviation across all samples was IPO8 which showed an overall SD of 1.28, while the gene with the highest standard deviation across the samples was PGK1 with an overall SD of 2.49. The reference genes displayed a relatively broad range of expression. PGK1 had the widest range of Ct values between 8.35 and 29.83 (mean 21.03 ± 2.49 SD, range of 21.47), while B2M had the narrowest range of Ct values between 15.25 and 23.59 (mean 17.10 ± 1.31 SD, range of 8.34). During the subsequent analyses using Statminer Ct values above 36 are excluded and imputed, because Ct values above this level are not reli-able. This quality control will thus influence the Ct ranges.
Results of validation programs
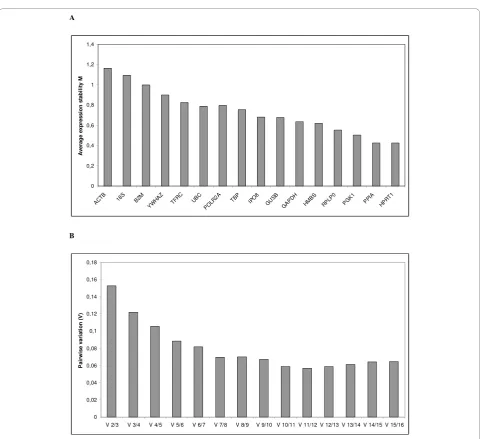
In order to determine the stability of genes and thus find the best endogenous controls, the data were ana-lysed by geNorm and NormFinder. In these analyses,
medians were used to replace missing values because they occurred due to inconsistencies between replicates rather than from low expression. The ranking of the gene expression stability values (M) of the tested endo-genous control genes using geNorm is illustrated in Figure 1.A. The genes with the highest M, i.e. the least stable genes, gets stepwise excluded until the most stable genes remain. The best two genes are ranked without distinguishing between them. HPRT1 and PPIA were identified as the most stable pair of genes, followed by PGK1 as the third most stable gene. Furthermore, pairwise variation were also calculated using geNorm in order to determine the optimal number of genes required for normalization, Figure 1.B. The analysis showed that HPRT1 and PPIA may be sufficient for cal-culation of the normalization factor and normalization to genes of interest, since the V2/3 value is in this ana-lysis equal to the cut-off value of 0.15 [19]. However, there is a gradual decrease in the pairwise variability plot and thereby an improvement to the normalization factor by adding additional genes to the calculation. Nevertheless, two or three genes would be satisfactory for normalization according to the cut-off value of 0.15. While geNorm uses a pairwise comparison approach, NormFinder first estimates the intra-group and then the inter-group variability of expression of a control gene [17]. In contrast to the geNorm results, NormFinder ranked RPLP0 as the most stable gene, with TBP and GUSB closely behind as second and third, respectively (Figure 2). However, using this algorithm the combina-tion of IPO8 and PPIA turned out to have a lower stabi-lity score than the most stable single gene. Thus this
Table 2 Cycle threshold (Ct) values of candidate reference genes divided in the four tissue groups
Gene symbol Non-metastatic colon cancer Metastatic colon cancer
Tumour Normal Tumour Normal
Mean SD N Mean SD N Mean SD N Mean SD N
18S 8,095 0,546 18 8,440 1,066 18 8,800 1.066 20 9,408 2,035 20
ACTB 20,003 0,765 18 19,949 1,209 18 20,363 1.209 20 20,578 2,673 20
B2M 17,050 0,996 18 17,041 1,002 18 17,217 1.002 20 17,085 1,632 20
GAPDH 18,503 0,722 18 19,502 1,044 18 19,211 1.044 20 20,145 2,541 20
GUSB 23,274 0,375 18 24,081 0,865 18 23,564 0.865 20 24,060 1,981 20
HMBS 25,328 0,736 18 26,577 0,974 18 25,963 0.974 20 27,030 2,436 20
HPRT1 22,795 0,814 18 24,183 0,750 18 23,320 0.750 20 24,264 1,849 20
IPO8 24,575 0,469 18 25,084 0,780 18 25,099 0.780 20 25,529 2,108 20
PGK1 20,322 1,054 18 21,151 1,012 18 20,996 1.011 20 21,573 3,257 20
POLR2A 24,007 0,634 18 24,508 1,061 18 24,933 1.061 20 25,330 2,590 20
PPIA 17,081 0,485 18 18,241 0,906 18 17,506 0.906 20 18,335 1,724 20
RPLP0 19,706 0,637 18 20,647 0,952 18 20,319 0.952 20 21,081 2,002 20
TBP 26,157 0,577 18 26,860 1,035 18 26,649 1.035 20 27,110 2,797 20
TFRC 21,774 0,926 18 23,334 1,030 18 22,679 1.030 20 23,663 2,303 20
UBC 21,285 0,675 18 21,771 1,046 18 21,532 1.046 20 22,044 2,180 20
combination is more suitable for normalizing qPCR. There was considerably closer agreement between the geNorm and Normfinder results on the least stable genes, with the order of 4 out of 5 worst ranking genes being identical; ACTB, 18S, B2M and TFRC. These genes had a stability value more than twice so high (geNorm) and more than 3 times so high (NormFinder) as the best ranking genes.
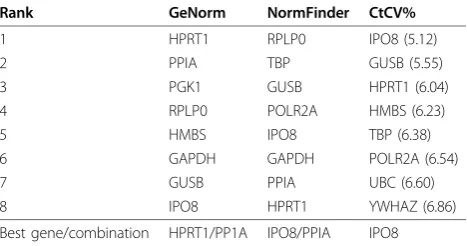
Due to different ranking by geNorm and NormFinder of the most stable genes, cycle threshold coefficient of variation (CtCV%) was calculated for each of them. This calculation was recommended by Caradec et al., 2010, in order to validate the NormFinder and geNorm results [12]. According to the CtCV% calculation, one of the NormFinder pairing genes, IPO8, was ranked as the most stable gene with a CtCV% of 5.12%, which supports the NormFinder result. GUSB (5.5%) and HPRT1 (6.04%) are ranked as the second and third respectively, which do not give identical ranking of results obtain using geNorm and NormFinder. The least stable gene using CtCV% was 18S (14.99%), which was according to geNorm and NormFinder ranked as the second and fifth least stable gene, respectively. The summary of the best ranking genes as determined by each of these calculations is illu-strated in Table 4.
Discussion
qRT-PCR has been a breakthrough for the quantification of gene expression in many biological systems. In this study we assume that no single gene stays unaffected under malignant development in colon cancer and there-fore identify genes with least variation. We identified two pairs of genes, HPRT1/PPIA and IPO8/PPIA, which may
be suitable to normalize gene expression data in studies conducted in metastatic and non-metastatic colon cancer patients. In addition, we found that B2M, ACTB and 18S were unstable in the tissue examined. We propose a stan-dardized approach of finding the most suitable reference gene(s) in every qRT-PCR experiment using TLDA.
Complex signalling pathways have been related to the metastatic progression of colon cancer, hence pathway based gene expression assays, often revealed by qRT-PCR, are significant in cancer biology. Publications deal-ing with colon cancer have reported gene expression studies in metastatic diseases [34,35]. However, the sta-bility of the reference gene expression in metastatic and non-metastatic primary tumours remains crucial. Ramaswamy et al., 2003, described a gene expression signature that distinguished primary and metastatic ade-nocarcinomas, indicating that the metastatic potential of human tumours is encoded in the bulk of the primary tumour [36], fully in accordance with modern clonal stem cell theories [37]. Hence, one may presume that the metastatic capacity of the primary tumour will influ-ence commonly chosen referinflu-ence genes.
The most recent study of reference genes in colon cancer was reported by Kheirelseid et al., 2010, where 64 colorectal tumours and tumour associated normal specimens were examined using qRT-PCR followed by three different statistical algorithms, geNorm, NormFin-der and qBaseplus [30]. Kheirelseid et al., 2010, found that the combination of two reference genes, B2M and PPIA, more accurately normalized qRT-PCR data in col-orectal cancer. This is in concordance with our findings, where PPIA was one of the two genes identified as the most stable pair. In contrast, B2M was identified as one Table 3 Cycle threshold (Ct) values of candidate endogenous control genes across all tissue samples
Gene Mean ± s.e.m Standard deviation (SD) Ct min Ct max Ct Range CtCV%
18S 8.708 0.151 1.314 6.858 16.932 10.073 14,99
ACTB 20.236 0.187 1.630 17.979 31.018 13.039 8,10
B2M 17.101 0.150 1.306 15.251 23.587 8.336 7,69
GAPDH 19.358 0.191 1.661 17.382 30.403 17.382 8,63
GUSB 23.748 0.150 1.309 21.719 32.338 10.619 5,55
HMBS 26.239 0.186 1.625 24.315 36.823 12.508 6,23
HPRT1 23.649 0.164 1.429 21.852 31.617 9.765 6,04
IPO8 25.085 0.146 1.276 23.749 33.903 10.154 5,12
PGK1 21.025 0.285 2.487 8.354 29.829 21.474 10,35
POLR2A 24.717 0.184 1.606 20.827 34.874 14.047 6,54
PPIA 17.978 0.150 1.305 15.980 25.150 9.170 7,34
RPLP0 20.452 0.162 1.413 18.682 29.171 10.489 6,93
TBP 26.704 0.194 1.692 24.858 38.656 13.799 6,38
TFRC 22.878 0.196 1.711 19.907 32.261 12.354 7,53
UBC 21.665 0.163 1.422 19.475 30.387 10.912 6,60
YWHAZ 24.720 0.193 1.685 22.733 32.853 10.120 6,86
of the most variable genes in the tissue examined. This disparity may be explained by the difference in patient material since Kheirelseid et al., 2010, included all stages of colon cancer and even included rectum tumour sam-ples. Furthermore the percentage of tumour cells in the samples was not addressed. In the study of Kheirelseid et al., 2010, all three algorithms confirmed the selection of the B2M and PPIA pairing as the best combination of reference genes. In the present study however, the geNorm algorithm differs from the results obtained by NormFinder. According to geNorm HPRT1 and PPIA were the most suitable genes for normalization, but
NormFinder suggested IPO8 and PPIA. This discre-pancy confirms previous results reported by Caradec et al., 2010, concluding that the evaluation of suitable reference genes dramatically differs according to the sta-tistical method used [12]. Caradec et al., 2010, investi-gated reference genes in four cell lines treated with four different oxygen concentrations, and observed large var-iations in gene expression results depending of statistical method used. Thus Caradec et al., 2010, recommended Ct coefficients of variation (CtCV%) calculation for each reference gene for validation of the statistical methods. It is defined as the ratio of the standard deviation to the
mean. Genes with low CtCV% value indicate more stable expression of those genes. In the present study, IPO8 was the most stable gene on the basis of CtCV% (5.12%), followed by GUSB (5.55%) and HPRT1 (6.04%) as the second and third most stable gene. Using Norm-Finder IPO8 was one of the genes which were identified as the most stable pair of genes, which may indicate that the CtCV% verifies the NormFinder results. Never-theless, PPIA, which was suggested by both geNorm and NormFinder as one of the stable pair of genes, was ranked as the tenth most stable gene with a CtCV% of 7.34%. This may be explained by the low Ct mean of this particular gene (18.0), resulting in a relatively high CtCV% despite a low standard deviation. Another aspect which strengthens the results achieved by NormFinder compared with geNorm is the argument that geNorm lacks robustness compared with NormFinder [32]. Reports show that exclusion of one sample in a specific tissue collection led geNorm to change a suggested reference gene (18S) from being an unstable gene to
one of the top ranking stable genes [32]. NormFinder also enables estimation of the variation between sample subgroups, like tumour and normal tissue, thus this algorithm can account for heterogeneity in the tested samples, which may be important considering the het-erogeneity of the samples studied.
The optimal normalization will vary with study design. The most suitable reference gene in one medical condi-tion may be regulated in other tissues or diseases. Blan-quicett et al., 2002, found that 18S, S9 and GUS were the least regulated genes among 15 putative reference genes when examining tumour and normal colorectal and liver tissues [28]. Furthermore, Dydensborg et al., 2006, identified B2M as the most appropriate gene for normalizing colon carcinomas comparing to normal mucosa when they investigated seven colon adenocarci-nomas containing both epithelial and stromal cells [29]. B2M was in this study identified as the least stable gene using NormFinder, and the third most variable gene using geNorm. In the present study where the tumour tissue samples consisted of more than 70% tumour cells some of the stromal cells are excluded. This might explain the discrepancies in the ranking of B2M since tumour tissue is heterogeneous and the fraction of dif-ferent cells may influence the gene expression results. Moreover, different patient groups, including age and clinical background, may also give dissimilarities across studies. Experimental variations may also influence the gene expression results, though using triplicates in the qRT-PCR analysis as used in this study will diminish this variation.
Single assays qRT-PCR are time- and labour-intensive, and require relatively large amounts of cDNA and PCR reagents in multivariate gene expression studies. TLDA
Figure 2NormFinder analysis of the candidate reference genes. Genes are presented in an increasing order of stability from left to right with B2M as the least stable gene and RPLP0 as the most stable gene.
Table 4 Ranking and best combination of reference genes determined by geNorm, NormFinder and CtCV%
Rank GeNorm NormFinder CtCV%
1 HPRT1 RPLP0 IPO8 (5.12)
2 PPIA TBP GUSB (5.55)
3 PGK1 GUSB HPRT1 (6.04)
4 RPLP0 POLR2A HMBS (6.23)
5 HMBS IPO8 TBP (6.38)
6 GAPDH GAPDH POLR2A (6.54)
7 GUSB PPIA UBC (6.60)
8 IPO8 HPRT1 YWHAZ (6.86)
overcome these drawbacks since this technique allows for simultaneously detection of expression of up to 384 genes and requires less template cDNA and PCR reagents than routine qRT-PCR [1,31,38-40].
Conclusions
In this study we applied TaqMan Low Density Array in order to identify reference genes in metastatic and non-metastatic colon cancer. The genes often used for nor-malization of gene expression data may be unstable and thus not suited for use, and therefore identifying stable reference genes in the specific experiment is vital for the results. The approach described herein can serve as a template to identify valid reference genes in any disease state. However, the optimal statistical approach to iden-tify the best reference gene(s) remains to be determined. In the present study NormFinder and geNorm identified two different pairs of the most stable genes. The use of CTCV% might be a good validation of the two results. Nevertheless, the expression of target genes should be evaluated and a comparison of the effect of each pair of reference genes should be determined.
Acknowledgements
We thank Department of Clinical Molecular Biology (EpiGen), Akershus University Hospital, Norway, for laboratory facilities, and Randi Bjørseth at Department of Pathology, Akershus University Hospital, Norway, for guidance and technical assistance. The authors declare that they have no conflicts of interest. This study was supported by grants from South Eastern Norway Regional Health Authority, Norway.
Author details
1
Quality and Research Department, Ostfold Hospital Trust, 1603 Fredrikstad, Norway.2Dep. of Pathology, Akershus University Hospital, 1478 Lørenskog, Norway.3Institute of Clinical Medicine, University of Oslo, 0316 Oslo, Norway. 4Dep. of Surgery, Akershus University Hospital, Lørenskog, Norway.5Dep. of
Health Promotion, Akershus University Hospital, Lørenskog, Norway.6Dep. of Chemistry, Biotechnology and Food Science, Norwegian University of Life Sciences, 1432 Ås, Norway.
Authors’contributions
LAAS has carried out the molecular biological work, the statistical analyses and drafted the manuscript. SNA has carried out the collection of patients and tissue specimens and has evaluated the percentage tumour cells in the tumour samples, and additionally helped to draft the manuscript. IRKB and MBJ participated in study design and coordination and helped to draft the manuscript. All authors read and approved the final manuscript.
Competing interests
The authors declare that they have no competing interests.
Received: 9 September 2010 Accepted: 8 November 2010 Published: 8 November 2010
References
1. Abruzzo LV, Lee KY, Fuller A:Validation of oligonucleotide microarray data using microfluidic low-density arrays: a new statistical method to normalize real-time RT-PCR data.BioTechniques2005,38:785-792. 2. Huggett J, Dheda K, Bustin S, Zumla A:Real-time RT-PCR normalisation;
strategies and considerations.Genes Immun2005,6:279-284.
3. Bustin SA, Nolan T:Pitfalls of quantitative real-time reverse-transcription polymerase chain reaction.J Biomol Tech2004,15:155-166.
4. Bustin SA, Mueller R:Real-time reverse transcription PCR and the detection of occult disease in colorectal cancer.Mol Aspects Med2006,
27:192-223.
5. Dheda K, Huggett JF, Bustin SA, Johnson MA, Rook G, Zumla A:Validation of housekeeping genes for normalizing RNA expression in real-time PCR.
BioTechniques2004,37:112-4, 116, 118-9.
6. Bas A, Forsberg G, Hammarstrom S, Hammarstrom ML:Utility of the housekeeping genes 18S rRNA, beta-actin and glyceraldehyde-3-phosphate-dehydrogenase for normalization in real-time quantitative reverse transcriptase-polymerase chain reaction analysis of gene expression in human T lymphocytes.Scand J Immunol2004,59:566-573. 7. Schmid H, Cohen CD, Henger A, Irrgang S, Schlondorff D, Kretzler M:
Validation of endogenous controls for gene expression analysis in microdissected human renal biopsies.Kidney Int2003,64:356-360. 8. Tricarico C, Pinzani P, Bianchi S:Quantitative real-time reverse
transcription polymerase chain reaction: normalization to rRNA or single housekeeping genes is inappropriate for human tissue biopsies.Anal Biochem2002,309:293-300.
9. Johansson S, Fuchs A, Okvist A:Validation of endogenous controls for quantitative gene expression analysis: application on brain cortices of human chronic alcoholics.Brain Res2007,1132:20-28.
10. Allen D, Winters E, Kenna PF, Humphries P, Farrar GJ:Reference gene selection for real-time rtPCR in human epidermal keratinocytes.J Dermatol Sci2008,49:217-225.
11. Goidin D, Mamessier A, Staquet MJ, Schmitt D, Berthier-Vergnes O:
Ribosomal 18S RNA prevails over glyceraldehyde-3-phosphate dehydrogenase and beta-actin genes as internal standard for quantitative comparison of mRNA levels in invasive and noninvasive human melanoma cell subpopulations.Anal Biochem2001,295:17-21. 12. Caradec J, Sirab N, Keumeugni C:’Desperate house genes’: the dramatic
example of hypoxia.Br J Cancer2010,102:1037-1043.
13. Schmittgen TD, Zakrajsek BA:Effect of experimental treatment on housekeeping gene expression: validation by real-time, quantitative RT-PCR.J Biochem Biophys Methods2000,46:69-81.
14. Wang F, Wang J, Liu D, Su Y:Normalizing genes for real-time polymerase chain reaction in epithelial and nonepithelial cells of mouse small intestine.Anal Biochem2010,399:211-217.
15. Kastl L, Brown I, Schofield AC:Effects of decitabine on the expression of selected endogenous control genes in human breast cancer cells.Mol Cell Probes2010,24:87-92.
16. Bustin SA, Beaulieu JF, Huggett J:MIQE precis: Practical implementation of minimum standard guidelines for fluorescence-based quantitative real-time PCR experiments.BMC Mol Biol2010,11:74.
17. Andersen CL, Jensen JL, Orntoft TF:Normalization of real-time quantitative reverse transcription-PCR data: a model-based variance estimation approach to identify genes suited for normalization, applied to bladder and colon cancer data sets.Cancer Res2004,64:5245-5250. 18. Pfaffl MW, Tichopad A, Prgomet C, Neuvians TP:Determination of stable
housekeeping genes, differentially regulated target genes and sample integrity: BestKeeper–Excel-based tool using pair-wise correlations.
Biotechnol Lett2004,26:509-515.
19. Vandesompele J, De Preter K, Pattyn F:Accurate normalization of real-time quantitative RT-PCR data by geometric averaging of multiple internal control genes.Genome Biol2002,3, RESEARCH0034.
20. Tricarico C, Pinzani P, Bianchi S:Quantitative real-time reverse
transcription polymerase chain reaction: normalization to rRNA or single housekeeping genes is inappropriate for human tissue biopsies.Anal Biochem2002,309:293-300.
21. Friedlich MS, Stern HS:Primary prevention: what can you tell your patient?Surg Oncol Clin N Am2000,9:655-60, discussion 661-3. 22. Fearon ER, Vogelstein B:A genetic model for colorectal tumorigenesis.
Cell1990,61:759-767.
23. Rosen M, Chan L, Beart RW Jr, Vukasin P, Anthone G:Follow-up of colorectal cancer: a meta-analysis.Dis Colon Rectum1998,41:1116-1126. 24. de Kok JB, Roelofs RW, Giesendorf BA:Normalization of gene expression measurements in tumor tissues: comparison of 13 endogenous control genes.Lab Invest2005,85:154-159.
26. Rubie C, Kempf K, Hans J:Housekeeping gene variability in normal and cancerous colorectal, pancreatic, esophageal, gastric and hepatic tissues.
Mol Cell Probes2005,19:101-109.
27. Haller F, Kulle B, Schwager S:Equivalence test in quantitative reverse transcription polymerase chain reaction: confirmation of reference genes suitable for normalization.Anal Biochem2004,335:1-9.
28. Blanquicett C, Johnson MR, Heslin M, Diasio RB:Housekeeping gene variability in normal and carcinomatous colorectal and liver tissues: applications in pharmacogenomic gene expression studies.Anal Biochem
2002,303:209-214.
29. Dydensborg AB, Herring E, Auclair J, Tremblay E, Beaulieu JF:Normalizing genes for quantitative RT-PCR in differentiating human intestinal epithelial cells and adenocarcinomas of the colon.Am J Physiol Gastrointest Liver Physiol2006,290:G1067-74.
30. Kheirelseid EA, Chang KH, Newell J, Kerin MJ, Miller N:Identification of endogenous control genes for normalisation of real-time quantitative PCR data in colorectal cancer.BMC Mol Biol2010,11:12.
31. Lu B, Xu J, Chen J, Yu J, Xu E, Lai M:TaqMan low density array is roughly right for gene expression quantification in colorectal cancer.Clin Chim Acta2008,389:146-151.
32. Silberberg G, Baruch K, Navon R:Detection of stable reference genes for real-time PCR analysis in schizophrenia and bipolar disorder.Anal Biochem2009,391:91-97.
33. Wei JS, Khan J:Purification of Total RNA from Mammalian Cells and Tissues.2002, 110-119.
34. Kondo I, Iida S, Takagi Y, Sugihara K:MDM2 mRNA expression in the p53 pathway may predict the potential of invasion and liver metastasis in colorectal cancer.Dis Colon Rectum2008,51:1395-1402.
35. You S, Zhou J, Chen S:PTCH1, a receptor of Hedgehog signaling pathway, is correlated with metastatic potential of colorectal cancer.Ups J Med Sci2010.
36. Ramaswamy S, Ross KN, Lander ES, Golub TR:A molecular signature of metastasis in primary solid tumors.Nat Genet2003,33:49-54. 37. Coghlin C, Murray GI:Current and emerging concepts in tumour
metastasis.J Pathol2010,222:1-15.
38. Jiang Z, Hu J, Li X, Jiang Y, Zhou W, Lu D:Expression analyses of 27 DNA repair genes in astrocytoma by TaqMan low-density array.Neurosci Lett
2006,409:112-117.
39. Steg A, Wang W, Blanquicett C:Multiple gene expression analyses in paraffin-embedded tissues by TaqMan low-density array: Application to hedgehog and Wnt pathway analysis in ovarian endometrioid adenocarcinoma.J Mol Diagn2006,8:76-83.
40. Balogh GA, Russo IH, Spittle C, Heulings R, Russo J:Immune-surveillance and programmed cell death-related genes are significantly
overexpressed in the normal breast epithelium of postmenopausal parous women.Int J Oncol2007,31:303-312.
doi:10.1186/1756-9966-29-144
Cite this article as:Sørbyet al.:Evaluation of suitable reference genes for normalization of real-time reverse transcription PCR analysis in colon cancer.Journal of Experimental & Clinical Cancer Research2010
29:144.
Submit your next manuscript to BioMed Central and take full advantage of:
• Convenient online submission
• Thorough peer review
• No space constraints or color figure charges
• Immediate publication on acceptance
• Inclusion in PubMed, CAS, Scopus and Google Scholar
• Research which is freely available for redistribution