R E S E A R C H A R T I C L E
Open Access
Coding algorithms for defining Charlson
and Elixhauser co-morbidities in
Read-coded databases
David Metcalfe
1*, James Masters
1, Antonella Delmestri
2, Andrew Judge
2,3,4,5, Daniel Perry
1, Cheryl Zogg
1,6,
Belinda Gabbe
7and Matthew Costa
1Abstract
Background:Comorbidity measures, such as the Charlson Comorbidity Index (CCI) and Elixhauser Method (EM), are
frequently used for risk-adjustment by healthcare researchers. This study sought to create CCI and EM lists of Read codes, which are standard terminology used in some large primary care databases. It also aimed to describe and compare the predictive properties of the CCI and EM amongst patients with hip fracture (and matched controls) in a large primary care administrative dataset.
Methods:Two researchers independently screened 111,929 individual Read codes to populate the 17 CCI and
31 EM comorbidity categories. Patients with hip fractures were identified (together with age- and sex-matched controls) from UK primary care practices participating in the Clinical Practice Research Datalink (CPRD). The predictive properties of both comorbidity measures were explored in hip fracture and control populations using logistic regression models fitted with 30- and 365-day mortality as the dependent variables together with tests of equality for Receiver Operating Characteristic (ROC) curves.
Results:There were 5832 CCI and 7156 EM comorbidity codes. The EM improved the ability of a logistic regression model (using age and sex as covariables) to predict 30-day mortality (AUROC 0.744 versus 0.686). The EM alone also outperformed the CCI (0.696 versus 0.601). Capturing comorbidities over a prolonged period only modestly
improved the predictive value of either index: EM 1-year look-back 0.645 versus 5-year 0.676 versus complete record 0.695 and CCI 0.574 versus 0.591 versus 0.605.
Conclusions:The comorbidity code lists may be used by future researchers to calculate CCI and EM using records from Read coded databases. The EM is preferable to the CCI but only marginal gains should be expected from incorporating comorbidities over a period longer than 1 year.
Keywords:Comorbidity, Read codes, Charlson, Elixhauser
Background
The comparison of patient outcomes between healthcare providers requires effective risk adjustment for patient characteristics. In particular, comorbidities are important predictors of outcome1 2. Comorbidity summary mea-sures have been developed to help classify patients according to their overall disease burden [1–4].
The most commonly used summary measure is the Charlson Comorbidity Index (CCI) [4]. Charlson et al. identified 17 diseases that optimally predict one-year mor-tality when assigned a weight between 1 (e.g. peripheral vascular disease) and 6 (e.g. metastatic cancer) [1]. Al-though the CCI is commonly used [4] and has been widely validated [5], it was developed in the 1980s and has been criticized as outdated [6]. A number of meta-analyses have found that an alternative summary measure proposed by Elixhauser et al. [2] has superior predictive properties3 4. In particular, the Elixhauser Method (EM) predicts mor-tality more effectively than CCI amongst patients with
© The Author(s). 2019Open AccessThis article is distributed under the terms of the Creative Commons Attribution 4.0 International License (http://creativecommons.org/licenses/by/4.0/), which permits unrestricted use, distribution, and reproduction in any medium, provided you give appropriate credit to the original author(s) and the source, provide a link to the Creative Commons license, and indicate if changes were made. The Creative Commons Public Domain Dedication waiver (http://creativecommons.org/publicdomain/zero/1.0/) applies to the data made available in this article, unless otherwise stated. * Correspondence:[email protected]
1
Oxford Trauma, Kadoorie Centre for Critical Care Research and Education, Nuffield Department of Orthopaedics, Rheumatology and Musculoskeletal Sciences (NDORMS), John Radcliffe Hospital, Headley Way, Oxford OX3 9BU, UK
fractures of the cervical spine [7] and proximal humerus [8]. However, although older adults with hip fractures have a high comorbid disease burden, it is unclear which sum-mary measure optimally predicts mortality in this popula-tion. The EM is similar to the CCI (nine categories overlap the two measures: diabetes [uncomplicated and complicated], congestive heart failure, HIV, metastatic cancer, renal disease, chronic pulmonary disease, rheum-atic disease, and peripheral vascular disease) but includes almost twice as many diagnostic categories [9].
A number of algorithms have been developed to deter-mine CCI and EM from administrative databases based on ICD-9 [10–12] and ICD-10 [9] diagnostic codes. Al-though Khanet al [13] have developed an algorithm for calculating CCI in Read-coded databases; there is no equivalent translation for EM. This is important because Read codes are used by General Practitioners throughout the United Kingdom National Health Service (NHS) [14] and are the basis on which a number of national primary care datasets have developed. These include the Clinical Practice Research Datalink (CPRD) GOLD [15] and The Health Improvement Network (THIN) [16] databases.
The aims of this study were to: (1) develop coding algorithms for calculating CCI and EM in Read-coded databases, (2) describe the comorbidity characteristics of a hip fracture cohort with matched controls, and (3)
compare the predictive properties of the CCI (both ori-ginal and modified versions) and the EM.
Methods
Defining co-morbidity algorithms
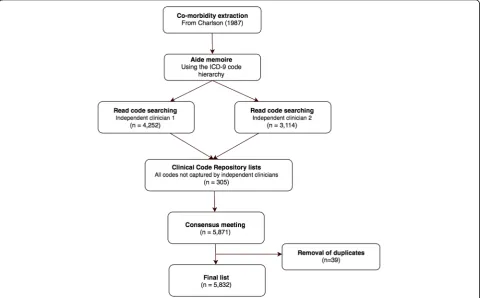
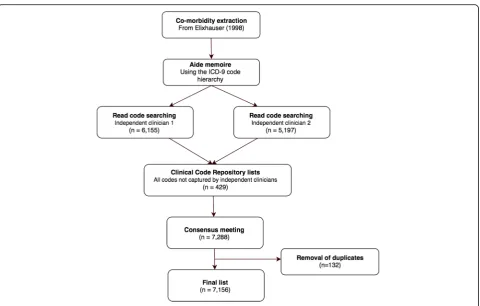
The multi-step process for selecting comorbidity diag-nostic codes is shown by Figs.1 and2. First, the 31 co-morbidities defined by Elixhauser et al. [2] and 17 by Charlson et al. [1] were extracted from their original publications. The Charlson paper was supplemented with work by Deyo et al. [11] who previously translated the Charlson co-morbidities into ICD-9-CM codes. Each comorbidity category was presented together with its ICD-9-CM codes and a text interpretation of each code (exploded to show the full hierarchy of sub-codes) from the 6th edition of the International Classification of Dis-eases, 9th Revision, Clinical Modification (ICD-9-CM) [17]. This step was necessary because many Read terms are unstructured but the ICD-9-CM hierarchy acted as an aide memoirefor diagnoses that might otherwise be missed. For example, clinicians trying to populate the Charlson category“Any malignancy, including leukaemia and lymphoma”might search for“lymphoma” but could inadvertently omit “mycosis fungoides” (represented by 7 separate Read codes) or “Letterer-Siwe disease” (5 Read codes). However, the researchers would encounter
Fig. 1Flow chart showing the exclusion of Charlson co-morbidity Read codes
all three codes while working through the “Malignant neoplasm of lymphatic and hematopoietic tissue” chap-ter of ICD-9-CM. Similarly, even a specialist might search for“myeloid sarcoma” but not think to search for additional Read codes under “chloroma”. They would however find“chloroma”listed under“myeloid sarcoma” in the ICD-9-CM hierarchy.
Two clinicians independently used the exploded ICD-9-CM text codes to search all 111,929 Read terms within the CPRD Medical Dictionary [18]. The general search princi-ples and assumptions agreed by the two code screeners are available in Additional file3The result of this process was that each screener developed a list of Read terms that cor-responded to the ICD-9-CM codes recommended by Elix-hauser [2] and Charlson/Deyo [1,11].
In addition, the online ClinicalCodes Repository [19] was manually searched for all pre-existing Read code lists that pertained to each comorbidity category. Lists from 12 studies [20–30] were included from the Clini-calCodes Repository in addition to the CCI list previ-ously developed by Khanet al[13].The outcome of this process was that between two and six independent Read code lists were generated for each comorbidity category. The two clinicians then resolved discrepancies through discussion and with advice from sub-specialists where appropriate. A single list was generated for each
comorbidity measure and duplicate entries deleted. A final logic check was performed by a single clinician.
Co-morbidity characteristics of a hip fracture cohort
The CPRD is an ongoing primary care database of med-ical records provided by General Practitioners [15]. It is owned by the Medicines and Healthcare products Regu-latory Agency (MHRA) and collects data about more than 11.3 million patients from 674 individual GP prac-tices. Approximately 6.9% of UK residents are currently represented by data in the CPRD and these are broadly representative of the wider UK population. General Practitioners in the UK maintain each patient’s entire healthcare record and should receive correspondence (including Emergency Department correspondence, out-patient clinic letters, and hospital discharge summaries) from secondary care providers. Important events (e.g. hip fracture) and diagnoses (e.g. interstitial lung disease) should therefore be coded into the GP record even if the patient was treated in hospital.
A cohort of patients (cases) were identified from CPRD GOLD practices based on a first ever record of
“hip fracture” occurring between 1st January 1999 and
9th October 2013. The diagnostic and procedural codes used to define this hip fracture cohort are presented in Additional file 4 In addition, the patients required at
least 3 years up-to-standard (UTS) registration in CPRD GOLD prior to their hip fracture [15]. Age- and sex-matched controls were identified by the CPRD in a 2:1 ratio from patients registered with practices from 1st January 1996 onwards and with at least three preceding years UTS registration.
The specific variables extracted from the CPRD were age, sex, date of hip fracture diagnosis, and individual comorbidities. For the principal analysis, diagnostic codes were extracted from each patient’s entire lifetime primary care record. We also planned sensitivity analyses that confined comorbidities to those recorded within 1-and 5-years of the index hip fracture.
Validating the predictive properties of the Elixhauser method
The EM was tested against the CCI, using both the 17-item original version by Charlsonet al [1] and the shorter 12-item modification proposed by Quanet al[6]. We planned to report 30- and 365-day mortality. Kaplan-Meier plots were created for death within 365 days by categories of CCI and EM. Logistic regression models were fitted with 30-and 365-day mortality as the dependent variables. The cov-ariables were age (as a continuous variable) and sex, which is consistent with the approach taken by other studies de-signed to evaluate comorbidity summary measures. The subsequent analyses fitted multivariable logistic regression models with age and sex as well as either CCI or Elixhauser comorbidities as covariables. Stepwise variable selection techniques were not used. The comorbidity summary mea-sures were then layered on top of this base model. Tests of equality for Receiver Operating Characteristic (ROC) areas were undertaken using the roccomp [31] module in Stata v.15.0 (College Station, TX, USA). Although summary ta-bles were produced to show the number of EM comorbidi-ties in each group, these were included as separate independent variables within regression models in the man-ner proposed by Elixhauser et al. [2]. The principal analysis used CCI calculated using the weights originally proposed by Charlson et al. [1]. We reported the predictive properties of the EM and CCI in both diseased (i.e. hip fracture) and non-diseased (age- and sex-matched control) populations. Importantly, we undertook analyses of cases and controls separately and did not plan to utilize a case-control design. In addition, we undertook sensitivity analyses limited to co-morbidities documented 1- and 5-years before the index hip fracture as some researchers may find themselves work-ing with cuts of data that are limited in time. The principal analysis used all comorbidies documented at any time in each patient’s complete medical record.
Information governance
Ethical approval was not sought in line with the latest
Governance Arrangements for Research Ethics
Committees (GafREC) guidance [32]. Approval to use the data was provided by the Independent Scientific Ad-visory Committee (ISAC) at the MHRA (ISAC Protocol No. 13_069RA). Personal data was processed under Arti-cles 6 (1)(f ) and 9 (1)(f ) of the General Data Protection Regulation (EU 2016/6709).
Results
Defining an Elixhauser coding algorithm
Figures1and2show the number of diagnoses identified and eliminated for CCI and EM respectively. The final lists included 5832 individual codes representing CCI comorbidities (Additional file 1) and 7156 EM comor-bidities (Additional file2).
Comorbidity characteristics of a patient cohort
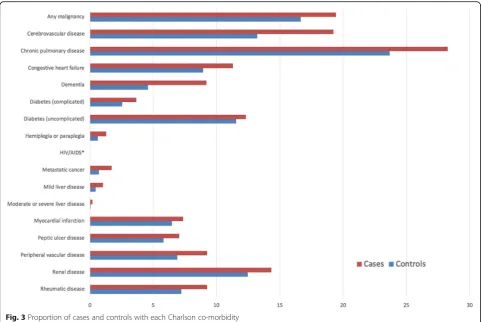
The linked dataset included 13,974 patients with hip fractures and 26,860 age- and sex-matched controls. The median age across the cohort was 82 years (interquartile range [IQR]: 75–87 years and 75.1% were female. The distribution of comorbidities within the cohort accord-ing to Charlson and Elixhauser are shown in Figs.3and 4. Table 1 shows that 27.6% of hip fracture patients did not have any CCI co-morbidities recorded; only 9.2% did not have EM conditions recorded. The median CCI was 1 (interquartile range [IQR] 0–3) and EM 2 (IQR 1–4).
30-day mortality The EM improved the ability of a lo-gistic regression model (using age and sex as covariables) to predict 30-day mortality (AUROC 0.744 [95% CI 0.727 to 0.760] versus 0.686 [0.668 to 0.705]) among cases. The EM alone performed better than CCI in pre-dicting 30-day mortality (AUROC 0.696 [95% CI 0.677 to 0.714] versus 0.601 [0.582 to 0.619]). Similar findings were observed within the control population: EM + base model AUROC 0.771 (95% CI 0.743 to 0.800) versus EM alone 0.709 (0.678 to 0.740) and EM 0.726 (0.692 to 0.760) versus CCI 0.649 (0.614 to 0.683).
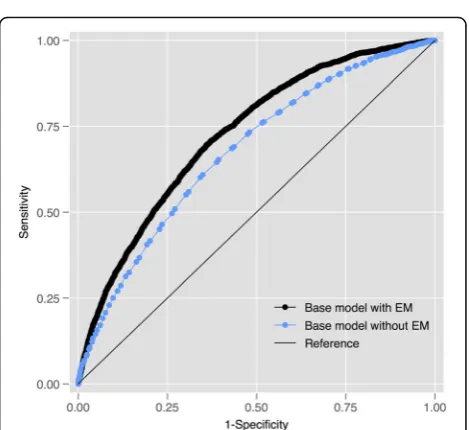
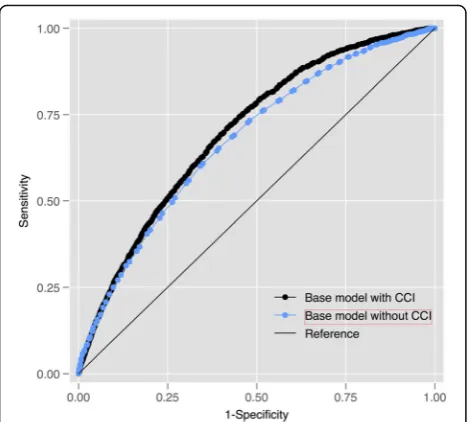
365-day mortality Fig. 5 shows that the EM modestly improved the ability of the base regression model to pre-dict 365-day mortality (AUROC 0.726 [95% CI 0.716 to 0.735] versus 0.676 [0.665 to 0.687]) amongst cases. Fig.6 shows that the CCI only performed marginally better than the base model: AUROC 0.676 [95% CI 0.665 to 0.687]. The EM alone performed better than the CCI (0.672 [95% CI 0.661 to 0.683]) versus 0.611 [95% CI 0.600 to 0.622]). Similar findings were observed within the control population: EM + base model AUROC 0.750 (95% CI 0.740 to 0.759) versus EM alone 0.700 (0.690 to 0.710) and EM 0.696 (0.685 to 0.707) versus CCI 0.635 (0.622 to 0.645).
Use of diagnoses recorded over different durations
The proportion of patients with a CCI of zero decreased, consistent with expectations, as the length of time over
which diagnostic codes were assessed increased, e.g. 64.1% cases had CCI = 0 at 1-year versus 42.9% at 5-year and 27.6% using the complete record. A similar trend was observed for the number of EM co-morbidities, al-though the difference between 1 and 5 years was less marked (cases 1-year 48.4% versus 5-year 48.3% and complete record 9.2%). The increased capture of diag-nostic codes by using the complete primary care record only modestly improved the predictive value of either the CCI (1-year AUROC 0.574 [95% CI 0.555 to 0.572] versus 5-year 0.591 [0.572 to 0.610] versus complete rec-ord 0.605 [0.586 to 0.623]) or the EM (1-year 0.645 [0.625 to 0.664] versus 5-year 0.676 [0.657 to 0.696] ver-sus complete record 0.695 [0.677 to 0.714) for 30-day mortality amongst cases. Similar results were observed amongst controls (Additional file5).
Use of updated Charlson comorbidity index
The updated CCI described by Quanet al[6] performed similarly in this population to the original index, both for 30- (AUROC 0.716 [95% CI 0.699 to 0.733] versus 0.704 [0.686 to 0.721]), and 365-day mortality (AUROC 0.713 [95% CI 0.703 to 7.23] versus 0.700 [0.690 to 0.710]). The modified weights proposed by Quan et al
[6] have been included as an additional column in Add-itional file1.
Use of Charlson co-morbidities as individual co-variables
The Charlson co-morbidities performed marginally bet-ter for predicting 30-day mortality when included as in-dependent co-variables than when used as a single index, both amongst cases (individual co-variables 0.632 [0.612–0.652] versus CCI 0.612 [0.594–0.631]) and con-trols (0.679 [0.642–0.715] versus 0.660 [0.625–0.693]). This also held for predicting 365-day mortality amongst cases (CM 0.638 [0.627–0.649] versus CCI 0.616 [0.605– 0.628]) and controls (individual co-variables 0.662 [0.650–0.674] versus 0.640 [0.628–0.651]).
However, the EM continued to outperform the Charl-son co-morbidities in predicting 30-day mortality, even when diagnostic categories were used as individual co-variables (cases: EM 0.695 [0.677–0.714] versus Charlson co-morbidities 0.632 [0.613–0.652] and controls: 0.695 [0.677–0.714) versus 0.632 [0.613–0.652)). The EM also outperformed individual Charlson co-morbidities in predicting 365-day mortality (cases: EM 0.672 [0.661– 0.683] versus CM 0.638 [0.627–0.649] and controls: 0.696 [0.685–0.707] versus 0.662 [0.650–0.674]).
Discussion
The principal aim of this study was to transparently and reproducibly create comorbidity lists for future re-searchers working with Read-coded databases. The final lists are available as Additional files1 and 2 that can be readily imported into commonly used statistical software packages (Additional file 1 and Additional file 2). These lists are particularly important for researchers analyzing UK primary care datasets such as Clinical Practice Research Datalink (CPRD) GOLD [15] and The Health Improvement Network (THIN) [16]. Although such re-searchers may need to include a composite comorbidity
Fig. 4Proportion of cases and controls with each Elixhauser co-morbidity
Table 1Diagnosis count using Charlson and Elixhauser co-morbidity lists
Count Charlson (%) Elixhauser (%)
Cases Controls Cases Controls
0 27.6 36.6 9.2 15.3
1 23.8 23.8 16.9 21.2
2 18.3 16.9 19.1 20.8
3 12.4 10.7 18.4 16.5
4 8.0 5.9 14.1 11.5
5 4.3 3.1 9.7 7.2
> 6 5.6 3.0 12.5 7.5
Fig. 5Receiver-Operating Characteristic (ROC) curves for a regression model (co-variables: age and sex) predicting 365-day mortality amongst cases with and without the EM
score for the purposes of risk adjusting outcomes, it is onerous and time-consuming to create comprehensive code lists for indices such as the EM, which encompasses 31 individual disease categories. This is particularly diffi-cult for Read-coded databases as the Read syntax includes codes along multiple axes, e.g. diseases, procedures, exam-ination findings, and administrative events such as clinic referrals. Read terms also include spelling errors (e.g. “[V]Folow-up exam aft other treatment for malignant neo-plasm”, inconsistent abbreviations (“[X]Vit B12/folic/oth ant-megalobl-anaem caus adv ef ther use”, obscure dis-eases (e.g.“Sequoiosis (red-cedar asthma)”), and synonyms (“Plummer - Vinson syndrome”versus“Plummer-Vinson syndrome”) that can lead to codes being missed. Publicly-accessible lists of diagnostic codes for both the CCI and EM will save analyst time and improve the reproducibility of primary care research.
We have been unable to identify any previous attempts to translate the EM (initially published using ICD-9-CM codes) for use in Read-coded databases. Although the CCI is the most commonly used comorbidity index in studies with administrative data [4], it has less predictive value than the EM in many populations. An earlier study [13] reported such a list for CCI but identified 3156 codes, which is only 54% of those identified by our study. Our study should not be interpreted as criticism of these authors but as an extension of their work as we used their findings – together with those published by other single disease studies – to help create our own CCI list. However, the differences between the two stud-ies highlights the difficultstud-ies that research groups face
when trying to create comprehensive lists of Read codes and employ them in adequately risk-adjusted research.
This study also showed that the EM performed better than the CCI at predicting hip fracture mortality. How-ever, even the EM only added a modest degree of add-itional predictive value over and above a simple regression model with age and sex covariables. Although diagnostic codes from the entire lifetime record of pa-tients added predictive value beyond those recorded within the preceding 1- and 5-years, this increase was modest. It is likely that comorbidities recorded within the previous 12-months will be sufficient for risk adjust-ment in most studies. These findings should reassure researchers that are necessarily working with limited ex-tracts of primary care data.
Limitations
The main limitation of our study is that it is difficult to be certain that all diagnoses were included within each cat-egory. However, we did use a number of strategies to maximize our capture of relevant codes, including screen-ing by independent clinicians and checks usscreen-ing lists cre-ated by other researchers for specific disease populations. It is also possible that discrepancies could arise in terms of disease classification. For example, lymphoepithelial carcinoma was categorized as“solid tumour”for the pur-poses of the EM rather than“lymphoma”. These decisions were aided by recourse to the ICD-9-CM codes used in previous publications as well as textbooks and subject ex-perts. It is, however, possible that some classifications will be contentious or change over time. Although this resource is likely to be sufficient for the purposes of co-morbidity risk adjustment, researchers working on specific disease processes should satisfy themselves that these lists are sufficient for their purposes.
Conclusion
We have adopted a robust and transparent approach to identifying Read codes that can be used by future re-searchers to calculate CCI and EM. This study also showed that, although the EM outperforms the CCI and models are improved by using comorbidity codes cap-tured over a long period of time, the differences are modest. Researchers with access to limited datasets con-cerning comorbidities may create logistic regression models with similar discrimination to those with access to complete healthcare records.
Additional files
Additional file 1:Read codes for Charlson co-morbidities. (CSV 417 kb)
Additional file 2:Read codes for Elixhauser co-morbidities. (CSV 513 kb)
Additional file 3: Screening Principles. (DOCX 120 kb)
Additional file 4:Read codes used to identify the hip fracture cohort. (DOCX 126 kb)
Additional file 5:Effect of using diagnostic records over different durations. (DOCX 20 kb)
Abbreviations
AUROC:Area under the receiver operating characteristic; CCI: Charlson Comorbidity Index; CI: Confidence interval; CPRD: Clinical Practice Research Datalink; EM: Elixhauser Method; GafREC: Governance arrangements for Research Ethics Committees; GDPR: General Data Protection Regulation; GP: General practice; ICD-9-CM: International classification of disease, 9th edition, clinical modification; IQR: Interquartile range; ISAC: Independent Scientific Advisory Committee; MHRA: Medicines and Healthcare products Regulatory Agency; NHS: National Health Service; ROC: Receiver Operating Characteristic; THIN: The Health Improvement Network; UK: United Kingdom; UTS: Up to standard
Acknowledgements
We are grateful to the authors (cited in the text) whose comorbidity code lists contributed to this resource and to GP practices participating in the CPRD for providing data.
Authors’contributions
DM designed the study, created the code lists, undertook the data analysis, and drafted the manuscript. JM created the code lists contributed to the study design, interpretation of the data, and made critical revisions to the manuscript. AD prepared a dataset from individual CPRD data files, helped check the code lists, contributed to interpretation of the data, and made critical revisions to the manuscript. AJ, DP, CZ, BG, and MC contributed to the study design, interpretation of the data, and critically revised the manuscript. All authors have read and approved the final manuscript.
Authors’information
DM and JM are a Clinical Research Fellows in Musculoskeletal Trauma at the University of Oxford, AD is a computer scientist and Senior Database Manager at the University of Oxford, AJ is Professor of Translational Statistics at the University of Bristol, DP is Associate Professor of Orthopaedics & Trauma Surgery at the University of Oxford, CZ is a MD-PhD candidate and Health Law Fellow at Yale University (Connecticut, USA), BG is Head of the Pre-Hospital, Emergency and Trauma Research Unit at Monash University (Melbourne, Australia), and MC is Professor of Orthopaedic Trauma Surgery at the University of Oxford.
Funding
David Metcalfe is funded by an Oxford-UCB Fellowship in Biomedical Re-search. No funding body had any influence over the design or conduct of the research, or the decision to publish.
Availability of data and materials
The data that support the findings of this study are available from the Clinical Practice Research Datalink (CPRD) but restrictions apply to the availability of these data, which were used under license for the current study, and so are not publicly available. Data may however be available on application directly to the CPRD.
Ethics approval and consent to participate
Ethical approval was not sought in line with the latest Governance Arrangements for Research Ethics Committees (GafREC) guidance. Approval to use the data was provided by the Independent Scientific Advisory Committee (ISAC) at the MHRA (ISAC Protocol No. 13_069RA). Personal data was processed under Articles 6 (1)(f) and 9 (1)(f) of the General Data Protection Regulation (EU 2016/6709).
Consent for publication Not applicable.
Competing interests None.
Author details
1Oxford Trauma, Kadoorie Centre for Critical Care Research and Education,
Nuffield Department of Orthopaedics, Rheumatology and Musculoskeletal Sciences (NDORMS), John Radcliffe Hospital, Headley Way, Oxford OX3 9BU, UK.2Centre for Statistics in Medicine, NDORMS, Nuffield Orthopaedic Centre,
University of Oxford, Windmill Road, Oxford OX3 7LD, UK.3Musculoskeletal
Research Unit, Translational Health Sciences, Bristol Medical School, University of Bristol, Learning and Research Building, Level 1, Southmead Hospital, Bristol BS10 5NB, UK.4National Institute for Health Research Bristol
Biomedical Research Centre (NIHR Bristol BRC), University Hospitals Bristol NHS Foundation Trust, University of Bristol, Southmead Hospital, Bristol BS10 5NB, UK.5MRC Lifecourse Epidemiology Unit, University of Southampton, Southampton General Hospital, Southampton SO16 6YD, UK.6Yale School of
Medicine, 333 Cedar Street, New Haven, CT 06510, USA.7School of Public
Health and Preventive Medicine, Monash University, Level 3, 553 St Kilda Road, Melbourne, VIC 3004, Australia.
Received: 22 August 2018 Accepted: 20 May 2019
References
1. Charlson ME, Pompei P, Ales KL, et al. A new method of classifying prognostic comorbidity in longitudinal studies: development and validation. J Chronic Dis. 1987;40(5):373–83.
2. Elixhauser A, Steiner C, Harris DR, et al. Comorbidity measures for use with administrative data. Med Care. 1998;36(1):8–27.
3. Molto A, Dougados M. Comorbidity indices. Clin Exp Rheumatol. 2014;32(5 Suppl 85):S-131–4.
4. Sharabiani MT, Aylin P, Bottle A. Systematic review of comorbidity indices for administrative data. Med Care. 2012;50(12):1109–18.https://doi.org/10. 1097/MLR.0b013e31825f64d0.
5. Karres J, Heesakkers NA, Ultee JM, et al. Predicting 30-day mortality following hip fracture surgery: evaluation of six risk prediction models. Injury. 2015;46(2):371–7.https://doi.org/10.1016/j.injury.2014.11.004. 6. Quan H, Li B, Couris CM, et al. Updating and validating the Charlson
comorbidity index and score for risk adjustment in hospital discharge abstracts using data from 6 countries. Am J Epidemiol. 2011;173(6):676–82. https://doi.org/10.1093/aje/kwq433.
7. Menendez ME, Ring D, Harris MB, et al. Predicting in-hospital mortality in elderly patients with cervical spine fractures: a comparison of the Charlson and Elixhauser comorbidity measures. Spine (Phila Pa 1976). 2015;40(11): 809–15.https://doi.org/10.1097/BRS.0000000000000892.
8. Menendez ME, Ring D. A comparison of the Charlson and Elixhauser comorbidity measures to predict inpatient mortality after proximal Humerus fracture. J Orthop Trauma. 2015;29(11):488–93.https://doi.org/10.1097/BOT. 0000000000000380.
9. Quan H, Sundararajan V, Halfon P, et al. Coding algorithms for defining comorbidities in ICD-9-CM and ICD-10 administrative data. Med Care. 2005; 43(11):1130–9.
10. D'Hoore W, Bouckaert A, Tilquin C. Practical considerations on the use of the Charlson comorbidity index with administrative data bases. J Clin Epidemiol. 1996;49(12):1429–33.
11. Deyo RA, Cherkin DC, Ciol MA. Adapting a clinical comorbidity index for use with ICD-9-CM administrative databases. J Clin Epidemiol. 1992; 45(6):613–9.
12. Romano PS, Roos LL, Jollis JG. Adapting a clinical comorbidity index for use with ICD-9-CM administrative data: differing perspectives. J Clin Epidemiol. 1993;46(10):1075–9 discussion 81-90.
13. Khan NF, Perera R, Harper S, et al. Adaptation and validation of the Charlson index for read/OXMIS coded databases. BMC Fam Pract. 2010;11:1.https:// doi.org/10.1186/1471-2296-11-1.
14. Benson T. The history of the read codes: the inaugural James read memorial lecture 2011. Inform Prim Care. 2011;19(3):173–82.
15. Herrett E, Gallagher AM, Bhaskaran K, et al. Data resource profile: clinical practice research datalink (CPRD). Int J Epidemiol. 2015;44(3):827–36.https:// doi.org/10.1093/ije/dyv098.
16. Denburg MR, Haynes K, Shults J, et al. Validation of the health improvement network (THIN) database for epidemiologic studies of chronic kidney disease. Pharmacoepidemiol Drug Saf. 2011;20(11):1138–49.https://doi.org/10.1002/ pds.2203.
17. U.S. National Center for Health Statistics. International Statistical Classification of Diseases, Clinical Modification (ICD-9-CM). Hyattsville: National Center for Health Statistics; 2008.
18. Clinical Practice Research Datalink (CPRD). Medical Dictionary. London: Department of Health and Social Care; 2018.
19. ClinicalCodes.org. Manchester: University of Manchester; 2017.https:// clinicalcodes.rss.mhs.man.ac.uk/. Accessed 1 Oct 2018.
20. Carr MJ, Ashcroft DM, Kontopantelis E, et al. Premature death among primary care patients with a history of self-harm. Ann Fam Med. 2017;15(3): 246–54.https://doi.org/10.1370/afm.2054.
21. Doyle M, While D, Mok PL, et al. Suicide risk in primary care patients diagnosed with a personality disorder: a nested case control study. BMC Fam Pract. 2016;17:106.https://doi.org/10.1186/s12875-016-0479-y. 22. Fairhurst C, Watt I, Martin F, et al. Exposure to sodium channel-inhibiting
drugs and cancer survival: protocol for a cohort study using the QResearch primary care database. BMJ Open. 2014;4(11):e006604.https://doi.org/10. 1136/bmjopen-2014-006604.
23. Kontopantelis E, Springate D, Reeves D, et al. Withdrawing performance indicators: retrospective analysis of general practice performance under UK quality and outcomes framework. BMJ. 2014;348:g330.https://doi.org/10. 1136/bmj.g330.
24. Muller S, Hider SL, Raza K, et al. An algorithm to identify rheumatoid arthritis in primary care: a clinical practice research datalink study. BMJ Open. 2015; 5(12):e009309.https://doi.org/10.1136/bmjopen-2015-009309.
25. Nicholson A, Ford E, Davies KA, et al. Optimising use of electronic health records to describe the presentation of rheumatoid arthritis in primary care: a strategy for developing code lists. PLoS One. 2013;8(2):e54878.https://doi. org/10.1371/journal.pone.0054878.
26. Reeves D, Springate DA, Ashcroft DM, et al. Can analyses of electronic patient records be independently and externally validated? The effect of statins on the mortality of patients with ischaemic heart disease: a cohort study with nested case-control analysis. BMJ Open. 2014;4(4):e004952. https://doi.org/10.1136/bmjopen-2014-004952.
27. Reilly S, Olier I, Planner C, et al. Inequalities in physical comorbidity: a longitudinal comparative cohort study of people with severe mental illness in the UK. BMJ Open. 2015;5(12):e009010. https://doi.org/10.1136/bmjopen-2015-009010.
28. Stocks SJ, Kontopantelis E, Akbarov A, et al. Examining variations in prescribing safety in UK general practice: cross sectional study using the clinical practice research datalink. BMJ. 2015;351:h5501.https://doi.org/10. 1136/bmj.h5501.
29. Thompson A, Ashcroft DM, Owens L, et al. Drug therapy for alcohol dependence in primary care in the UK: a clinical practice research datalink study. PLoS One. 2017;12(3):e0173272.https://doi.org/10.1371/journal.pone. 0173272.
30. Zhong VW, Juhaeri J, Cole SR, et al. HbA1C variability and hypoglycemia hospitalization in adults with type 1 and type 2 diabetes: a nested case-control study. J Diabetes Complicat. 2018;32(2):203–9.https://doi.org/10. 1016/j.jdiacomp.2017.10.008.
31. Cleves MA. From the help desk: comparing areas under receiver operating characteristic curves from two or more probit or logit models. Stata J. 2002; 2(3):301–13.
32. NHS Health Research Authority (HRA). Governance arrangements for research ethics committees. London: NHS Health Research Authority; 2018. https://www.hra.nhs.uk/documents/1560/GAfREC_2018_v1.0_FINAL_ 20180615.pdf.
Publisher’s Note