doi: 10.11648/j.ijmi.20170504.12
ISSN: 2330-8303 (Print); ISSN: 2330-832X (Online)
An Open-Source 3D MR Image Visualization Toolkit
Kalim Qureshi
1, *, Javad Haider Kazmi
21Department of Information Science, College of Computing Sciences and Engineering, Kuwait University, Kuwait 2Department of Computer Science COMSATS Institute of Information Technology, Abbottabad, Pakistan
Email address:
[email protected] (K. Qureshi), [email protected] (J. H. Kazmi)
*Corresponding author
To cite this article:
Kalim Qureshi, Javad Haider Kazmi. An Open-Source 3D MR Image Visualization Toolkit. International Journal of Medical Imaging. Vol. 5, No. 4, 2017, pp. 47-52. doi: 10.11648/j.ijmi.20170504.12
Received: February 23, 2016; Accepted: June 20, 2016; Published: November 2, 2017
Abstract:
Medical imaging is an important tool for the treatment and surgical planning of the diseases. These images provide insights to physician and surgeons and help them make their decisions for diagnosis and the treatment of diseases. Processing of these images is an active research area. Visualization is the most important technical determination of the quality and usefulness of these images. Numerous proprietary visualization toolkits exist on dedicated hardware. A need for an open source 3D MR image visualization toolkit for personal computers is realized which should be cheep, extendable, flexible and easy to integrate. Such a toolkit is designed and developed in this paper.Keywords:
Medical Imaging, Visualization, Maximum Intensity Projection, Open Source1. Introduction
Medical images have been in use by physicians, surgeons and life scientists ever since the invention of the microscope and discovery of x-rays, to diagnose and treat disease and to better understand basic physiology and biology. Three dimensional (3D) images provide both qualitative and quantitative information about a target organ. These images could be obtained with multitude of modalities including digital radiography, computed tomography, magnetic resonance (MR) imaging, positron emission tomography,
single photon emission computed tomography and ultrasonography. MR imaging are 3D images of the biological tissues. MR images are generated by collecting NMR signals of the hydrogen nuclei, abundantly available in human body. MR angiogram is a safe method of imaging of the blood flow in the brain. After acquiring these images in the form of digital image they need to be processed on an imaging system. These systems can be categorized into performing one or more of the following functions: data analysis, surgical planning, surgical guidance, and surgical guidance with intra-operative updates [1].
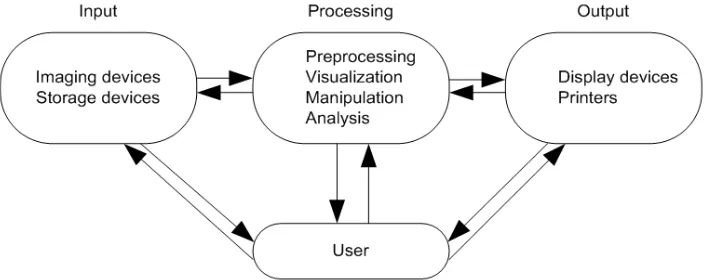
A 3D image computing system is depicted in Figure 1. The system consists of 4 basic steps i) preprocessing, ii) visualization, iii) manipulation and iv) analysis. Visualization is perhaps the most important step, since it shows what the imaging modality has captured. Visualization is the No. 1 required component of any image computing system and medical imaging is not an exception. There are numerous proprietary visualization toolkits exist on dedicated hardware and software [2, 3]. An open source [4] toolkit would be more beneficial in terms of integration, flexibility, extensibility and cost effectiveness. In this paper we are sharing our experiences with the design and the development of such toolkit.
1.1. Nuclear Magnetic Resonance (NMR) Imaging
The NMR [5] principal in simple words says that there are certain nuclei, in the nature that have an inherent spin property. The spinning of a charged nucleus results in a magnetic moment that behaves like a tiny bar magnet. The magnetic moment also spins or processes about an axis in a manner similar to the wobble of a spinning top. Hydrogen is the most frequently used nucleus for NMR imaging because of its abundance in biological tissue and its high NMR sensitivity. Figure 2 shows the whole of process of generating the generating and receiving NMR signals.
Figure 2. The NMR Signal [5].
Magnetic resonance imaging (MRI) is based on the principal of nuclear magnetic resonance imaging (NMR). It is a rapidly emerging technique that provides high quality images. These images provide much more diagnostic information than do conventional imaging modalities. Magnetic resonance angiography (MRA) is a safe method of imaging blood flow in brain compared to X-ray angiogram etc [5].
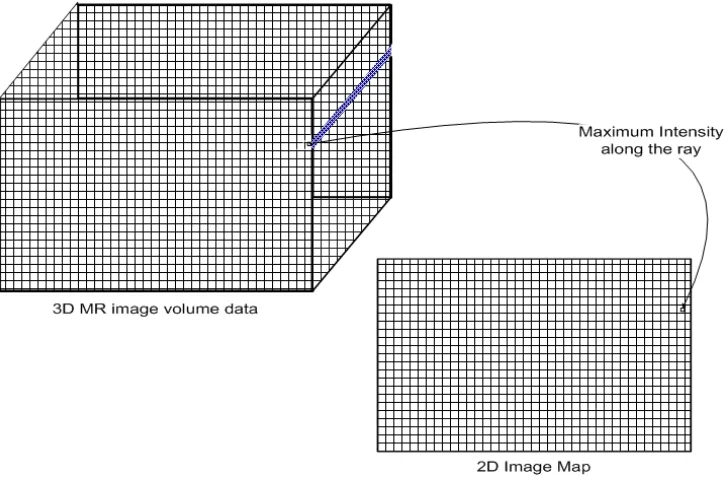
1.2. Maximum Intensity Projection (MIP)
The rendering technique is the computer algorithm used to transform MR image slice data into 3D images. There are a number of different methods but Maximum Intensity
Figure 3. Maximum Intensity Projection (MIP).
The rest of the paper is organized as follows. The next section presents the architecture and explains the working of the open source MR image visualization toolkit. Section 3 will presents the results generated on the toolkit. Section 4 provides the conclusion and the future work.
2. The MR Image Visualization Toolkit Architecture
In this section we will discuss the design and the working of our open source MR image visualization toolkit. The architecture of the toolkit is depicted in Figure 4. The figure shows the three major components of the visualization toolkit. The
Read component is responsible for the I/O operations. It reads in the MR image slices. It then passes this data to the Render
component which renders the MR image and makes it ready for the display by the Draw component. The draw than draws the MR image on the screen.
Figure 4. Pictorial Representation of the MR Image Visualization Toolkit.
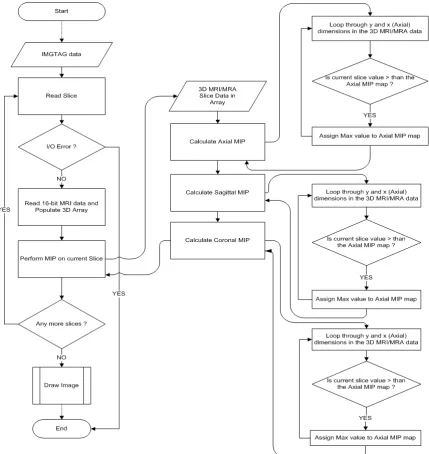
Figure 5 show a more details representation of the Read and Render components. The sub components are joined with the rounded shaped lines.
The Draw component is shows in Figure 6. As we have developed an open source toolkit the platform required to build it would have to be open source as well. Linux and its variations are extensively used and X Window System, commonly referred to just X, is an open source system developed at MIT that allows applications to be displayed in windows and shared among different workstations and terminals. It provides standard APIs and protocols to build graphical user interfaces (GUIs) on Unix-like operating systems. The Draw component of our 3D MR image visualization toolkit, utilized the X for drawing on the display.
3. Results and Discussion
The images selected for this experiment are all belongs to the same patient and have been obtained with different resolutions. In all of these images, the gray scale was quantized into 12 bits, which allowed 4096 different pixel intensities. Table 1 shows the dimension of these data sets. The data was in the raw image format.
Table 1. Data sets used in this experiment.
Type Dimensions
Data Set 1 512 x 64 x 512
Data Set 2 256 x 128 x 128
Data Set 3 256 x 256 x 128
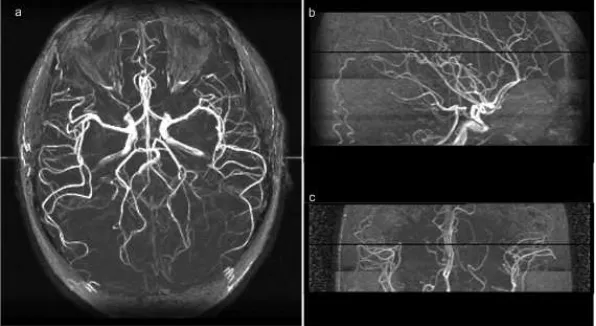
The following three figures (Figure 7, Figure 8 and Figure 9) show the visualization MRA data generated with our 3D
MR image Visualization toolkit. Figure 7 show the three views of unprocessed data from the Data Set 1. Figure 8 shows the visualization of Data Set 2 and Figure 9 shows the Data Set 3’s visualization.
Table 2. Running times of the adaptive structured filter and edge sharpening method.
Type Dimensions Size Running Time
Data Set 1 512 x 64 x 512 32768 kb 73.12 sec
Data Set 2 256 x 128 x 128 8192 kb 45.45 sec
Data Set 3 256 x 256 x 128 16384 kb 60.67 sec
Since the running time is also an important measure of performance, Table 2 shows the time taken for the generation of visualization by each of the data set. The running time quoted here is the average of the 5 runs on each of the data sets.
4. Conclusions and Future Work
In this research work, we have developed an open source 3D MR image visualization toolkit. We have experimented with three different data sets of MR angiography data of varying resolution, and have got impressive visualization in three different planes (sagittal, coronal and axial) in considerably optimal time. The open source toolkit would be more beneficial in terms of integration, flexibility and extensibility. Due to these factors, this tool provides a
valuable aid to any research with MR images and using this tool kits we investigated many research problem in medical imaging and published some papers [7-9].
As a future work, we are planning to incorporate many good futures related to the visualization of images and enhancement in image quality. Hope that that features will help to the medical doctors to analyze the deceases in short time.
Figure 7. Visualization generate from Data Set 1 (512x64x512). The a, b and c shows the sagittal, coronal and axial views.
Figure 8. Visualization generate from Data Set 2 (256x128x128). The a, b and c shows the sagittal, coronal and axial views.
References
[1] David T. Gering, Arya Nabavi, Ron Kikinis, Noby Hata, Lauren J. O’Donnell, BS, W. Eric L. Grimson, Ferenc A. Jolesz, Peter M. Black, MD, 3 and William M. Wells, “An Integrated Visualization System for Surgical Planning and Guidance Using Image Fusion and an Open MR”, Journal of Magnetic Resonance Imaging, 13:967-975, 2001.
[2] Ivo Wolf, Marcus Vetter, Ingmar Wegner, Thomas Bottger, Marc Nolden, Max Schobinger, Mark Hastenteufel, Tobias Kunert, Hans-Peter Meinzer, “The Medical Imaging Interaction Toolkit”, Medical Image Analysis 9, pp. 594-604, 2005.
[3] Franc¸ois Rousseaua, Estanislao Oubela, Julien Pontabrya, Colin Studholmeb, M´eriam Koobc,d, Jean-Louis Dietemannc, d, “BTK: An Open-Source Toolkit for Fetal Brain MR Image Processing”, Computer Methods and Programs in Biomedicine, 109(1), pp. 65-73, 2013.
[4] E. Keeve, T. Jansen, Z. Krol, L. Ritter, B. von Rymon-Lipinski, R. Sader, H. Zeilhofer, and P. Zerfass, Julius, “an extendable software framework for surgical planning and image-guided navigation”, Lecture notes in computer science 2208, pp. 1336–1337, Springer, (Berlin), 2001.
[5] Steven E. Harms, Tommie J. Morgan, William S. Yamanashi, Thomas S. Harle, and Gerald D. Dodd, "Principles of nuclear magnetic resonance imaging", RadioGraphics, Vol. 4, pp. 26-43, 1984.
[6] D. Stark and W. Bradley Jr., Ed. Magnetic Resonance Imaging. St. Louis, MO: Mosby, 1992.
[7] Mubbashar Saddique. Jawad Haider Kazmi, and Kalim Qureshi, “A Hybrid Approach of Using Symmetry Technique for Brain Tumor Segmentation”, Journl of Computational
Mathematical Methods in Medicine, Volume 2014, Article ID 712783, 2014, pp. 1-13,
[8] J. H. Kazmi, K. Qureshi, H. Rasheed, "An implementation of SAN filter and edge sharpening method for MRA images", Malaysian journal of computer science, Vol. 20, 2007, pp. 99-114.
[9] Sonia Rauf, Kalim Qureshi, Jawad Kazmi, Mohammad Sarfraz, “An Empirical Technique to Improve MRA Imaging, Journal of Applied Computing Informatics, doi:10.1016/j.aci.2015.06.002, 2015.
Biography
Kalim Qureshi is an Associate Professor of Information Science Department, Kuwait University, Kuwait. His research interests include network parallel distributed computing, thread programming, concurrent algorithms designing, task scheduling, performance measurement and medical imaging. Dr. Qureshi received his Ph.D and MS degrees from Muroran Institute of Technology, Hokkaido, Japan in (2000, 1997). He published more than 50 journal papers in reputed journals.
![Figure 2. The NMR Signal [5].](https://thumb-us.123doks.com/thumbv2/123dok_us/9887884.1976288/2.595.57.537.250.506/figure-the-nmr-signal.webp)