A Comparative Study of Strength of Square Slabs
with Circular and Square Openings
Mohammed Ahmed*, Chandrashekar. V. C**
*PG Student, Department of Civil Engineering, DSCE, Bangalore, India.
**Assistant Professor, Department of Civil Engineering, DSCE, Bangalore, India.
Abstract
In general a slab with circular opening is analyzed and designed by assuming it to be a slab of square opening of the same size. Also slabs with circular openings are scarce in the research. Therefore an attempt has been made to study and compare the strength of the square slabs with circular and square openings placed at the centre with simply supported and fixed edge conditions at ultimate limit state using yield line method and the results are presented. Square slabs with circular and square openings ranging from 0.025 to 0.9 times the size of the slab are studied. All the results in this study are plotted in nomographs form and can be used as guidelines for the analysis and design of slabs with circular openings and particularly in
determining the ultimate load carrying capacity of the slabs.
Keywords:Ultimate load, Square slabs, Circular openings, Capacity, Yield line analysis, Isotropic slab. I.Introduction
Slabs with openings are usually required for plumbing, fire protection pipes, heat and ventilation ducts and air conditionings. But larger size circular openings are required for elevators, spiral staircases and for architectural aspects. While designing the slab, The circular openings are designed assuming equivalent square openings. So this study is mainly to evaluate the square slabs with central circular openings theoretically and compare with the slabs with central square openings by the yield line method of analysis.
A. Kwan et al. (2013) [1] using Dip and Strike angles of Yield line theory have evaluated two-way slabs with rectangular and circular openings of the same sizes and the results show that the load factor of the rectangular slab with circular opening is more than the rectangular slab of same size with rectangular opening.
C. Ng et al. (2008) [2] have theoretically evaluated the load carrying capacity of the square slabs with centrally placed square openings with simple and fixed edge conditions and reports that for simple supports with opening sizes starting from 0.05 to 0.5 times the dimensions of slabs the ultimate area
load decreases and increases thereafter with an increase
of up to 257% and for fixed supports openings greater than 0.5 times the slab dimension will result in increase of ultimate area load exponentially up to 2400%.
A. Zaslavsky (1967) [3] has theoretically calculated the simply supported rectangular slabs with central rectangular openings and concluded that to improve the performance of slab in practical conditions the total reinforcement should be distributed more densely near the opening and less near the supporting edges.
From the studies as discussed above circular openings differ in strength compare to rectangular/square openings of same sizes as reported by A. Kwan et al (2013) [1].
II. Methodology
The virtual work equations of the yield line theory are widely used by the structural engineers as it is simple, versatile and requires simple calculations compare to the finite element method of analysis which is too conservative and less economical. The work equations are formed by equating the energy absorbed by yield lines (internal work done) and the
workdone by the external load of the orthogonal rectangular slabs with central square and circular openings, Where a small virtual displacement is given to the slab. The same principal used by Islam and Park [5]. which is
, 0 , 0
( , )
(
)
u u x x u y y
W
δ
x y dxdy
m
θ
y
m
θ
x
∫ ∫
=
∑
+
(1)where Wu is the ultimate load per unit area of slab,
δ(x,y) is the virtual displacement in the direction of
loading at the element of area of
dimensionsdx,dy,mu,x and mu,ythe yield moments per unit widthin the x and y directions and θxand θyare
the components of the virtual rotation of the slab segments in x and y directions and x0 and y0 are the projected length of the yield lines in x and y directions of slab.
A.Virtual works equations
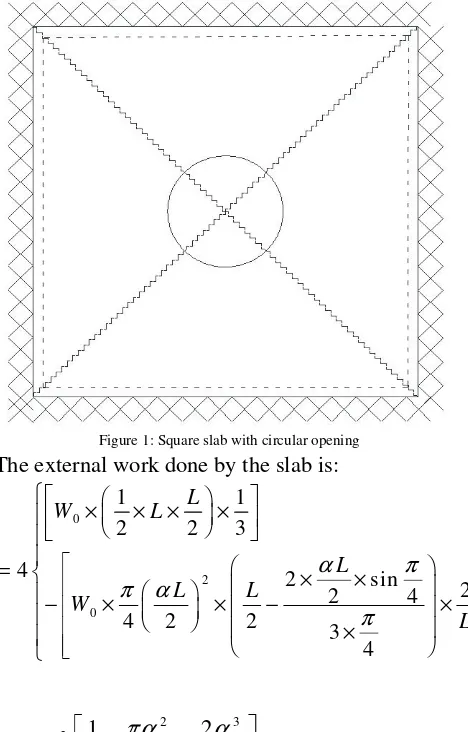
As proposed by C. Ng et al (2008) [2] at ultimate limit state, the yield line is assumed to stretch from the corner of the opening to the corner of the slab [5] in case of square opening as shown in Figure 2. This is assumed to work the same in case of circular opening and stretch upto opening as shown in Figure 1. These yield lines stretching straight from the slab corner can be assumed to occur only when the corners are held down with torsional reinforcements in case of a simply supported slab. When a virtual displacement defined by a unit value under uniform area load wuis applied to the corner of the opening.
B. Derivation of virtual works equation:
1)The virtual works equations for a slab with central circular opening
The orthogonally reinforced square slab of length L having a circular opening of diameterαL with the
given configuration and the yield criteria is shown in Figure: 1(a) The slab is subjected to a uniformly distributed load (W0) and the resulting ultimate moment is (Mu) and supported by fixed edge condition however for simply supported condition the changes are made in the moment co-efficientsI1 =I2 =I3 =I4=0 (refer Notations).
Note that the slab is not carrying any load over the area of the opening.
The derived equation below is for the continuously supported slabs with circular central openings.
Figure 1: Square slab with circular opening The external work done by the slab is:
0
2 0
1 1
2 2 3
4 2 sin
2
2 4
4 2 2 3
4 L
W L
L
L L
W
L
α π
π α
π
× × × ×
= × ×
− × × − ×
×
2 3
2 0
1 2
3 4 3 2
W L
πα
α
= − +
(2)
The internal work done by the slab with circular opening is
a) Internal work due to positive yield lines
' ' 2 ' ' 2
4 M ku x L M ku y L
L L
= × × + × ×
Note ' 2 co s
2 2 4
L L
L α π
= − × ×
(
' ')
24
2
u x y
M k k −
α
= × × + ×
b) Internal work due to negative yield lines
(
1 2 3 4)
2
uM
I
I
I
I
L
L
=
+
+
+
×
×
(
)
(
)
1 2 3 4
' ' 2 2 4 2 u
u x y
M I I I I
M k k α
+ + + = − + + (3)
Equating the internal work done to the external work done the equation thus obtained is
(
' ')
1 2 3 42 0 2 3 2 2 2 1 2
6 8 6
x y
u
I I I I k k
W L M
α
πα
α
− + + + + + = − + (4)For a simply supported slab with isotropic reinforcement without opening the equation is of the form 2
24
u uW L
M
=
(5)For a fixed slab without opening with isotropic
reinforcement the equation for β value 0.5 is of the
form 2
36
u uW L
M
=
(6)The equation for β value 1.0 is
2
48
u u
W L
M
=
(7)The equation for β value 1.5 is
2
40
u u
W L
M
=
(8)The equation for β value 2.0 is
2
36
u u
W L
M
=
(9)The ratio of ultimate area load for a slab with an opening to the ultimate area load for a slab without opening with simple support condition can be obtained by dividing Equation (4) by Equation (5), that is,
(
' ')
(
)
0 2 32
3
2 2
4
2
x y uk
k
W
W
α
πα
α
+
−
=
−
+
(10)The ratio of ultimate area load for a slab with an opening to the ultimate area load for a slab without
an opening with fixed support and β value 0.5& 2 is
(
' ')
1 2 3 4 0 2 3 2 2 2 9
6 6 2
2
x y
u
I I I I k k
W W α πα α − + + + + + = − + (11)
The ratio of ultimate area load for a slab with an opening to the ultimate area load for a slab without
an opening with fixed support and β value 1 is
(
)
(
)
' '
1 2 3 4
0
2 3
2
2
2
8
6
8 2
x y
u
I
I
I
I
k
k
W
W
α
πα
α
−
+
+
+
+
+
=
−
+
(12)The ratio of ultimate area load for a slab with an opening to the ultimate area load for a slab without
an opening with fixed support and β value 1.5 is
(
' ')
1 2 3 4
0 2 3
2
2
2
20
20
5
2
3
3
x y uI
I
I
I
k
k
W
W
α
πα
α
−
+
+
+
+
+
=
−
+
(13)For the study of total load, P0 is defined as the total
ultimate load on the slab with an opening given as
2 2
0 0
2
L
P
=
W
×
L
−
π
α
(14)2
24
u u u
P
=
W L
=
M
(for simply supported slab)(15)
2
36
u u u
P =W L = M (forfixed slabs at β value 0.5)
(16)
2
48
u u u
P =W L = M (for fixed slabs at β value 1)
(17)
2 40
u u u
P =W L = M (for fixed slabs at β value 1.5) (18)
2
36
u u u
P =W L = M for fixed slabs at β value 2) (19)
condition can be obtained by dividing Equation (9) by Equation (10) that is,
(
)
(
)
(
)
(
)
' ' 2
0
2 3
2 4
8 2 6 2 16
x y
u
k k P
P
α πα
πα α
+ − −
=
− +
(20)
The ratio of ultimate total area load for a slab with an opening to the total ultimatetotal area load for a slab without opening with fixed supportcondition and β value 0.5 and 2 is
(
)
2 ' '
1 2 3 4 0
2 3
2
4 2
2
24 18 24 2
x y
u
I I I I k k
P P
α πα
πα α
−
− + + + + +
=
− +
(21)
The ratio of ultimate total area load for a slab with an opening to the total ultimate toal area load for a slab without opening with fixed support condition and β value 1.0 is
(
)
2 ' '
1 2 3 4 0
2 3
2
4 2
2
32 24 32 2
x y
u
I I I I k k
P P
α πα
πα α
−
− + + + + +
=
− +
(22)
The ratio of ultimate total area load for a slab with an opening to the total ultimate area load for a slab without opening with fixed support condition and β
value 1.5 is
(
)
2 ' '
1 2 3 4 0
3 2
2
4 2
2
80 80 2
20
3 3
x y
u
I I I I k k
P P
α πα
α πα
−
− + + + + +
=
− +
(23)
The Squareslabs with CO starting from 0.025 to 0.9 are investigated and their strength is evaluated and compared with results of Square slabs with square openings of same sizes and the comparative graphs are plotted in the form of nomographs in the results and discussion section.
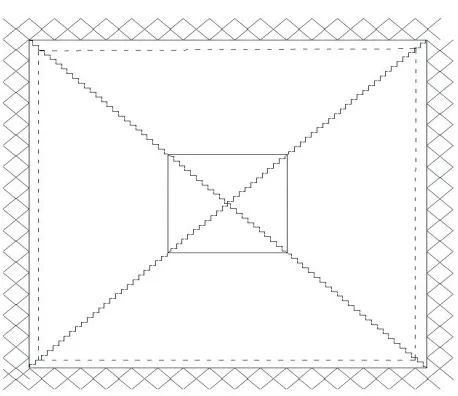
B.The virtual works equation for a slab with central square opening
The Equation for ultimate area load and ultimate total area load for a square slab with central square
openings is obtained in similar way as in the case of circular openings and the equations thus obtained are
Note: the equations for square slabs with centrally placed square openings are also presented in
similar way by other researchers like C. Ng (2008) [2]
Figure 2: Square slab with square opening
The normalized ultimate area load for a simply supported edge condition of the slab is:
(
)
(
' ')
20
2 3
2 1
1
6
2
3
x y
u
I
I
I
I
k
k
W L
M
α
α
α
+ + + +
−
+
=
−
+
(24)
(
)
(
' ')
0
2 3
1
2 6
4
x y
u
k
k
W
W
α
α
α
−
+
=
−
+
(25)The normalized ultimate total area load for a simply supported edge condition of the slab is:
(
)
(
)
(
)
(
)
2
' ' 2
0
2 3
1
2 6
4
x y
u
k
k
L
L
P
P
α
α
α
α
−
+
−
=
−
+
(26)The normalized ultimate area load for a fixed support edge condition of the slab wih β value 0.5 & 2
(
)
(
)
(
)
' '
1 2 3 4
0
2 3
2 1
6 18
12
x y
u
I
I
I
I
k
k
W
W
α
α
α
+
+
+
+
−
+
=
−
+
The normalized ultimate area load for a fixed support edge condition of the slab wih β value 1
(
)
(
)
(
)
' '
1 2 3 4
0
2 3
2 1
8 24
16
x y
u
I
I
I
I
k
k
W
W
α
α
α
+
+
+
+
−
+
=
−
+
(28)
The normalized ultimate area load for a fixed support edge condition of the slab wih β value 1.5
(
)
(
' ')
1 2 3 40
2 3
2 1
20 40
20
3 3
x y
u
I I I I k k
W W
α
α α
+ + + + − +
=
− +
(29)
The normalized ultimate total area load for a fixed support at β value 0.5&2.0 is
(
)
(
)
2 ' '
1 2 3 4 0
2 3
1 2 1
6 18 12
x y
u
I I I I k k
P P
α α
α α
− + + + + − +
=
− +
(30)
The normalized ultimate total area load for a fixed support at β value 1 is
(
)
(
)
2 ' '
1 2 3 4 0
2 3
1 2 1
8 24 16
x y
u
I I I I k k
P P
α α
α α
− + + + + − +
=
− +
(31) The
normalized ultimate total area load for a fixed support at β value 1.5 is
(
)
(
)
2 ' '
1 2 3 4 0
2 3
1 2 1
20 40
20
3 3
x y
u
I I I I k k
P P
α α
α α
− + + + + − +
=
− +
(32)
However results obtained from the equations of the square slabs with square openings derived above were the same when compared with the results evaluated by C. Ng et al. (2008) [2].Thus ensuring the correctness of the equations and indicating exact agreement for the equations derived in this form.
III. Results
A.Simply supported square slab with square and circular opening placed centrally
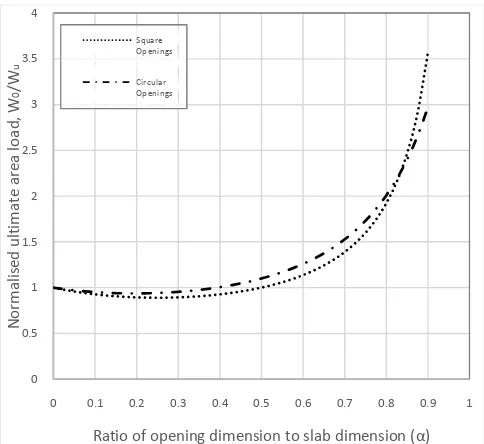
Figure 3 shows the results of the effect of the size of openings of both circular and square dimensions on the ultimate area load capacity of the square slab. It is plotted using Equations (10) & (25) as derived in the preceding section. For a given ratio
of opening (be it circular or square) of the slab the size of slab has no effect on the results as evaluated by C. Ng et al (2008) [2].
As indicated in Chart 1 the ultimate area load capacity of slabs decreases and shows a reduction upto 6.4% for CO (circular opening) and 11% for SO (square opening) with increase in size of opening between 0 to 0.4 for CO and 0 to 0.5 for SO and increases thereafter upto 196% for CO and 257% for SO. In a SS square slab COs possess more strength than the SOs of the same dimension and is due to the fact that the length of the yield lines of COs is more than the length of the SOs.
Chart 1: Comparative effect of size of circular openings and square openings on ultimate area load of simply supported square slab.
The load carrying capacity increases after α = 0.4 for CO and α = 0.5 for SO is due to the rapid decrease in external virtual work as it is a product of area of the slab (which decreases as the opening increases) and the deflection of that area at the centroid (as the centroid concencrates towards the edges) compared to the internal work done by resisting moments which decreases linearly.
It can be seen in Chart 2 that the ultimate total load carrying capacity of the slab with SO decreases with increase in opening ratio (α) and shows a maximum reduction of upto 33% at (α = 0.5) .Whereas maximum reduction in slabs with CO is upto 12% at (α = 0.4) .However the strength increases at α = 0.8 (or more) and shows a maximum increase of 8%. Resulting in Slabs with
0 0.5 1 1.5 2 2.5 3 3.5 4
0 0.1 0.2 0.3 0.4 0.5 0.6 0.7 0.8 0.9 1
N
o
rm
a
li
se
d
u
lt
im
a
te
a
re
a
l
o
a
d
,
W
0
/W
u
Ratio of opening dimension to slab dimension (α)
COs having more strength than the slabs with SOs.
Chart 2: Comparative effect of size of circular openings and square openings on ultimate total area load of simply-supported square slab Note: The values evaluated here are for orthogonal slabs with isotropic reinforcements in case of square openings. And for circular openings the reinforcements are orthogonal and isotropic with additional circular reinforcement near the openings.
B. Fixed supported square slab with square and circular opening placed centrally
For lower values of (α) fixed supported slabs the COs shows less reduction in percentage of both ultimate load carrying capacity and ultimate total load capacity compare to the slabs with SOs,
1) Comparative effects of size of both circular and square openings on ultimate area load of the square slab: Slabs with 4 different value of (β) = ratio of positive to negative moments of resistances were evaluated. The ratios being 0.5, 1.0, 1.5 & 2.0. Thus in order to get different ratios, change is done in
' '
1 2 3 4
( ,k k I I I Ix y, , , , , ) values in Equations derived.
Chart 3: Comparative effect of size of circular openings and square openings on ultimate area load on square slabs with fixed supports a) Slabs with β= 0.5, (kx' =k'y=1,I1=I2= =I3 I4=0.5) Chart 3 shows The ultimate area load of the slabs decreases for α values 0 to 0.25 and shows a maximum reduction of 4.3% for slabs with SOs and 2.6% for Slabs with COs and increases for α values greater than 0.25 and shows an increment of 1300% for Slabs with SOs and 370% for slabs with Cos. The square slabs for α values between 0.75 and 0.9 shows a drastic increase in strength from 220% to 1300%. However both the slabs with COs and SOs have nearly the same strength for α values ranging from 0.25 to 0.5
b) Slabs with (β) 1.0 ' '
1 2 3 4
(kx=ky =1,I =I =I =I =1) Chart 4 shows The ultimate area load of the slabs decreases for α values 0 to 0.15 and shows a maximum reduction of 2.3% for slabs with SOs and 1.4% for Slabs with COs and increases for α values greater than 0.15 and shows an increment of 1860% for slabs with SOs and 460% for slabs with COs. However both the slabs with COs and SOs have nearly the same strength for α values ranging from 0.15 to 0.4.
0 0.2 0.4 0.6 0.8 1 1.2
0 0.1 0.2 0.3 0.4 0.5 0.6 0.7 0.8 0.9 1
N
o
rm
a
lis
e
d
u
lt
im
a
te
a
re
a
l
o
a
d
,
P
0
/P
u
Ratio of opening dimension to slab dimension (α)
Square Openings
Circular
Openings 0
2 4 6 8 10 12 14 16
0 0.1 0.2 0.3 0.4 0.5 0.6 0.7 0.8 0.9 1
N
o
rm
a
lis
e
d
u
lt
im
a
te
a
re
a
l
o
a
d
,
W
0
/W
u
Ratio of opening dimension to slab dimension (α)
Square opening
Chart 4: Comparative effect of size of circular openings and square openings on ultimate area load on square slabs with fixed supports c) Slabs with (β)=1.5 ' '
1 2 3 4
(kx=ky=0.667,I =I =I =I =1) Chart 5 shows The ultimate area load of the slabs decreases for α values 0 to 0.1 and shows a maximum reduction of 1.4% for slabs with SOs and nearly 1% for Slabs with COs and increases for α
values greater than 0.1 and shows an increment of 2150% for slabs with SOs and 500% for slabs with COs.
Chart 5: Comparative effect of size of circular openings and square openings on ultimate area load on square slabs with fixed supports However both the slabs with COs and SOs have nearly the same strength for α values ranging from 0.1 to 0.3.
d) Slabs with (β) =0.5, ' '
1 2 3 4
(kx=ky=0.5,I =I =I =I =1) Chart 6 shows The ultimate area load of the slabs decreases for α values 0 to 0.1 and shows a
maximum reduction of nearly 1% for slabs with SOs and 0.6% for Slabs with COs and increases for
α values greater than 0.1 and shows an increment of 2400% for slabs with SOs and 545% for slabs with COs.
Chart 6: Comparative effect of size of circular openings and square openings on ultimate area load on square slabs with fixed supports
However both the slabs with COs and SOs have nearly the same strength for α values ranging from 0.1 to 0.3.
2) Comparative effects of size of both circular and square openings on ultimate total area load of the square slab:
Slabs with 4 different value of (β) = ratio of positive to negative moments of resistances were evaluated. The ratios being 0.5, 1.0, 1.5 & 2.0. Thus in order to get different ratios, change is done in
' '
1 2 3 4
( ,k k I I I Ix y, , , , , ) values in Equations (12) & (17)
a) Slabs with (β) =0.5, ' '
1 2 3 4
(kx=ky=1,I =I =I =I =0.5)
It can be seen in Chart 7 that for both the slabs the ultimate total area load carrying capacity of the slabs decreases with increase in opening ratio (α) and shows a maximum reduction of upto 7.4% at (α
= 0.25) for Slabs with SOs .Whereas maximum reduction in slabs with CO is upto 4.4% at (α = 0.2) .However the strength increases for slabs with SOs at α = 0.5 (or more) and shows a maximum increase of 172% and for COs at α = 0.4 (or more) the capacity increases a maximum of upto 71%. Resulting in Slabs with SOs having more capacity than the COs
0 5 10 15 20 25
0 0.1 0.2 0.3 0.4 0.5 0.6 0.7 0.8 0.9 1
N
o
rm
a
lis
e
d
u
lt
im
a
te
a
re
a
l
o
a
d
,
W
0
/W
u
Ratio of opening dimension to slab dimension (α)
Square opening
Circular opening
0 5 10 15 20 25
0 0.1 0.2 0.3 0.4 0.5 0.6 0.7 0.8 0.9 1
N
o
rm
a
lis
e
d
u
lt
im
a
te
a
re
a
l
o
a
d
,
W
0
/W
u
Ratio of opening dimension to slab dimension (α)
Square opening Circular opening
0 5 10 15 20 25 30
0 0.1 0.2 0.3 0.4 0.5 0.6 0.7 0.8 0.9 1
N
o
rm
a
lis
e
d
u
lt
im
a
te
a
re
a
l
o
a
d
,
W
0
/W
u
Ratio of opening dimension to slab dimension (α)
Square opening
Chart 7: Comparative effect of size of circular openings and square openings on ultimate total area load of square slabs with fixed supports b) Slabs with (β) =1.0, ' '
1 2 3 4
(kx=ky=1,I =I =I =I =1)
Chart 8 shows that for both the slabs the ultimate total area load carrying capacity of the slabs decreases with increase in opening ratio (α) and shows a maximum reduction of upto 3.8% at (α = 0.15) for Slabs with SOs .Whereas maximum reduction in slabs with CO is upto 2.3% at (α = 0.15) .However the strength increases for slabs with SOs at α = 0.35 (or more) and shows a maximum increase of 273% and for COs at α = 0.3 (or more) the capacity increases a maximum of upto 102%.
Chart 8: Comparative effect of size of circular openings and square openings on ultimate total area load of square slabs with fixed supports
c) Slabs with (β) =1.5, ' '
1 2 3 4
(kx=ky=0.667,I =I =I =I =1) Chart 9 shows that for both the slabs the ultimate total area load carrying capacity of the slabs decreases with increase in opening ratio (α) and shows a maximum reduction of upto 2.3% at (α = 0.1) for Slabs with SOs .Whereas maximum reduction in slabs with CO is upto 1.4% at (α = 0.1). However the strength increases for both slabs openings at α = 0.25 (or more) and shows a
maximum increase of 335% SOs and for COs it is upto 120%.
Chart 9: Comparative effect of size of circular openings and square openings on ultimate total area load of square slabs with fixed supports d) Slabs with (β) =1.5, (kx'=k'y=0.5,I1= = = =I2 I3 I4 1)
Chart 10: Comparative effect of size of circular openings and square openings on ultimate total area load of square slabs with fixed supports Chart 10 shows that for both the slabs the ultimate total area load carrying capacity of the slabs
0 0.5 1 1.5 2 2.5 3
0 0.1 0.2 0.3 0.4 0.5 0.6 0.7 0.8 0.9 1
N
o
rm
a
li
se
d
u
lt
im
a
te
a
re
a
l
o
a
d
,
P
0
/P
u
Ratio of opening dimension to slab dimension (α)
Square opening Circular opening
0 0.5 1 1.5 2 2.5 3 3.5 4
0 0.1 0.2 0.3 0.4 0.5 0.6 0.7 0.8 0.9 1
N
o
rm
a
lis
e
d
u
lt
im
a
te
a
re
a
l
o
a
d
,
P
0
/P
u
Ratio of opening dimension to slab dimension (α)
Square opening
Circular opening
0 0.5 1 1.5 2 2.5 3 3.5 4 4.5 5
0 0.1 0.2 0.3 0.4 0.5 0.6 0.7 0.8 0.9 1
N
o
rm
a
lis
e
d
u
lt
im
a
te
a
re
a
l
o
a
d
,
P
0
/P
u
Ratio of opening dimension to slab dimension (α)
Square opening
Circular opening
0 0.5 1 1.5 2 2.5 3 3.5 4 4.5 5
0 0.1 0.2 0.3 0.4 0.5 0.6 0.7 0.8 0.9 1
N
o
rm
a
li
se
d
u
lt
im
a
te
a
re
a
l
o
a
d
,
P
0
/P
u
Ratio of opening dimension to slab dimension (α)
Square opening
decreases with increase in opening ratio (α) and shows a maximum reduction of upto 1.5% at (α = 0.1) for Slabs with SOs .Whereas maximum reduction in slabs with CO is upto 1% at (α = 0.1). However the strength increases for both slab openings at α = 0.2 (or more) and shows a maximum increase of 375% SOs and for COs it is upto 135%.
IV. Discussion
Note: The values for all the slabs with square openings are exactly the same as the values obtained by Ng Edward and Lee (2008). The values of circular openings were checked manually without the equations derived above and were the same.
The behavior of the slabs with fixed edges are very different from slabs with simply supported edges for both types of slab openings, As the fixed supported slabs show an exponential increase in the strength of the slab due to the fact that the external virtual work of slabs remaining the same for both the edge conditions and the internal work being more compare to the simple supports, as fixed support edges has both positive and negative reinforcements thus increasing the internal energy which can take higher loads and maintain equilibrium. Generally for α values of 0.2 or more the slabs have higher ultimate load carrying capacity than the solid slab, The reason behind this is the cantilever effect of the slabs due to negative reinforcements and the influence of the positive reinforcement decreases as the opening ratio (α) increases, The internal energy due to the negative reinforcement (moment of resistance) remains the same however care has to be taken in providing anchorage length to the negative reinforcements for higher values of α as reinforcement may overlap the openings, and in such cases the diameter of the reinforcement needs to be decreased
In a simply supported slab irrespective of circular or square opening there is a decrease in the ultimate load carrying capacity for α values 0 to 0.5 with a maximum reduction of 6.4% for CO and 11% for SO. However, for values of α greater than 0.5 the capacity increases upto a maximum percentage increase of 196% for CO and 257% for SO. Circular openings have more ultimate load carrying capacity than the slab with square openings for α
values starting from 0 to 0.8. The slabs with square openings showed a constant decrease in the ultimate total area load capacity with maximum decrease of 32% (at α value 0.9), Whereas the slabs with circular openings showed a hyperbolic decrease in percentage for α values 0 to 0.8 with maximum reduction of 12.2% (at α value 0.4) and for α values from 0.8 to 0.9 it increased upto 8%. The Results of the slabs with fixed edges for β
(ratio of negative to positive reinforcement) value 0.5, The ultimate area load decreases with increase in α from 0 to 0.25 with a maximum reduction of 4.3% for SO and 2.6% for CO. And increased at α
values 0.25 to 0.9 with a maximum increase of 1300% for SO and 370% for CO. For β value 1.0 the ultimate area load decreased from 0 to 0.15 with a maximum reduction of 2.3% for SO and 1.4% for CO. And increased at α values 0.15 to 0.9 with a maximum increase of 1860% for SO and 460% for CO. For β value 1.5 the ultimate area load decreased from 0 to 0.1 with a maximum reduction of 1.4% for SO and 1% for CO. And increased at α
values 0.1 to 0.9 with a maximum increase of 2150% for SO and 500% for CO. For β value 2.0 the ultimate area load decreased from 0 to 0.1 with a maximum reduction of 1% for SO and 0.6% for CO. And increased at α values 0.1 to 0.9 with a maximum increase of 2400% for SO and 545% for CO.
For a β value 0.5 the ultimate total area load decreases for α values starting from 0 to 0.5 for square opening and 0 to 0.4 for circular opening. The maximum reduction of 7.4% (at α value 0.25) for SO and 4.4% (at α value 0.2) for CO was noted. At α value greater than 0.5 there was an increase of upto 172% for slab with SO and at α value greater than 0.4 there was an increase of upto 71%. For a β
value of 1 the ultimate total area load decreases for
α values starting from 0 to 0.35 for square opening and 0 to 0.3 for circular opening. The maximum reduction of 3.8% (at α value 0.15) for SO and 2.3% (at α value 0.15) for CO was noted. At α
value greater than 0.35 there was an increase of upto 273% for slab with SO and at α value greater than 0.3 there was an increase of upto 102%. For a
and 1.4% (at α value 0.1) for CO was noted. At α
value greater than 0.25 there was an increase of upto 335% for slab with SO and upto 120% for CO. For a β value of 2 the ultimate total area load decreases for α values starting from 0 to 0.2 for both SO and CO. The maximum reduction of 1.5% (at α value 0.1) for SO and 1% (at α value 0.1) for CO was noted. At α value greater than 0.2 there was an increase of upto 375% for slab with SO and upto 135% for CO.
V. Conclusion
A study on the comparative effect of circular and square opening on the load carrying capacity of the square slab with simply supported and fixed ends was presented and discussed.
The simply supported square slabs with circular openings are stronger than the slabs with square openings.
The square slabs with square openings with fixed edges are stronger than the slabs with circular openings
However the reduction in strength of slabs with circular openings is less when compared to the slabs with square openings.
The stress concentrations near the openings are high so for slabs with circular openings it is recommended to provide two circulars reinforcement bars near the openings at the bottom of the slabas shown in Appendix A so as to resist the stress near the openings.
References
[1] A. K. H. Kwan, J. Y. Lam, and P. L. Ng, “Yield Line Analysis of Reinforced Concrete Slabs with Openings by Dip and Strike Angles Method,” Advances in Structural Engineering, vol. 16, no. 7, pp. 1223–1233, 2013.
[2] C. K. Ng, T. J. Edward, and D. K. T. Lee, “Theoretical Evaluation on Effects of Opening on Ultimate Load-carrying Capacity of Square Slabs,” Electronic Journal of Structural Engineering, vol. 8, no. 8, pp. 12–19, 2008.
[3] A. Zaslavsky, “Yield Line Analysis of Rectangular Slabs With Central Openings,” ACI Journal Proceedings, vol. 64, no. 12, pp. 838–844, 1967.
[4] Johansen, K.W., “Yield-Line Theory”, Cement and Concrete Association, London, 1962, pp 181.
[5] Islam,S. and Park, R., “Yield line analysis of two-way reinforced concrete slabs with openings”, The Struct. Engr., June 1971, Vol. 49, No. 6, pp 269-275.
[6] R. Park, and W. L. Gamble, “Reinforced Concrete Slabs, 2nd
edition”. New York: John Wiley & Sons, 2000.
Notations
Positive Yield Line Negative Yield Line
kx’ Co-efficient of Positive ultimate yield Moment per unsssit length provided by bottom tension Bars placed parallel to X-axis
ky’ Co-efficient of Positive ultimate yield Moment per unit length provided by bottom tension Bars placed parallel to Y-axis
I1 Co-efficient of Negative ultimate yield Moment per unit length provided by top tension Bars placed
parallel to X-axis at the left shorter edge of the slab
I2 Co-efficient of Negative ultimate yield Moment per unit length provided by top tension Bars placed
parallel to Y-axis at the upper longer edge of the slab I3 Co-efficient of Negative ultimate yield Moment per unit length provided by top tension Bars placed
parallel to X-axis at the left shorter edge of the slab
I4 Co-efficient of Negative ultimate yield Moment per unit length provided by top tension Bars placed
parallel to Y-axis at the lower longer edge of the slab CO Circular openings
SO Square openings
α ratio of opening dimension to the slab dimension β ratio of positive to negative reinforcement co-efficient W0 Ultimate load per unit area of the slab with opening
Wu Ultimate load per unit area of the slab without opening