Development and validation of UV spectrophotometric methods for simultaneous estimation of ciprofloxacin and tinidazole in tablet dosage form
6
0
0
Full text
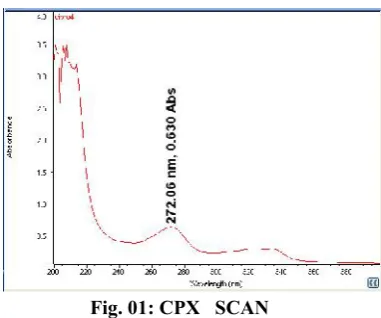
(2) 296. Prathyusha V. et al., Int. J. Pharm & Ind. Res., Vol.–03 (03) 2013 [295 - 300]. Tinidazole (TNZ) [1-(2-ethylsulfonylethyl)-2methyl-5-nitroimidazole] is a 5-nitroimidazole derivative, an anti-parasitic drug used against protozoan infections. It is also used in the treatment of a variety of amoebic and parasitic infections [2]. The nitro-group of Tinidazole is reduced by cell extracts of trichomonas. The free nitro-radical generated as a result of this reduction may be responsible for the antiprotozoal activity. Chemically reduced Tinidazole was shown to release nitrites and cause damage to purified bacterial DNA in in-vitro. Additionally, the drug caused DNA base changes in bacterial cells and DNA strand breakage in mammalian cells. The mechanism by which Tinidazole exhibits activity against Giardia and Entamoeba species is not known. [3] Its Empirical formula: C8H13N3O4S & Molecular weight: 247.2.. Materials and methods Instruments Absorbance measurements were made on Thermoscientific Evolution 201 UV/Visible spectrophotometer with a pair of 10 mm matched quartz cells, Schimadzu digital balance for Weighing and Amkette Super Sonic Cleaner for sonication were used. Materials and Reagents All chemicals were of analytical reagent grade and solutions were prepared with double distilled water. Ciprofloxacin and Tinidazole gift samples were obtained from college. NaOH and HCl were obtained from college. Combined tablets of CPX and TNZ (Ciplox-Tz) were procured from the local pharmacy. Procedure Preparation of 0.1N NaOH & 0.1N HCl: Weigh about 0.2 g of NaOH & 8.5 ml of HCl and transfer to two separate 1000 ml volumetric flasks and add few ml of distilled water to dissolve them and make up the volume up to the mark.. Structure of Tinidazole The official methods are available for the estimation of Ciprofloxacin and Tinidazole in various pharmacopoeias like IP, BP, and USP. The IP [4] and USP [5] describe HPLC method and BP [6] describes non-aqueous titration method for estimation of CPX. The USP [7] and BP [8] describe titrimetry method for estimation of Tinidazole. There are no official methods for simultaneous estimation of Ciprofloxacin and Tinidazole in any pharmacopoeias. Literature survey reveals some methods for simultaneous estimation of CPX and TNZ by UV-Spectrophotometric methods[9-12]. It also reveals some RP-HPLC [13-15] methods along with other drugs like Ofloxacin, Ornidazole, some Spectroflorimetric methods [16] and difference pulse polarography [17] method is also available for two drugs. The study aimed at developing and validating a method for simultaneous estimation of Ciprofloxacin and Tinidazole in pure and tablet dosage forms using Simultaneous Equation Method and Absorbance Ratio Method.. Preparation of Stock solution (1000 µg/ml): Accurately weighed about 10 mg of pure CPX & TNZ were transferred to four, 10 ml volumetric flasks and make up to the mark with the respective solvents 0.1N NaOH & 0.1N HCl. Preparation of working standard solution (100 µg/ml): From the above stock solution 1mL each of CPX and TNZ was taken, transferred to separate 10mL volumetric flasks and the volume was made up to 10 mL with 0.1N NaOH for method A & with distilled water for method B. Simultaneous equation method (Method A): 0.1N NaOH [18] 10 μg/mL solutions of CPX and TNZ were prepared separately in 0.1N NaOH and the solutions were scanned against blank in the entire UV range to determine the λmax values. Clear peaks were observed at 272 nm for CPX and 365 nm for TNZ. Hence these wavelengths were chosen as the λmax values for each drug respectively (Fig 1). Standard solutions of CPX and TNZ in the concentration range of 2-7 μg/mL and 4-24 μg/mL respectively were prepared in 0.1N NaOH and the absorbance of these solutions was measured at 272 nm and 365 nm. Calibration curves were. www.ijpir.com.
(3) Prathyusha V. et al., Int. J. Pharm & Ind. Res., Vol.–03 (03) 2013 [295 - 300]. 297. plotted to verify the Beer’s law and the absorptivity values were calculated at the respective wave lengths for both the drugs. Two simultaneous equations as below were formed using these absorptivity values, A (1%, 1cm).. A1 = 924bCx + 108bCy A2 = 339bCx + 367bCy Where, CX and CY are the concentrations of CPX and TNZ measured in gm/100mLin sample solutions. A1 and A2 are the absorbances of sample at selected wavelengths 272 nm and 365 nm respectively.. Fig. 01: CPX SCAN. TNZ SCAN. Absorbance ratio method/Q - analysis (Method B): 0.1N HCl [18] The absorbance ratio method is a modification of the simultaneous equation procedure. It depends on the property that for a substance, which obeys Beer’s law at all wavelength, the ratio of absorbance at any two wavelengths is constant value independent of concentration or path length. E.g. two dilutions of the same substance give the same absorbance ratio A1 / A2. In the USP, this ratio is referred to as Q value. In the quantitative assay of two components in admixture by the absorbance ratio method, absorbance’s are measured at two wavelengths, one being the λ max of one of the components (λ2) and the other being a. wavelength of equal absorptivity of the two components(λ1), i.e., an isoabsorptive point (Beckett and Stenlake, 2005). A series of standard solutions of CPX and TNZ in the concentration range of 2-7 μg/mL and 4-24 µg/mL respectively were prepared in 0.1N HCl and the absorbance of these solutions was measured at 299 nm (isoabsorptive point) and 277 nm(λmax of CPX) (Fig.2). Calibration curves were plotted to verify the Beer’s law and the absorptivity values calculated at the respective wavelengths for both the drugs. The concentration of two drugs in mixture was calculated by using the following equations:. Where, A1 and A2 are the absorbance of mixture at 299 nm and 277 nm, ax1 (or) ay1, ax2 and ay2 are absorptivities A (1%, 1 cm) of TNZ and CPX at 299 nm and 277 nm respectively.. www.ijpir.com.
(4) 298. Prathyusha V. et al., Int. J. Pharm & Ind. Res., Vol.–03 (03) 2013 [295 - 300]. Fig. 02: Overlay spectrum of CPX & TNZ Assay of tablets by Method A and B 20 commercial tablets of CPX and TNZ were triturated and powder equivalent to 50 mg of CPX and 60 mg of TNZ respectively was weighed and transferred to two 100 ml volumetric flask, dissolved in NaOH & HCl, volume adjusted up to the mark with the same solvent and mixed well with the help of a sonicator. The solution was filtered through Whatman filter paper no 40.1mL of the above filtrate was diluted to 10mL with NaOH & HCl to obtain a 5 μg/mL solution of CPZ & 6 µg/ml solution of TNZ. The absorbance of the sample solution was measured at 272 nm and 365 nm (Method A), 299 nm and 277 nm (Method B) and the data was analyzed accordingly using the necessary equations. The result of analysis of tablet formulation is reported in Table 2. Analytical method validation: [19-20] All methods were validated for different parameters like linearity, specificity, accuracy and precision. Linearity was checked by calculating regression coefficient. The accuracy of the method was determined by calculating percentage drug recovery of CPX & TNZ at three levels 50%, 100% and 150%. The inter-day and intra-day precision of the proposed method was determined. The %RSD of prepared concentrations was analysed for precision studies. Results and Discussion The proposed methods for simultaneous estimation of CPX and TNZ in combined dosage form were found to be accurate, simple and rapid which can be well understood from validation data as given in Table 1 to 4. The % R.S.D. was found to be less than 2, which indicates the validity of methods. Linearity was observed by linear regression equation method for CPX and TZ in different concentration range. The Correlation coefficient of these drugs was found to be close to 1.00, indicating good linearity in Table 1. The assay results obtained by proposed methods as shown in Table 2 are in fair agreement. Percentage drug recovery (± RSD) of CPX and TNZ are shown in table 3. In all the cases RSD was not more than 2% depicting the accuracy of the developed method. Results of %RSD obtained from intra-day studies and inter-day studies are shown in table 4. From obtained data, it was found that RSD was not more than 2% indicating developed method has good repeatability. Hence it can be used for routine analysis of two drugs in combined dosage forms. These methods are accurate, simple, rapid, precise, reliable, sensitive, reproducible and economic and are validated as per ICH guidelines. Table No. 01: Linearity and Regression coefficient data S.No 1 2. Parameter Linearity Correlation coefficient(r2). Ciprofloxacin Method A Method B 2-7 2-7 0.9998 0.999. www.ijpir.com. Tinidazole Method A Method B 4-24 4-24 0.9996 0.9994.
(5) 299. Prathyusha V. et al., Int. J. Pharm & Ind. Res., Vol.–03 (03) 2013 [295 - 300]. Table No. 02: Assay results for CPX & TNZ Method A B. Label claim (mg/tab) CPX 500 500. Amount Found(mg/tab). TNZ 600 600. CPX 480 494. % Label Claim. TNZ 577.5 601.5. CPX 96 98.8. TNZ 96.25 100.25. Table No. 03: Results for recovery studies Drug in Tablet(µg/ml). Level of Recovery. Method. 50% 100% 150% 50% 100% 150%. A. B. Drug added (µg/ml). CPX. TZ. 5. 6. 5. 6. CPX 2.5 5 7.5 2.5 5 7.5. TZ 3 6 9 3 6 9. Drug Recovered (µg/ml) CPX 7.52 9.96 12.47 7.56 9.96 12.43. TZ 9.02 11.92 14.96 9.06 11.94 14.94. % Recovery±R.S.D CPX 100.5±0.42 99.2±0.35 99.5±0.31 101.2±0.35 99.3±0.31 98.7±0.31. TZ 100.2±0.75 98.7±0.41 99.3±0.29 101.1±0.41 99.1±0.41 98.9±0.66. Table No. 04: Results for precision studies Concentration (µg/ml). Absorbance. Method. CPX CPX. TZ. 2 2. 4 4. A B. Intra day 0.264 0.264. TZ Inter day 0.266 0.266. References 1. 2.. 3.. 4.. 5.. 6.. 7. 8.. %RSD. http://en.wikipedia.org/wiki/Ciprofloxacin Alvarez-Lueje A, Lopez C, Nunez-Vergara LJ, Squella JA (2001)Volta metric behaviour and analytical application oflomefloxacin, an antibacterial fluroquinalone. J AOACInst 84: 649-658. Carmine AA, Brogden RN, Heel RC etal. Tinidazole in anaerobic infections: a review of its antibacterial activity, pharmacological properties and therapeutic efficacy. Drugs.1982; 24:85-117. The Indian Pharmacopoeia, Vol. II, Government of India. Delhi: The Controller of Publications; 2010; 1090. The United States Pharmacopoeia, USP 32, NF 27, Vol. 2. Rockville, MD: The United States Pharmacopoeia Convention, Inc; 2009; 1939. British Pharmacopoeia, Vol.I, Stationary Office. London: Medicines and Healthcare Products Regulatory Agency; 2010; 510. http://www.uspbpep.com/usp32/pub/data/v322 70/usp32nf27s0_m83700.html http://bp2012.infostar.com.cn/Bp2012.aspx?a= query&title=%22Tinidazole%22&tab=az+inde x&l=T&xh=1. Intra day 0.237 0.213. CPX Inter day 0.235 0.215. 9.. Intra day 0.54 0.54. TZ Inter day 0.44 0.44. Intra day 0.71 0.63. Inter day 0.45 0.69. PavaniPadmaPriya.B, New Spectrophotometric Multicomponent Estimation of Ciprofloxacin and Tinidazole Tablets, International Journal of Chem Tech Research, 2013, 5(1), 42-46 10. Sowjanya Gummadi, Devi Thota, Sri Valli Varri, Pratyusha Vaddi, Venkata Lakshmi, Narasimha Seshagiri Rao Jillela, Development and Validation of UV Spectroscopic Methods for Simultaneous Estimation of Ciprofloxacin and Tinidazole in Tablet Formulation, International Current Pharmaceutical Journal 2012, 1(10), 317-321 11. Swapnil R Bhalerao, Ambadas R. Rote Application of UV Spectrophotometric Methods for Estimation of Ciprofloxacin and Tinidazole in Combined tablet dosage form. International Journal of Pharmacy and Pharmaceutical Sciences 2012, 4(3): 464-467. 12. Umadevi Kothapalli, Kothakota Vandana, Arun Kumar Dash, T.Siva Kishore, Loya Harika, Kishanta Kumar Pradhan. A Validated UV-Spectrophotometric Method for the Estimation of Tinidazole in Bulk and Pharmaceutical Dosage Form. International Journal of Pharmaceutical and Biological Archives 2011, 2(4): 1152-1156.. www.ijpir.com.
(6) 300. Prathyusha V. et al., Int. J. Pharm & Ind. Res., Vol.–03 (03) 2013 [295 - 300]. 13. Sneha Jhansari K, Nirav Patel B, Parag Patel R, Nikita Patel N, Hemant Desai T Development and Validation of stability indicating Method for Simultaneous Estimation of Ciprofloxacin HCl and Tinidazole using RP-HPLC Method. IOSR Journal of Pharmacy 2012, 2(5): 12-19. 14. J.Dharuman, M.Vasudevan, K.N.Somasekaran, B.Dhandapani, Prashant D.Ghode and M.Thaigarajan. RP-HPLC Method Development and Validation for the Simultaneous Estimation of Ofloxacin and Tinidazole in Tablets. International Journal of Pharma Chem Research 2009, 1(2): 121-124. 15. Satish A Patel. Development and Validation of RP-HPLC Method for Simultaneous Determination of Ciprofloxacin and Ornidazole in Tablets. International Journal of Current Pharmaceutical Research 2011, 3(4): 72-75.. 16. El-Walily AF, Belal SF, Bakry RS. Spectrophotometric and spectrofluorimetric estimation of Ciprofloxacin and norfloxacin by ternary complex formation with eosin And palladium (II). J Pharm Biomed Anal 1996; 14(5): 561-569. 17. Salvi V S, Sathe P A, Rege P E, Determination of Tinidazole and Ciprofloxacin Hydrochloride in single formulation tablet using Differential Pulse Polarography, Journal of Analytical and Bio analytical Techniques. 18. Beckett, A.H Stenlake, J.B (2005) Practical pharmaceutical chemistry, (4th ed., part II, pp.286) CBS publishers, New Delhi. 19. ICH guidelines, Validation of Analytical procedures: Text and Methodology, Q2A (R1) Nov 2005. 20. Malhotra D, Kalia A, Tomar S. Validated UV spectroscopic method for simultaneous estimation of azithromycin and prednisolone Int Journal of Pharm Sci. 2011; 3(4):299-302.. www.ijpir.com.
(7)
Figure

Related documents
Changes in taxonomic composition and abundance indicate that the sandy-bottom benthos at 70-80 m depth at the East Flower Garden bank is food- limited and that,
The present study was conducted among antenatal women to determine their preference, if any, for male child and their awareness regarding technology and legality
In this present work an attempt has been made to synthesise nanosized iron oxide particles from three different iron chelates by thermal decomposition method.. The
Aim/Objective: To assess the diagnostic performance of TrueHb ® point-of-care (POC) hemometer compared with Sysmex i3 analyzer at International Hospital Kampala, Uganda.. Materials
The development of the Track and Connect program from this inception included the initial application of an academic buoyancy tool, the Motivation and Engagement Scale,
AGDL: Agglomerative clustering on a directed graph; AGMFit: Affiliation graph model fitting; CD: Community discovery; CDlib: Community discovery library; CDTB: Community
attenuated virus, as it is clear from the tissue culture studies that this virus replicates well; direct comparisons in which the two isolates are used to infect a compatible cell
This study was conducted to examine the difference in shape of male and female upper and lower dental arches, as well as the difference in their transversal and longitu- dinal
