Sensory Dissonance feature extraction:
a case study
Anna Terzaroli
Conservatorio Santa Cecilia, Rome, Italy Dept. of Composition and Conducting
Abstract
An audio feature can become relevant as a musical feature. This paper focuses on the “Sensory Dissonance” audio feature and its use as a musical parameter useful to analyze and compose music of all genres. It is possible by developing a software tool able to detect the presence of dissonance understood as Sensory Dissonance, to quantify the dissonance and then to draw a graphic function of the traced dissonance. This function is placed under the sound which it relates, while the music signal may be written according to the western notation system. The obtained curve does not only provide information concerning the degree of dissonance: it also allows a deeper reading of the entire analyzed musical work.
1
Introduction
Combining the practice of digitalization with the Sound enabled the possibility of handling large amounts of data related to audio.
Semantic Audio concerns the extraction of symbols and meaning from an audio stream and identifying a piece of music, given a fragment of that. Some search engines available on the web platform, as well as some websites allow you to search a sound by typing a characteristic or a word related to a characteristic belonging to the sound you are looking for, such as rhythm, noise, dance etcetera.
How is it possible? All the sounds are analyzed and their “audio features” (Smith, 2011) are extracted. Thus these audio features become tags of the sound from which they originate. Within Music Information Retrieval, many algorithms, audio libraries and software have been developed in order to extract the audio features (Serra, Smith, 1990 and Tzanetakis, Cook, 2000).
However an audio feature, the “basic unit” in theSemantic Audio field, can become relevant as a musicalfeature too. This research focuses on the “SensoryDissonance” audio feature and its use as a musicalparameter useful to analyze and compose music of allgenres. The Sensory Dissonance is a term introduced by Helmholtz in 1877 to indicate the perceived dissonance, connected to those “sensory factors” which Helmholtz was the first to study. In the 19th century, Hermann von
Volume 1, 2019, Pages 52–59
KLG 2017. klingt gut! 2017 – in-ternational Symposium on Sound
Helmholtz’s ”On the Sensations of Tone” introduced the ear as a spectral analyzer. Helmholtz’s writings assumed that all listeners judged dissonance the same way (Helmholtz, 1885 and Helmholtz 1863).
Psychoacoustics, the study of subjective human perception of sound, greatly evolves in the 20th century.
Harvey Fletcher (Fletcher, 1953) linked frequency-place coordinates of the Békésy cochlear map (Békésy, 1960) - continuing and improving the Helmholtz’s intuition - to experimental data from frequency discrimination and masking experiments. Harvey Fletcher showed that there is a close correspondence between distances along the basilar membrane and regions of masking. In pursuing this research, Fletcher defined a hypothetical entity dubbed critical band to denote frequency-domain regions of roughly equivalent or proportional behavior.
Donald D. Greenwood (Greenwood, 1961) extended Fletcher’s work by comparing psychoacoustic measures of critical bandwidth with the frequency position coordinates of the Békésy-Skarstein cochlear map. Furthermore, Greenwood showed that Mayer’s data correspond almost precisely with changes of critical bandwidth with respect to frequency. Mayer had collected experimental data (1894) where listeners were instructed to identify the smallest possible interval free of roughness or dissonance. This interval is not constant with respect to log frequency as implied in traditional music theory.
Plomp and Levelt (Plomp, Levelt, 1965) extended Greenwood’s work linking the perception of ”tonal consonance” to the critical band and hence to the mechanics of the basilar membrane. In the last century, the experiments on the determination of the critical band were many and have led, among other results, to the adoption of a particular scale of the critical band measurement, called the Bark scale, covering the frequency portion of the spectrum audible by humans. All theories about dissonance that have occurred over the years can be included in these main groups: Acoustic theories started by Pythagoras, Psychophysical theories based on psychophysiological aspects of the auditory system, such as the influence of the basilar membrane. Furthermore, there are the Cognitive theories and the Enculturation theories.
2
Methods
This research investigates the possibility of realization of a software written in the Ruby programming language that, given a score, or a fragment of the score, is able to detect the presence of dissonance understood as Sensory Dissonance, to quantify the dissonance and then to draw a plot of the traced dissonance. The tool is constructed from the Sensory Dissonance model in Essentia 2.0 library (Bogdanov, Wack, Gomez, et al., 2013)*. Sensory Dissonance in Essentia is considered a MIR (Music Information Retrieval) descriptor and a spectral descriptor as stated in the documentation. Within Essentia, the Sensory Dissonance is defined as:
This algorithm calculates the Sensory Dissonance (to distinguish from musical or theoretical dissonance) of an audio signal given its spectral peaks. Sensory Dissonance measures perceptual roughness of the sound and is based on the roughness of its spectral peaks. Given the spectral peaks, the algorithm estimates the total dissonance by summing up the dissonance normalized values for each pair of peaks. These values are computed using dissonance curves, which define dissonance between two spectral peaks according to their frequency and amplitude relations. The dissonance curves are based on perceptual experiments conducted in (1). Exceptions are thrown
*Essentia 2.0 is an open-source C++ library for audio analysis and audio-based music information retrieval, released under the
Affero GPL license.
when the size of the input vectors are not equal or if the input frequencies are not ordered ascendantly.
where (1) is referred to (Plomp, Levelt, 1965).
Since we have chosen to use the Ruby language for the construction of the d_plot tool (the Sensory Dissonance tracing software) we focus on the only tool that uses this language: MARSYAS, developed by George Tzanetakis (Tzanetakis, Cook, 2000). However, the MARSYAS tool is originally written in C++; a ruby binding exists, generated through the SWIG tool, but it does not feature an implementation of the calculation of the SD.
Thus, the MARSYAS tool was deemed not fit to the purpose of this work. Given the relative ease of binding Java libraries in Ruby, some other tools were taken into account: tools that are written in Java or those that, despite being written in another language, already have a binding in Java. For example, the tool jAudio/jMIR. But also this tool does not feature the SD calculation. This research considered also the only other tool that is written in Java: libXtract. Unfortunately this tool does not provide a SD calculation algorithm.
The PureData and the Max/MSP environments feature a dissonance model. However, the SD is identified with the roughness. In SuperCollider there is an implementation of the calculation of the SD through the Dissonance class. Thus, the choice of the proper SD algorithm to be linked to d_plot reduces to two possible working environments: the Essentia library and SuperCollider. From a comparison between the two, it was possible to note that the calculation of the SuperCollider SD does not follow the Plomp-Levelt model of critical bandwidth, which the author of this research deems to be the most precise approximation to date. Therefore, the choice reduced itself in the end to the Essentia SD model.
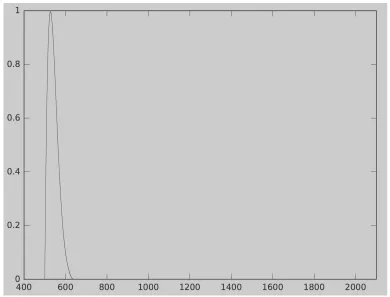
Figure 1:Dissonance curve used in Essentia 2.0 (Octave plot)
3 Operating mechanism
Three different files are the input of d_plot: the first file is a XML file, the second file is in txt format and the third file is in mp3 format (or any other audio format).
d_plot outputs a file that is a plot. This term indicates a representation, through a graph, of the dissonance detected by the tool, on the basis of the input data. The XML format is the abbreviation for Extensible Markup Language. In fact XML format allows the structural and semantic representation of the information. Files that are in this extension therefore contain information and data, written in standard ASCII text.
XML is an extensible language because its tags (unlike, for example, in the HTML language) are not limited. XML is, finally, a marker descriptive type of language (and not procedural): the readability of the information is more important than their representation and readability and representation are kept separately.
The XML subset used in this specific case is MusicXML, a standard for sharing scores that can be imported by many notational software and others.
MusicXML is a specific XML encoding with which the Western classical notation can be represented. Developed by Recordare LLC, it is released as a open format with a variant of the GNU
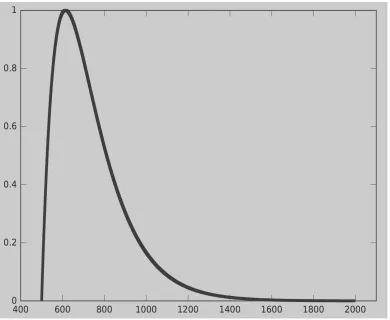
Figure 2:Dissonance curve used in Supercollider (Octave plot)
GPL license, the MusicXML public license. Thanks to the file in XML format, d_plot takes the score as input.
The txt file provides d_plot a list in text format that features the physical audio start and end points of each measure in the analyzed score.
Mp3 (Moving Picture Experts Group-1/2 Audio Layer 3, also known as MPEG-1 Audio Layer III and MPEG-2 Audio Layer III) is an audio compression lossy algorithm developed in the late 90’s by the MPEG group, able to drastically reduce the amount of data required to store a sound, while remaining an acceptably faithful reproduction of the original uncompressed file.
The audio file reader allows d_plot to analyze a physical audio signal. Analyzing the physical counterpart of the score (that is, the audio file) is an important point because the dissonance type taken into consideration here, the Sensory Dissonance, is mainly based on the perception of played and listened music.
The output file consists of a graph of Sensory Dissonance, detected from the audio signal and representable, measure by measure, thanks to the MusicXML file and text file. Considering a notation that does not involve the use of measures, a further development of d_plot can be implemented representing the Sensory Dissonance graph, line by line.
This is essentially a plot in which the time axis is scaled from measure to measure according to the actual graphic distance present in the score, so that the plot can augment the score directly with the Sensory Dissonance information. It is a well known fact that scores adjust the width of each measure according to a considerable number of factors (note density, number of voices, page turns, etc.) so this implies that the plotting system must take the measure spacing into consideration when mapping between time and space. d_plot consists, inside, of three readers (for the three input files) and of an aggregator which collects all the data coming from the input and makes sense out of it. From the moment d_plot receives the input files, the implementation involves the following steps: concerning the audio, the audio file is loaded, reduced to mono and/or resampled if necessary.
It is divided into frames and it is windowed using Hamming window. Then the FFT of each frame is calculated and its spectral peaks are detected. The outputs of these operation are two vectors, the frequencies and their magnitudes. These two vectors are then fed into the dissonance algorithm. The dissonance algorithm returns one single value of dissonance for each frame.
Since the MusicXML files feature a measure width in pixels along with a scaling factor, their measures are saved into the aggregator already converted in millimeters. In the labeling txt file the measures are described by their time position in the audio file.
The aggregator algorithm considers each measure and, among all values of dissonance, it considers only those values included in each measure. A time/space conversion is operated, that is, every time label is positioned in a space calculated according to the width of each measure.
The time axis is not the same for every measure, the time/space ratio is not always the same. The values of dissonance mapped in space are fed to the pic software through an output driver. Pic draws the curves in the provided space. These curves are spline functions. In mathematical analysis, a spline is a function, constituted by a set of polynomials connected each other, the purpose of which is to interpolate an interval in a set of points (called nodes of the spline), in such a way that the function is continuous at least up to a given order of derivative in every point of the interval. Pic is a preprocessor for the Troff typesetting system, through which it is possible to obtain images from a text description. The original pic program was written by Brian Kernighan, as a complement to the Troff software by Joseph Ossanna; it was subsequently rewritten by Kernighan, with substantial improvements. The language takes its inspiration from the older graphical languages such as Ideal and Grap. All the code of the d_plot tool is available at www.github.com/aterza/d_ plot.
4
Conclusions
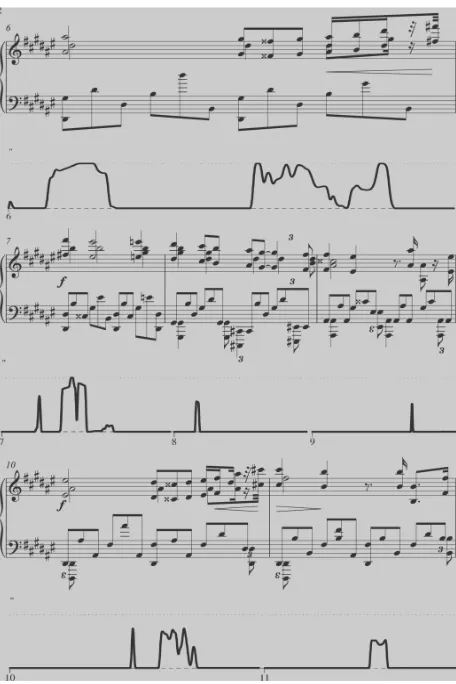
d_plot produces a graphic function according to audio (and .xml and .txt files related to audio) Figure 3:Chamber Symphony Op.9, No.1 - plot
Figure 4:Etude Op.8, No.12 (an extract) - plot
received as input.
The x values represent the measure number, the y values indicate the degree of dissonance. The obtained function is continuous in time. The graphic function of dissonance can be placed under the sound which it relates and the music signal may be written according to the western notation system, which uses, in this case, the measures. The obtained curve does not only provide information concerning the degree of dissonance: it also allows a deeper reading of the entire musical work that is analyzed by the d_plot tool. In fact by inspecting the curve, repetitions of function portions may be noticed.
The latter case would mean that there are parts of the analyzed music that are equal or very similar concerning the dissonance factor, while their musical content might be considerably different. Thus, it might be interesting to compare similar sections according to the dissonance parameter and observe if they are different or even equal in terms of other parameters.
For example, a strong similarity from the dissonance content point of view may be found, as opposed to an almost total difference from the tonal content point of view or from the use of meter or from the use of the registers point of view. The opposite case may also occur. In contrast, the similarity or non similarity of the degree of dissonance may be consistent with the values of other musical parameters.
Knowing this information, the authors compositional mode can be better understood.
The musical material for the first practical application of the d_plot tool is a selection of measures from the Chamber Symphony Op.9, No.1 by Arnold Schoenberg. Performed for the first time in 1907, this work represents a moment of transition in the history of music. While it moves even within the constraints of Romanticism, at the same time it tries to break free from tradition. Right from the start, the tonality is strongly attenuated by a melodic movement free of semitones and by a succession of fourth intervals. Figure 3 shows the piano arrangement of Schoenberg's piece, the SD plot below refers to the piece played by the ensemble originally intended by the author. A fairly precise alternation between dissonance and consonance seems to characterize the opening bars of the Chamber Symphony.
It’s interesting to note that the same level of consonance, indicated in the plot with the black line on the bottom of the graph, is not caused by the use of the same notes or by the use of the same chords.
Similarly, the dissonance peaks that are repeated almost with a certain order are not caused by the same notes or chords. The information provided by d_plot thus represents an addition to what is reported in the traditional score. Another selection of fragments that will be submitted to the analysis of the dissonance made by d_plot comes from Etude Op. 8, No. 12 by Aleksandr Skrjabin. Unlike the Schoenberg's material, the tonal harmony is here fully respected.
Figure 4 shows the score and the relative dissonance plot by d_plot concerning Skrjabins Op.8, No.12. The plot shows how the dissonance increases in the cadential points. This is a coherent information with what could be expected, knowing the musical works reference style. However, the plot returns the information in a more direct and simple way through a visual plot.
Moreover, it is very important that the graph also provides a quantification of the dissonance, so that how much dissonance is present in every cadential point is made clear to the reader.
References
Bark-scale, https://ccrma.stanford.edu/~jos/bbt/Bark Frequency Scale.html. Békésy G., Experiments in Hearing. Graw Hill, 1960.
Bogdanov D., Wack N., and Gomez E., et al. ESSENTIA: an Open-Source Library for Sound and Music Analysis, in Proceedings of the 21st ACM international conference on Multimedia, 2013,
pp.855–858.
Cazden N., The definition of consonance and dissonance, in International Review of the Aesthetics and Sociology of Music, Vol.11, No.2, 1980, pp.123–168.
Essentia-documentation, http://essentia.upf.edu/documentation/algorithmsoverview.html. Fastl H., and Zwicker E., Psychoacoustics. Facts and Models. Berlin Heidelberg: Springer-Verlag, 1990.
Fletcher H., Effects of Filtering and Masking. Van Nostrand, 1953.
Greenwood D., Critical bandwidth and the frequency coordinates of the basilar membrane, in
Journal of the Acoustical Society of America, Vol.33, No.10, 1961, pp.1344–1356.
Helmholtz H. L. F., Die Lehre von den Tonempfindungen, als Physiologische Grundlage fur die
Theorie der Musik. Vieweg: Braunschweig, 1863.
Helmholtz H. L. F., On the sensations of tone as a physiological basis for the theory of music, New York: Dover, 1885.
Kernighan B. W., Pic - a graphics language for typesetting (revised user manual), in Bell Labs Computing Science Technical Report n.116, 1991.
Lundin R. W., Toward a cultural theory of consonance, in Journal of Psychology, Vol.23, 1947, pp.45–49.
Plomp R., and Levelt W. J. M., Tonal consonance and critical bandwidth, in Journal of the
AcousticalSociety of America, Vol. 38, 1965, pp.548–560.
Serra X., and Smith J., Spectral Modeling Synthesis: A Sound Analysis/Synthesis Based on a Deterministic plus Stochastic Decomposition, in Computer Music Journal Vol.14.4, 1990, pp.12-24.
Smith J., Spectral Audio Signal Processing, W3K, 2011.
Spline-curve, http://www.math.ucla.edu/~baker/149.1.02w/handouts/dd splines.pdf. Supercollider-dissonance,
http://github.com/supercollider/sc3-plugins/blob/936733929684441e36842a6a55796c5ddebdb774/ source/SCMIRUGen/SensoryDissonance.cpp.
Tzanetakis G., and Cook P., Marsyas: A framework for audio analysis, in Organised Sound
Vol.48, 2000, pp.169-175.