Factors Influencing the Simplified Quality
Model Performance
Jing Feng
1*, Congcong Sun
2, Gabriela Cembrano
2,3and Vicenç Puig
2 1 Polytech Nice Sophia 930, Route des Colles – BP145-06903 Sophia Antipolis Cedex, France2 Institut de Robòtica I Informàtica Industrial (CSIC-UPC), Barcelona 08028, Spain 3 CETaqua, Water Technology Centre, Barcelona 08028, Spain
Abstract
During the last few years, the integrated real-time control (RTC) of both the urban sewer network and the wastewater treatment plants (WWTP), has attracted increasingly attention. In order to apply integrated RTC control approach efficiently considering both the hydraulic and quality variables, models, simplified conceptual quality modelling approaches are required. This paper presents research work based on simplified water quality models in sewers, which have been developed in the European project LIFE EFFIDRAIN (Efficient Integrated Real-time Control in Urban Drainage and Wastewater Treatment Plants for Environmental Protection). The contribution of this paper is to analyze the potential factors that would influence the performance of the proposed modelling approach and consequently the corresponding integrated RTC control. A real sewer pilot the Perinot sewer network has been used as case study. Results and conclusions have been provided which would be useful for the users of these models.
1
Introduction
Combined urban drainage networks (CUDN) collect and convey wastewater and storm water together to be treated by waste water treatment plants (WWTP) before being released to the receiving environment (García, et al., 2015). In case of storm weather, the capacity of the urban sewer network and also the WWTPs may be overloaded, and combined sewer overflow (CSO) may happen, which is harmful to the environment (Joseph-Duran, Ocampo-Martínez, & Cembrano, 2014) (Gasperi, Garnaud, Rocher, & Moilleron, 2008) (Becouze, Bertrand-Krajewski, Dembélé, Cren-Olivé, & Coquery, 2009) (Butler & Schütze, 2005). In order to manage the CUDN efficiently, integrated control of both sewer network and WWTP is a suitable solution, which is the main goal of the European project LIFE
* Masterminded EasyChair and created the first stable version of this document
Engineering
Volume 3, 2018, Pages 706–714
EFFIDRAIN (Efficient Integrated Real-time Control in Urban Drainage and Wastewater Treatment Plants for Environmental Protection), to demonstrate an integrated RTC strategy of urban drainage networks and wastewater treatment plants to minimize the pollution of receiving waters, through the use of real-time quantity and quality data.
The complexity of quality dynamics in CUDN requires simplified quality models to apply RTC (Cembrano, et al., 2004), which should allow RTC to compute estimations of the quality evolution in CUDN during storm event (Ahyerre, Chebbo, Tassin, & Gaume, 1998). Because of the input data uncertainty and calibration difficulty, modelling the generation and transportation of pollution in sewer network during a storm event is complex. Some physically-based models which can present quality dynamics in the sewer network are proposed (van Rijn, 1984) (Rouse, 1937) (Ackers & White, 1973), but the mathematical equations have a high computation time requirement. Total suspended solids (TSS) are chosen in (Sun, et al., 2017, July) as a representative variable of water quality, and three simplified conceptual sewer models of TSS are proposed to represent the main dynamics of TSS with simple equations suitable for RTC optimization.
This paper is a further research work based on the simplified sewer models of TSS proposed in (Sun, et al., 2017, July) to analyse factors influencing performance of the proposed simplified TSS models which is necessary for improving the models and achieving better efficiency in the RTC optimizations. In order to test these simplified dynamic models for TSS, two possible factors, rain intensity and sewer length, are supposed very likely to affect the model performance. A series of tests are carried out to seek for the potential relationships among them. On the other hand, flow rate and TSS are normally considered as the main variables to integrate the hydraulics of sewers and WWTP. On the other hand, to better understand the whole dynamic behaviour in CUDN, this paper also tries to find the underlying relationship between flow rate and TSS behaviour.
1.1
Simplified Dynamic Models for TSS
Physically, the dynamic of TSS in a sewer is affected by deposition, sedimentation, erosion and also time delays. Based on the hydraulic model of a water tank (Ahyerre, Chebbo, Tassin, & Gaume, 1998), a sewer trunk in CUDN can be assumed as a water tank container which collects water based on volumetric difference between upstream and downstream (Ahyerre, Chebbo, Tassin, & Gaume, 1998) (Puig, et al., 2009) flows. Considering the TSS, three dynamic models to represent TSS behaviour are designed based on the water tank model, where the details can be referred in (Sun, et al., 2017, July) and the general equations can be presented as follows:
Model 1
)
(
)
(
)
1
(
)
1
(
k
a
TSS
k
aTSS
k
TSS
out
out
in (1)Model 2
)
(
)
(
)
1
(
k
a
1TSS
k
a
2TSS
kk
TSS
out
out
in (2)Model 3
ep
d
k
TSS
c
k
TSS
out(
1
)
vc in(
)
(3)2
Material and Methods
2.1 Analysis tools
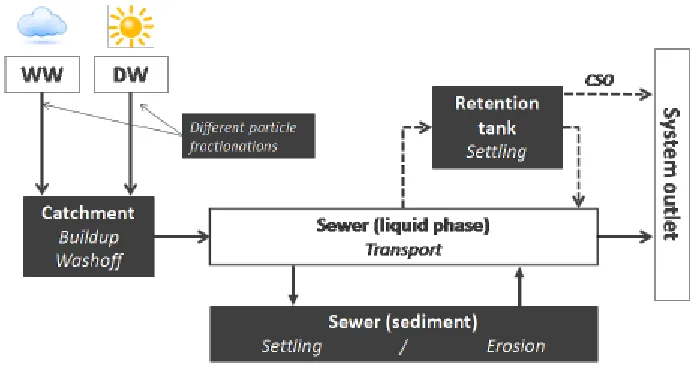
The tools used for producing the training data and analysing the performance are based on SWMM5 (Rossman, 2015), Matlab and GAMS optimization software (Richard, 2016). In particular, for quality modelling, a new quality model based on SWMM5 has been developed in LyRE (R+D centre of Suez) to reproduce TSS transport, sediment accumulation and erosion in sewers (Wiuff, 1985) and retention tanks (Maruéjouls, Vanrolleghem, Pelletier, & Lessard, 2012), as shown in Figure 1. This quality model uses the extended Barre de Saint Venant equation set from SWMM5.
Figure 1 presents the scheme illustrating the modifications made in the SWMM5 library model. Boxes correspond to the existing modules in SWMM5 and grey boxes are for added quality module. WW and DW represent wet and dry weather.
Figure 1: New Strucure of Quality Module SWMM-TSS
2.2
Pre-treatment of Case Study
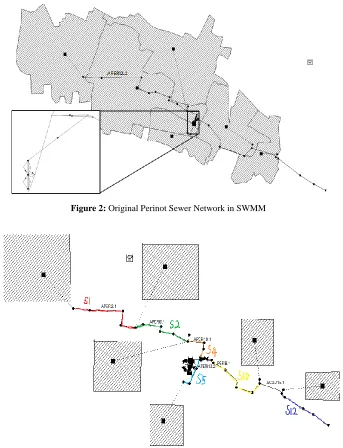
The case study is the Perinot sewer network in Louis Fargue catchment of Bordeaux Metropole (Figure 2), which covers a total area of 260 ha with mainly residential uses. In Perinot sewer network, the sewer length is 3 km with an average slope of 0.007, which is quite constant over the whole catchment. The Perinot sewer network includes a retention tank separated in three hydraulically connected bodies for a total storage volume of 35000 m3. Even if the slope is generally low, there is no sediment issues on the
2.3
Rain Scenarios
Rain scenarios for calibration and validation come from real rainfall measured at France in the year
Figure 2: Original Perinot Sewer Network in SWMM
Figure 4: Rain Scenario of Perinot in the year of 2007
Table 1 Relationship between sewer length and model performance
Scenario
1 2 3 4
Start time Oct/10/2007 00:00 Dec/02/2007 00:00 Feb/10/2007 00:00 Jul/08/2007 00:00 Scenario
5 6 7 8
Start time Aug/19/2003 23:05 Aug/02/2013 09:00 Jan/03/2011 10:00 Jan/03/2011 10:00 Duration
24h Time step 5 min
2.4
Model Calibration and Validation
The calibration is carried out using SWMM5, Matlab and the GAMS optimization library. Besides, the new quality model based on SWMM5 developed at LyRE is used to produce the training data (Wiuff, 1985).
As in Table 2, rain scenarios 1, 2, 5 and 7 will be used for calibration. After calibrating all the models, rain scenario 3, 4, 6 and 8 will validate the calibration models.
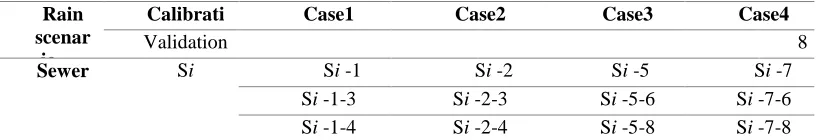
Table 2 Test Arrangement
Rain scenar
io
Calibrati on
Case1 Case2 Case3 Case4
Validation 3 4 3 4 6 8 6 8
Sewer Si Si -1 Si -2 Si -5 Si -7 Si -1-3 Si -2-3 Si -5-6 Si -7-6 Si -1-4 Si -2-4 Si -5-8 Si -7-8
3
Results
3.1
Relationship between sewer length and model performance
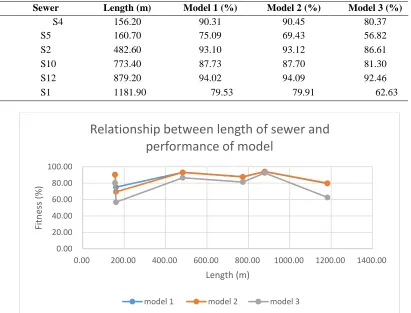
Table 3 and Figure 5 show the relationship between length of sewer and model performance. It seems that all three models present a similar tendency changing the sewer lengths. However, the performance of model 3 changes more dramatically than model 1 and 2.
Table 4 shows how sewer length affects the parameters of model 3. Sewer 5 and 10 perform worse with lower value of 𝒄𝒗𝒄but much higher 𝑒𝑝. Model 3 is generalized from the physical characteristics
in a sewer, where the dynamic of TSS is affected by the flow rate and time delays. Therefore, it seems to make sense that, to some extent, the length of sewer has an impact on the performance of model 3.
In conclusion, the length of sewer is more likely to influence the performance of model 3, compared to the other two models. But in general, model 1 and 2 seem to be good choices for sewers which length ranges from 400m to 900m.
Table 3 Relationship between sewer length and model performance
Sewer Length (m) Model 1 (%) Model 2 (%) Model 3 (%)
S4 156.20 90.31 90.45 80.37
S5 160.70 75.09 69.43 56.82
S2 482.60 93.10 93.12 86.61
S10 773.40 87.73 87.70 81.30
S12 879.20 94.02 94.09 92.46
S1 1181.90 79.53 79.91 62.63
Figure 5: Relationship between sewer length and model performance
0.00 20.00 40.00 60.00 80.00 100.00
0.00 200.00 400.00 600.00 800.00 1000.00 1200.00 1400.00
Fitn
es
s
(%
)
Length (m)
Relationship between length of sewer and
performance of model
Sewer Length (m) cvc ep Model 3 (%)
S4 156.20
0.96
10.35
80.37S5 160.70
0.71
47.53
56.82S2 482.60
0.97
9.65
86.61S10 773.40
0.95
19.02
81.30S12 879.20
0.97
11.74
92.46S1 1181.90
0.73
86.04
62.633.2
Relationship between rain intensity and model performance
Table 6 shows relationship between rain intensity and model performance. As in Table 5, rainfall scenario 1 and 2 can be regarded as light rain, while scenario 5 and 7 is heavy rain. It seems that, with the increase of rainfall intensity, 𝑎 decreases for Model 1; a1 increases while a2decreases for Model 2;
cvc decreases while epincreases for Model 3. Overall, there is a tendency that the heavier rainfall is, the
worse models will be.
Table 5 Information of rainfall scenarios in calibration
Rainfall for Calibration
Total Depth of 24h(mm)
Intensity(m m/h)
Maximum Depth (mm)
1 5.53 0.23 0.04
2 0.25 0.01 0.06
5 1754.61 73.11 19.05
7 1667.78 69.49 45.71
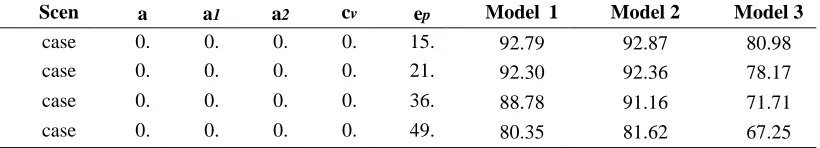
Table 6 Relationship between rain intensity and model performance in calibration
Scen ario
a a1 a2 cv
c
ep Model 1
(%) Model 2 (%) Model 3 (%) case 1 0. 47 0. 48 0. 47 0. 89 15. 66
92.79 92.87 80.98 case 2 0. 46 0. 54 0. 46 0. 92 21. 07
92.30 92.36 78.17 case 3 0. 35 0. 65 0. 35 0. 88 36. 30
88.78 91.16 71.71 case 4 0. 42 0. 58 0. 42 0. 84 49. 86
80.35 81.62 67.25
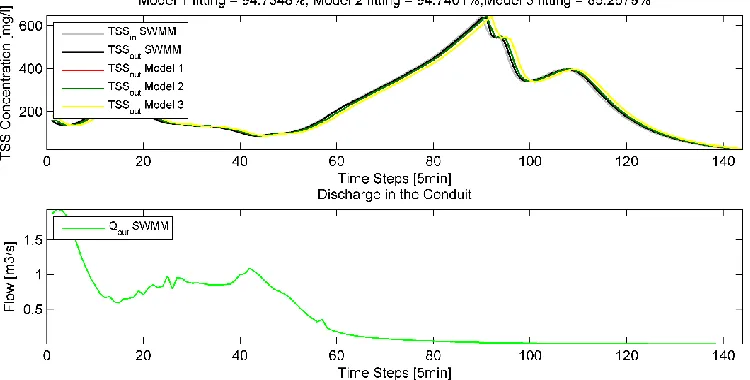
3.3
Relationship between flow rate and concentration of TSS out of a
sewer
Figure 6: Flow rate and TSS behaviour out of Sewer 1
4
Conclusions
According to these calibrations and analyses, the sewer length is more likely to influence model 3 comparing to other two models. In general, model 1 and 2 seem to be good choices for sewers with length ranges from 400m to 900m. Also, there is a tendency that the heavier rainfall is, the worse models will be. But the model 1 and model 2 always perform better than model 3, no matter what the rainfall intensity is.
From Table 4 and Table 6, it may be concluded that it is better to have larger parameters a, a2, cvc
and smaller a2, ep for models to perform better when there is lack of rainfall data for calibration. Besides,
the trend of discharge is likely to be opposite to the trend of TSS in a sewer, which can be explained that flow with large velocity takes away more TSS.
Acknowledgment
The authors wish to thank the support received by the European Commission research grant of project LIFE EFFIDRAIN (LIFE14 ENV/ES/000860), also thank the support from Spanish national project DEOCS (DPI2016-76493-C3-3-R). The authors also want to thank Bordeaux Metropole and Aigües de Barcelona for the financial and technical support. This work is also supported by the Spanish State Research Agency through the María de Maeztu Seal of Excellence to IRI (MDM-2016-0656).
References
Becouze, C., Bertrand-Krajewski, J. -L., Dembélé, A., Cren-Olivé, & Coquery, M. (2009). Preliminary assessment of fluxes of priority pollutants in stormwater discharges in two urban catchments in Lyon. 13th of IWA intern. confer. on Diffuse Pollu. and Integ. Waters. Manage. Seoul: South Korea.
Butler, D., & Schütze, M. (2005). Integrating simulation models with a view to optimal control of urban wastewater systems. J. Environ. Modell. and Softw., 20(4), 415-426.
Cembrano, G., Quevedo, J., Salamero, M., Puig, V., Figueras, J., & Martí, J. (2004). Optimal control of urban drainage systems. A case study. J. Contr. Engin. Pract., 12(1), 1-9.
García, L., Barreiro-Gomez, J., Escobar, E., Téllez, D., Quijano, N., & Ocampo-Martínez. (2015). Modelling and real-time control of urban drainage systems: A review. Advances in Water Resources, 85: 120-132.
Gasperi, J., Garnaud, S., Rocher, V., & Moilleron, R. (2008). Priority pollutants in wastewater and combined sewer overflow. J. Scien. of the Tot. Environ, 263-272.
Joseph-Duran, B., Ocampo-Martínez, C., & Cembrano, G. (2014). Hybrid modelling and receding horizon control of sewer network. Water Resources Research, 263-272.
Maruéjouls, T., Vanrolleghem, P., Pelletier, G., & Lessard, P. (2012). A phenomenological retention tank model using settling velocity distributions. J. Wat. Res., 46, 6857-6867.
Puig, V., Cembrano, G., Romera, J., Quevedo, J., Aznar, B. R., & Cabot, J. (2009). Predictive optimal control of sewer networks using CORAL tool: application to Riera Blanca Catchment in Barcelona. Water science & Technology, 60(4), 869-878.
Richard, E. (2016). GAMS - A Users' Guide. Washington, DC, USA: GAMS Develop. Corpor. Rossman, L. (2015). Storm Water Management Model Users' Manual Version 5.1. USA: Envir. Prot.
Agn.
Rouse, H. (1937). Nomogram for the settling velocity of spheres. J. Comm. on Sedim., 57-64.
Sun, C., Joseph-Duran, B., Maruejouls, T., Cembrano, G., Meseguer, J., Puig, V., & Litrico, X. (2017, July). Real-time control-oriented quality modelling in combined urban drainage networks.
IFAC 2017 World Congress, (pp. 4002-4007). Toulouse, France.
van Rijn, L. (1984). Sediment transport, part II: suspended load transport. J. Hydra. Engine., 110(11), 1613-1641.