I
IJJMMCCMM Original Article A
Auuttuummnn22001133,,VVooll22,,NNoo44
Functional motifs in Escherichia coli NC101
Gholamreza Motalleb∗
Department of Biology, University of Zabol, Zabol, Iran.
Escherichia coli (E. coli) bacteria can damage DNA of the gut lining cells and may encourage the development
of colon cancer according to recent reports. Genetic switches are specific sequence motifs and many of them are
drug targets. It is interesting to know motifs and their location in sequences. At the present study, Gibbs sampler
algorithm was used in order to predict and find functional motifs in E. coli NC101 contig 1. The whole genomic
sequence of Escherichia coli NC101 contig 1 were retrieved from http://www.ncbi.nlm.nih.gov (NCBI
Reference sequence: NZ_AEFA01000001.1) in order to be analyzed with DAMBE software and BLAST. The
results showed that the 6-mer motif is CUGGAA in most sequences (genes1-3, 8, 9, 12, 14-18, 20-23, 25, 27, 29,
31-34), CUUGUA for gene 4 , CUGUAA for gene 5, CUGAUG for gene 6, CUGAUA for gene7, CUGAAA for
genes 10, 11, 13, 26, 28, and CUGGAG for gene 19, and CUGGUA for gene30 in E. coli NC101 contig 1. It is
concluded that the 6-mer motif is CUGGAA in most sequences in E. coli NC101 contig1. The present study may
help experimental studies on elucidating the pharmacological and phylogenic functions of the motifs in E. coli.
Key words: Escherichia coli, functional motifs, gene expression
∗
Corresponding author: Department of Biology, University of Zabol, Zabol, Iran. Email: reza.motaleb @uoz.ac.ir ; [email protected]
nfection of eukaryotic cells with pks+ E. coli
strains induces host-cell DNA double strand
breaks (DSBs) and activation of the DNA damage
signaling cascade, including the ATM–CHK–
CDC25–CDK1 pathway and Ser139
phospho-rylation of histone H2AX (1). A genome can assure
cells life whenever its encoded genes are activated
or inactivated during molecular and cellular
changes in order to answer to environmental factors
and production of various RNA and proteins on
time and correct place (2). The aim of motif
discovery is to find patterns in protein or nucleotide
sequences to understand the function and structure
of the molecules the sequences represent (3). Motif
extraction of MLA or multiple local alignments is
often used to determine DNA sites that are
distinguished by TF or transcription factors. This is
based on the assumption that DNA sequences
upstream of coregulated genes contain similar
nucleotide subsequences (4). Genetic switches are
specific sequence motifs and many of them are drug
targets (5). These contain intron branching-point
site, transcription factor binding sites,
intron-splicing sites, etc. Gibbs sampler is a Monte Carlo
algorithm used in order to find these motifs (5).
Monte Carlo algorithm method was created by
I
Submmited 14 Aug 2013; Accepted 30 Sep 2013
Stanislaw Ulam and developed by nuclear weapon
projects in USA (6). Gibbs sampler has been used
to identify functional motifs in proteins (7),
multiple sequence alignment (8), and biological
image processing (9). The main element of a Gibbs
sampler is position weight matrix or PWM. The
PWM scores or PWMS has been reported as a scale
of the motif strength (5). Escherichia coli are
anaerobic bacteria and the most common
population of bacteria in the intestinal flora of
human. E. coli can make colony in the intestine few
days after birth and permanently during human life.
Strains of E. coli can be categorized into four main
groups (A, B1, B2, and D) and B2 group can persist
in the colon longer than the others (10). It was
reported that E. coli strains of B2 phylotype (e.g. E.
coli NC101), carry a genomic pks island (a gene
cluster coding nonribosomal peptide synthetases or
NRPS and polyketide synthetases or PKS), produce
Colibactin (a peptide-polyketide genotoxin) that
can induce damage of DNA by double-strand
breaks (DSBs) (11) and may develop colon cancer
(12). In the present study, Gibbs sampler was used
to identify functional motifs by BLAST and
DAMBE software in order to distinguish motifs in
E. coli strain NC101 contig1.
Materials and Methods
This investigation was started in the spring of
2013 and the data analysis was performed at
bioinformatics facility of Faculty of Science
at Zabol University. Genome sequences of
E. coli NC101 (NCBI Reference sequence:
Z_AEFA01000001.1) were retrieved from
http://www.ncbi.nlm.nih.gov (NCBI Reference
sequence: NZ_AEFA01000001.1) to find branch
point sequence or BPS in E. coli NC101 contig1 by
DAMBE (5).
BLAST search of the E. coli NC101 genome
(accession NZ_AEFA00000000) confirmed the
presence of pks. PWM is computed as
(1).
Where i=1, 2, 3 and 4 corresponding to A, C, G and
U, respectively, and j is site index, and pi is the
background frequency of nucleotide i, and pij is the
site specific nucleotide frequency for nucleotide i at
site j. The PWMS for a particular motif is computed
as (2) where L is length of the
motif (5).
Results
Gibbs sampler was employed to find
functional motifs by DAMBE in order to identify
genetic motifs with Gibbs sampler in E. coli NC101
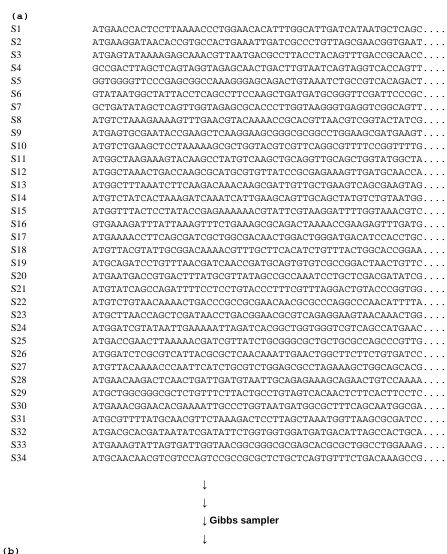
contig1. Figure 1 shows shared motif in an aligned
format in red color which is CUGGAA in most
sequences (Fig. 1b). The main Gibbs sampler
output is the sequences with aligned motifs as
shown in Figure 1b and a site-specific frequency
matrix (position weight matrix) presented in Table
1d respectively. Table 1a shows the total number of
nucleotides in the sequences. The total number of
nucleotides for 34 sequences is 31509, with 7622,
7977, 8879 and 7031 for A, C, G and U
respectively. The partial output (Table 1b and c)
showed that the 6-mer motif is CUGGAA. The
site-specific frequencies and PWM were shown in Table
1c and d in order to find and monitor other
sequences for the presence of such motifs. The last
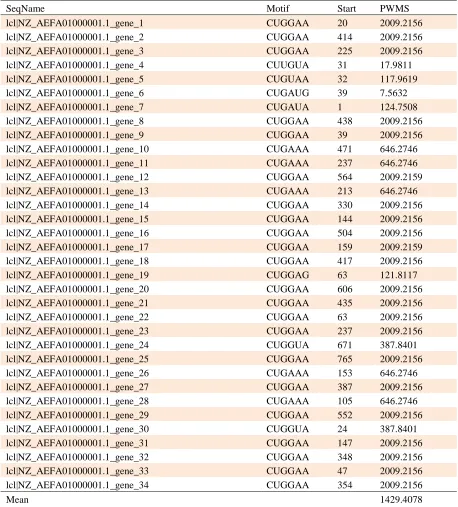
part of the results (Table 2) shows the motifs start
point. As shown again in Table 2, the 6-mer motif
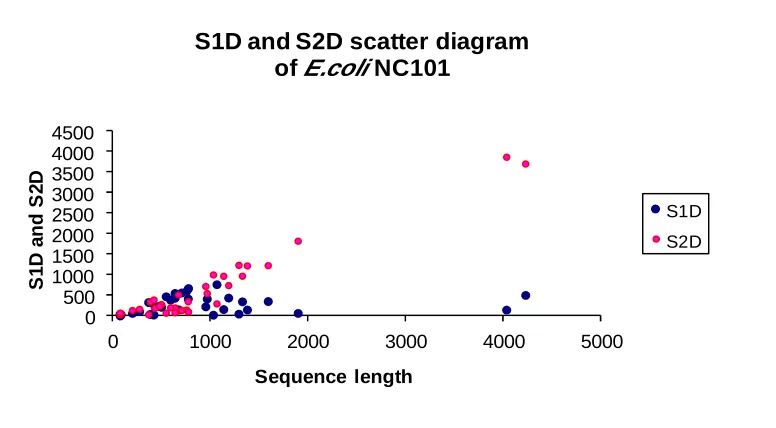
is CUGGAA in most sequences. Figure 2 shows the
scatter diagram of S1D and S2D with E. coli
NC101 contig1 sequences length.
Discussion
The finding of motifs in DNA sequences is a
central problem in computational molecular
biology, and through many computational methods,
Gibbs sampling algorithm is a great promise which
is used for finding functional motifs in the
co-expressed genes (13). Motif finding is becoming an
important toolbox for microbiologists likewise
other DNA and protein computational molecular
Fig 1. The sequences of E. coli NC101 contig1. The above panel represents the data input in Gibbs sampler (a). The below part represents
the output of the motifs (i.e.,CUGGAA; in red color) through the sequences (b). S1-S34 correspond to sequence 1 to sequence 34.
(a)
S1 ATGAACCACTCCTTAAAACCCTGGAACACATTTGGCATTGATCATAATGCTCAGC....
S2 ATGAAGGATAACACCGTGCCACTGAAATTGATCGCCCTGTTAGCGAACGGTGAAT....
S3 ATGAGTATAAAAGAGCAAACGTTAATGACGCCTTACCTACAGTTTGACCGCAACC....
S4 GCCGACTTAGCTCAGTAGGTAGAGCAACTGACTTGTAATCAGTAGGTCACCAGTT....
S5 GGTGGGGTTCCCGAGCGGCCAAAGGGAGCAGACTGTAAATCTGCCGTCACAGACT....
S6 GTATAATGGCTATTACCTCAGCCTTCCAAGCTGATGATGCGGGTTCGATTCCCGC....
S7 GCTGATATAGCTCAGTTGGTAGAGCGCACCCTTGGTAAGGGTGAGGTCGGCAGTT....
S8 ATGTCTAAAGAAAAGTTTGAACGTACAAAACCGCACGTTAACGTCGGTACTATCG....
S9 ATGAGTGCGAATACCGAAGCTCAAGGAAGCGGGCGCGGCCTGGAAGCGATGAAGT....
S10 ATGTCTGAAGCTCCTAAAAAGCGCTGGTACGTCGTTCAGGCGTTTTCCGGTTTTG....
S11 ATGGCTAAGAAAGTACAAGCCTATGTCAAGCTGCAGGTTGCAGCTGGTATGGCTA....
S12 ATGGCTAAACTGACCAAGCGCATGCGTGTTATCCGCGAGAAAGTTGATGCAACCA....
S13 ATGGCTTTAAATCTTCAAGACAAACAAGCGATTGTTGCTGAAGTCAGCGAAGTAG....
S14 ATGTCTATCACTAAAGATCAAATCATTGAAGCAGTTGCAGCTATGTCTGTAATGG....
S15 ATGGTTTACTCCTATACCGAGAAAAAACGTATTCGTAAGGATTTTGGTAAACGTC....
S16 GTGAAAGATTTATTAAAGTTTCTGAAAGCGCAGACTAAAACCGAAGAGTTTGATG....
S17 ATGAAAACCTTCAGCGATCGCTGGCGACAACTGGACTGGGATGACATCCACCTGC....
S18 ATGTTACGTATTGCGGACAAAACGTTTGCTTCACATCTGTTTACTGGCACCGGAA....
S19 ATGCAGATCCTGTTTAACGATCAACCGATGCAGTGTGTCGCCGGACTAACTGTTC....
S20 ATGAATGACCGTGACTTTATGCGTTATAGCCGCCAAATCCTGCTCGACGATATCG....
S21 ATGTATCAGCCAGATTTTCCTCCTGTACCCTTTCGTTTAGGACTGTACCCGGTGG....
S22 ATGTCTGTAACAAAACTGACCCGCCGCGAACAACGCGCCCAGGCCCAACATTTTA....
S23 ATGCTTAACCAGCTCGATAACCTGACGGAACGCGTCAGAGGAAGTAACAAACTGG....
S24 ATGGATCGTATAATTGAAAAATTAGATCACGGCTGGTGGGTCGTCAGCCATGAAC....
S25 ATGACCGAACTTAAAAACGATCGTTATCTGCGGGCGCTGCTGCGCCAGCCCGTTG....
S26 ATGGATCTCGCGTCATTACGCGCTCAACAAATTGAACTGGCTTCTTCTGTGATCC....
S27 ATGTTACAAAACCCAATTCATCTGCGTCTGGAGCGCCTAGAAAGCTGGCAGCACG....
S28 ATGAACAAGACTCAACTGATTGATGTAATTGCAGAGAAAGCAGAACTGTCCAAAA....
S29 ATGCTGGCGGGCGCTCTGTTTCTTACTGCCTGTAGTCACAACTCTTCACTTCCTC....
S30 ATGAAACGGAACACGAAAATTGCCCTGGTAATGATGGCGCTTTCAGCAATGGCGA....
S31 ATGCGTTTTATGCAACGTTCTAAAGACTCCTTAGCTAAATGGTTAAGCGCGATCC....
S32 ATGACGCACGATAATATCGATATTCTGGTGGTGGATGATGACATTAGCCACTGCA....
S33 ATGAAAGTATTAGTGATTGGTAACGGCGGGCGCGAGCACGCGCTGGCCTGGAAAG....
S34 ATGCAACAACGTCGTCCAGTCCGCCGCGCTCTGCTCAGTGTTTCTGACAAAGCCG....
↓
↓
↓
Gibbs sampler↓
(b)
S1 ... AUGAACCACUCCUUAAAACCCUGGAACACAUUUGGCAUUGAUCAUAAUG...
S2 ... AUAUUUGUCGAUGUUCUGGCGUCUGGAACAGGGCCCGGCGGCGGCGAUUGGUUUAAGUCU...
S3 ... GAAUCUGCGCCGUCAGGCAGUUCUGGAACAGUUUCUUGGUACCAACGGGCAACGCAUUCC...
...
S34 ... UGCUCGCUGGAAGAUGCGGUAGAGAACAUCGAUAUCGGCGGC...
0 500 1000 1500 2000 2500 3000 3500 4000 4500
0 1000 2000 3000 4000 5000
S
1
D
a
n
d
S
2
D
Sequence length
S1D and S2D scatter diagram
of
E.coli
NC101
S1D S2D
Fig. 2. Scatter diagram of S1D and S2D in E. coli NC101 contig1 sequences.
Table 1. Gibbs sampler output
(a) Global alignment score (F) = 230.9101
Frequency Table
Code Count Freq
A 7622 0.2419
C 7977 0.2532
G 8879 0.2818
U 7031 0.2231
(b) Final site-specific counts
A C G U
1 0 34 0 0
2 0 0 0 34
3 0 0 33 1
4 7 0 26 1
5 29 0 0 5
6 32 0 2 0
(c) Final site-specific frequencies
A C G U
1 0.00691 0.97866 0.00805 0.00638
2 0.00691 0.00723 0.00805 0.97780
3 0.00691 0.00723 095091 0.03495
4 020691 0.00723 0.75091 0.03495
5 0.83548 0.00723 0.00805 0.14923
6 0.92120 0.00723 0.06519 0.00638
(d) Final PWM
A C G U
1 3.55288- 1.34992 3.55495- 3.55600-
2 3.55288- 3.55757- 3.55495- 1.47685
3 3.55288- 3.55757- 1.21665 1.85463-
4 0.15376- 3.55757- 0.98051 1.85463-
5 1.24196 3.55757- 3.55495- 0.40295-
6 1.33962 3.55757- 1.46340- 3.55600-
Number of input sequences: 34; Width of motif: 6. a: Frequency table; b: Final site-specific counts in motifs; c: Final site-specific frequencies in motifs; d: Final PWM in motifs. A= adenine; C= cytosine; G= guanine; U= uracil
Table 2. Gibbs sampler results of E. coli NC101 contig1 sequences for motif, start location and PWMS identification
SeqName Motif Start PWMS
lcl|NZ_AEFA01000001.1_gene_1 CUGGAA 20 2009.2156
lcl|NZ_AEFA01000001.1_gene_2 CUGGAA 414 2009.2156
lcl|NZ_AEFA01000001.1_gene_3 CUGGAA 225 2009.2156
lcl|NZ_AEFA01000001.1_gene_4 CUUGUA 31 17.9811
lcl|NZ_AEFA01000001.1_gene_5 CUGUAA 32 117.9619
lcl|NZ_AEFA01000001.1_gene_6 CUGAUG 39 7.5632
lcl|NZ_AEFA01000001.1_gene_7 CUGAUA 1 124.7508
lcl|NZ_AEFA01000001.1_gene_8 CUGGAA 438 2009.2156
lcl|NZ_AEFA01000001.1_gene_9 CUGGAA 39 2009.2156
lcl|NZ_AEFA01000001.1_gene_10 CUGAAA 471 646.2746
lcl|NZ_AEFA01000001.1_gene_11 CUGAAA 237 646.2746
lcl|NZ_AEFA01000001.1_gene_12 CUGGAA 564 2009.2159
lcl|NZ_AEFA01000001.1_gene_13 CUGAAA 213 646.2746
lcl|NZ_AEFA01000001.1_gene_14 CUGGAA 330 2009.2156
lcl|NZ_AEFA01000001.1_gene_15 CUGGAA 144 2009.2156
lcl|NZ_AEFA01000001.1_gene_16 CUGGAA 504 2009.2156
lcl|NZ_AEFA01000001.1_gene_17 CUGGAA 159 2009.2159
lcl|NZ_AEFA01000001.1_gene_18 CUGGAA 417 2009.2156
lcl|NZ_AEFA01000001.1_gene_19 CUGGAG 63 121.8117
lcl|NZ_AEFA01000001.1_gene_20 CUGGAA 606 2009.2156
lcl|NZ_AEFA01000001.1_gene_21 CUGGAA 435 2009.2156
lcl|NZ_AEFA01000001.1_gene_22 CUGGAA 63 2009.2156
lcl|NZ_AEFA01000001.1_gene_23 CUGGAA 237 2009.2156
lcl|NZ_AEFA01000001.1_gene_24 CUGGUA 671 387.8401
lcl|NZ_AEFA01000001.1_gene_25 CUGGAA 765 2009.2156
lcl|NZ_AEFA01000001.1_gene_26 CUGAAA 153 646.2746
lcl|NZ_AEFA01000001.1_gene_27 CUGGAA 387 2009.2156
lcl|NZ_AEFA01000001.1_gene_28 CUGAAA 105 646.2746
lcl|NZ_AEFA01000001.1_gene_29 CUGGAA 552 2009.2156
lcl|NZ_AEFA01000001.1_gene_30 CUGGUA 24 387.8401
lcl|NZ_AEFA01000001.1_gene_31 CUGGAA 147 2009.2156
lcl|NZ_AEFA01000001.1_gene_32 CUGGAA 348 2009.2156
lcl|NZ_AEFA01000001.1_gene_33 CUGGAA 47 2009.2156
lcl|NZ_AEFA01000001.1_gene_34 CUGGAA 354 2009.2156
Mean
Standard deviation
1429.4078 812.3610
biology sequence analysis methods. These
techniques can provide very useful and valuable
information with very lower cost compared to
laboratory experiments. The most common
application of motif finding is to determine and find
the TFBS or transcription factor binding sites (14).
Transcription factors (TFs) attach most often to
small segments of DNA (binding sites) in DNA
upstream of a gene to activate or inactivate of gene
transcription. Their DNA-binding domains can
distinguish and recognize motifs. TRPF or
transcription regulatory protein factors often
connect to DNA as homo or hetero-dimers.
Therefore they distinguish DNA motifs that are
spaced motif pairs, inverted or direct repeats.
However, these motifs are often tedious and
difficult to identify owing to their high divergence
(15). Because of multiple binding modes and
indirect recognition, the action and reaction of
operators and holorepressors are highly sensitive to
the experimental conditions (DNA length, buffer
components, etc). Thus, there are many
discrepancies about equilibrium constants, kinetic
data and stoichiometry for these complexes. In
other words, equilibrium binding constants for
holorepressor/operator is different from one
experiment to another (15-16). However, there is no
unique combination of bases that is shared by all
binding sites, and although different bases can
occur at each position, there are clear biases in the
distribution of bases that occur at each position of
the binding sites (17-18). PWM has been employed
in genome investigations such as whole genome
identification of transcription units (19),
transcription factor binding sites or TFBS (20),
transcription initiation sites (21) and translation
initiation sites (22). Position weight matrix
sequence analysis has three outputs: the site
specific frequency, the position weight matrix, and
PWMS. On the other hand, it is interesting to find
sequence motifs in a set of co expressed genes by
microarray experiments (23). If these genes are co
regulated, thus they share TFBS that could be
monitored or controlled by similar or common TF
(24). Gibbs sampler will output a quantitative
measure of the motifs by computer program.
PWMS is the log-odds ratio, and the strongest motif
has the highest PWMS or odds-ratio (5). In this
work, Gibbs sampler algorithm was employed to
find the functional motifs in E. coli NC101 contig1
sequences. The results showed that CUGGAA is a
6-mer motif that has the highest PWMS of
2009.2156. 24 out of 34 sequences genes, had the
6-mer motif of CUGGAA (70.58%) (Table 2). The
homology between genes based on sequence motifs
is very important and crucial in order to understand
the function of uncharacterized genes and may be
helpful in studying the dynamic behavior of genes
(25). That is, it may be concluded that they may be
co regulated. Recently, the researchers reported that
the transfer of a functional gene from bacteria to
mammalian cells could occur. They showed that
engineered E. coli, expressing Inv and HlyA genes
(from Yersinia pseudotuberculosis and Lysteria
monocytogenes, respectively) are able to attack and
release DNA into mammalian cells (26). The
similar phenomenon was also reported in vivo, and
it was shown that invasive E. coli can carry and
deliver therapeutic genes to the colonic mucosa in
mice (27). On the other hand, a successful shRNA
transfer into mammalian cells was carried out by
non-pathogenic E. coli through a plasmid (28).
Bacteria strains for example E. coli, Salmonella,
and Clostridium can selectively grow and colonize
in tumors. In fact, scientists have showed that
bacteria are able to attack primary tumors and
metastases and they can be used for tumor-selective
drug delivery (29).
Our results may help the mentioned scenario
by finding and discovering the functional genetic
switches and motifs in E. coli NC101 contig1. The
branch point sequence could be placed anywhere,
however, it is preferable to be near the 3’ rather
than the 5’ site. Surely, experiments causing step by
step mutation on each nucleotide of the sequence
between the donor and the acceptor site, could be
performed, but this is very tedious and difficult.
Therefore, one can apply and run the Gibbs sampler
in order to find all the BPSs. The BPS cuts the E.
coli NC101 contig1 sequences into two sections:
the upstream part stretching from the 5’ site to BPS
(the S1 sequence), and the downstream sequence
from BPS to the 3’ site (the S2 sequence). The
lengths of S1 and S2 sequences are named as S1
and S2 distances (S1D and S2D). If BPS is limited
to be near the 3’ site, thus the S2 distance is smaller
than the S1 distance and vice versa (5).
Scatter diagram of S1D and S2D of E. coli
NC101 contig1 sequences is shown in Figure 2.
The results showed that most of the S2D were
higher than S1D (650.11±157.24 and 270.61±37.17
respectively).
The present study may help experimental studies on
elucidating the pharmacological and phylogenic
functions of the motifs in E. coli.
Conflict of interest
Authors declared no conflict of interest.
References
1. Cuevas-Ramos G, Petit CR, Marcq I, et al. Escherichia coli
induces DNA damage in vivo and triggers genomic instability in
mammalian cells. Proc Natl Acad Sci U S A2010;107:11537-42.
2. Ptashne M. A Genetic Switch, Gene Control and Phage
Lambda. Cambridge: MA: Cell Press and Blackwell Scientific;
1986.
3. Bailey TL. Discovering sequence motifs. Methods Mol Biol
2008;452:231-51.
4. Favorov AV, Gelfand MS, Gerasimova AV, et al. A Gibbs
sampler for identification of symmetrically structured, spaced
DNA motifs with improved estimation of the signal length.
Bioinformatics 2005;21:2240-5.
5. Xia X. Position Weight Matrix, Gibbs Sampler, and the
Associated Significance Tests in Motif Characterization and
Prediction. Scientifica 2012;2012:1-15.
6. Metropolis N. The Beginnning of the Monte Carlo Method.
Los Alamos Science 1987;15:125-30.
7. Mannella CA, Neuwald AF, Lawrence CE. Detection of likely
transmembrane beta strand regions in sequences of
mitochondrial pore proteins using the Gibbs sampler. J Bioenerg
Biomembr 1996;28:163-9.
8. Jensen JL, Hein J. Gibbs sampler for statistical multiple
alignment. Statistica Sinica 2005;15:889-907.
9. Samso M, Palumbo MJ, Radermacher M, et al. A Bayesian
method for classification of images from electron micrographs. J
Struct Biol 2002;138:157-70.
10. Escobar-Paramo P, Grenet K, Le Menac'h A, et al.
Large-scale population structure of human commensal Escherichia coli
isolates. Appl Environ Microbiol 2004;70:5698-700.
11. Johnson JR, Johnston B, Kuskowski MA, et al. Molecular
epidemiology and phylogenetic distribution of the Escherichia
coli pks genomic island. J Clin Microbiol 2008;46:3906-11.
12. Arthur JC, Perez-Chanona E, Muhlbauer M, et al. Intestinal
inflammation targets cancer-inducing activity of the microbiota.
Science 2012;338:120-3.
13. Chen X, Jiang T. An improved Gibbs sampling method for
motif discovery via sequence weighting. Comput Syst
Bioinformatics Conf 2006:239-47.
14. Mrazek J. Finding sequence motifs in prokaryotic
genomes--a brief prgenomes--acticgenomes--al guide for genomes--a microbiologist. Brief Bioinform
2009;10:525-36.
15. Hurlburt BK, Yanofsky C. Enhanced operator binding by trp
superrepressors of Escherichia coli. J Biol Chem 1990;
265:7853-8.
16. Finucane MD, Jardetzky O. Surface plasmon resonance
studies of wild-type and AV77 tryptophan repressor resolve
ambiguities in super-repressor activity. Protein Sci
2003;12:1613-20.
17. Berg OG, von Hippel PH. Selection of DNA binding sites by
regulatory proteins. Statistical-mechanical theory and application
to operators and promoters. J Mol Biol 1987;193:723-50.
18. Durbin R, Eddy S, Krogh G, et al. Biological sequence
analysis. 1 ed. Cambridge: Cambridge University Press;
1998:356.
19. Kobayashi H, Akitomi J, Fujii N, et al. The entire
organization of transcription units on the Bacillus subtilis
genome. BMC Genomics 2007;8:197.
20. Ma P, Xia X. Factors affecting splicing strength of yeast
genes. Comp Funct Genomics 2011;2011:212146.
21. Grech B, Maetschke S, Mathews S, et al. Genome-wide
analysis of chlamydiae for promoters that phylogenetically
footprint. Res Microbiol 2007;158:685-93.
22. Li GL, Leong TY. Feature selection for the prediction of
translation initiation sites. Genomics Proteomics Bioinformatics
2005;3:73-83.
23. Schena M. Microarray Analysis. New York: Wiley Liss;
2003.
24. Xia X, MacKay V, Yao X, et al. Translation initiation: a
regulatory role for poly(A) tracts in front of the AUG codon in
Saccharomyces cerevisiae. Genetics 2011;189:469-78.
25. Shen-Orr SS, Milo R, Mangan S, et al. Network motifs in the
transcriptional regulation network of Escherichia coli. Nat Genet
2002;31:64-8.
26. Grillot-Courvalin C, Goussard S, Huetz F, et al. Functional
gene transfer from intracellular bacteria to mammalian cells. Nat
Biotechnol 1998;16:862-6.
27. Castagliuolo I, Beggiao E, Brun P, et al. Engineered E. coli
delivers therapeutic genes to the colonic mucosa. Gene Ther
2005;12:1070-8.
28. Strillacci A, Griffoni C, Lazzarini G, et al. Selective
cyclooxygenase-2 silencing mediated by engineered E. coli and
RNA interference induces anti-tumour effects in human colon
cancer cells. Br J Cancer 2010;103:975-86.
29. Jiang SN, Phan TX, Nam TK, et al. Inhibition of tumor
growth and metastasis by a combination of Escherichia
coli-mediated cytolytic therapy and radiotherapy. Mol Ther
2010;18:635-42.