“I/We hereby declared that I/we have read through this report
and found that it has comply the partial fulfillment for awarding the degree of Bachelor of Mechanical Engineering (Design and Innovation)”
Signature :
Supervisor Name : Mr. Shafizal Bin Mat
DESIGN AND ANALYSIS OF OPTICAL MOUSE USING BOOTHROYD DEWHURST DFMA METHODOLOGY
KHAIRUL AIDIL BIN NORDIN
This report is submitted as partial fulfillment of the requirement for the award of
Bachelor of Mechanical Engineering (Design and Innovation)
Faculty of Mechanical Engineering Universiti Teknikal Malaysia Melaka
“I hereby declared that this report is a result of my own work except for the excerpts that have been cited clearly in the references”
Signature : ………
Name : Khairul Aidil Bin Nordin
Especially to my beloved parents, My lovely brothers, My respectfully lecturers, Also my faithfully friends,
ACKNOWLEDGEMENT
In this great opportunity, I would like to thank Allah for providing me strengths to completing this report. Here, I would like to acknowledge with appreciation to all those people who helped me numerously during completing this project.
In a particular, I would like to convey my sincere thank you to my supervisor Mr. Shafizal Bin Mat, for giving me chance to do the project under his supervision. I also would like to thank to him for teaching me more in mechanical engineering subjects especially works for my topic. He also guided me and given advised based on his experience during my progress of this project. His constant encouragement and guidance had brought me to completing my project.
ABSTRACT
ABSTRAK
TABLE OF CONTENT
CHAPTER TITLE PAGE
DECLARATION i
ACKNOWLEDGEMENT v
ABSTRACT vi
ABSTRAK vii
CONTENTS viii
LIST OF TABLES xii
LIST OF FIGURES xiv
LIST OF APPENDIX
xv
CHAPTER 1 INTRODUCTION 1
1.1 General 1
1.2 Objectives 2
1.3 Scope Of The Project 2
1.4 Problem Statement 3
CHAPTER 2 LITERATURE REVIEW 4
2.1 Design for Manufacturing and Assembly
(DFMA) 4
2.2 history and Background of design assembly
(DFMA) 7
2.3 Advantage of applying DFMA 9
2.4 Example How DFMA Apply 10
2.5 Overview of DFMA 14
2.5.1 guideline for DFM 14
2.5.2 rules for DFM 15
2.5.3 Basic DFA Guidelines 16
2.5.3.1 Design Guideline for HART
& Fastening
2.6 DFMA method 19
2.7 Various DFMA Method 21
2.7.1 The lucas Method 21
2.7.1.1 The Evaluation procedure 23 2.7.1.2 Improvement of Design 24 2.7.1.3 The Lucas DFA Evaluation
example 24 2.7.2 Assembly Evaluation Method (AEM) 27 2.7.2.1 The Evaluation Procedure 29 2.7.2.2 Improve of Design 30 2.7.2.3 The Hitachi,s AEM Method
example 30 2.7.3 The Boothroyd Dewhurst Method 31 2.7.3.1 Evaluation Procedure 32 2.7.3.2 Improvement of Product 33 2.7.3.3 Boothroyd Dewhurst DFMA
example 33
2.8 summary 37
CHAPTER 3 METHODOLOGY 39
3.1 Introduction 40
3.2 Literature Review 41
3.3 Conceptual Design 41
3.4 selection Design 41
3.5 CAD Drawing (Detail Design) 42
3.6 DFMA Analysis
3.6.1 Alpha and Beta symmetric
3.6.2 Design Guideline for Part Handling 3.6.3 Design Guideline for Insertion &
Fastening 45
CHAPTER 4 DFMA ANAYSIS FOR EXISTING PRODUCT 49
4.1 Introduction 49
4.2 Product Description 49
4.3 Analysis of the existing product (Manual) 53
4.3.1 Assembly Flow Chart 54
4.3.2 The Process and Material Selection 56
4.3.3 Theoretical Part 64
4.3.4 Alpha and Beta symmetric 65
4.3.5 Handling and Insertion Time 66
4.4 Analysis of the existing product (DFMA Software) 68 4.4.1 Design for Manufacture (DFM) 68 4.4.2 Design for Assembly (DFA) 73 CHAPTER 5 CONCEPTUAL DESIGN AND SELECTED DESIGN 77
5.1 Introduction 77
5.1.1 Proposed Design 78
5.1.2 Selection Design 83
5.2 Detail drawing 86
5.2.1 Drawing Design for Existing Design 86 5.5.2 Drawing Design for New Design 87
CHAPTER 6 DFMA ANAYSIS FOR NEW DESIGN 88
6.1 Introduction 88
6.2 Analysis of the New Design (Manual) 88
6.2.1 Assembly Flow Chart 91
6.2.2 The Process and Material Selection for New design 92
6.2.3 Theoretical Part 98
6.2.5 Handling and Insertion Time 99 6.3 Analysis of the new design (DFMA Software) 101 6.3.1 Design for Manufacture (DFM) 101
6.4 Design for Assembly (DFA) 103
CHAPTER 7 DISCUSION 106
7.1 Introduction 106
7.2 Comparison of Manual and Software analysis 106 7.3 Comparison of Existing Design and New Design 110
CHAPTER 8 CONCLUSION AND SUGGESTION 113
8.1 Conclusion 113
8.2 Suggestion and Recommendation 114
REFERENCE 115
APPENDIXES 117
APPENDEX A1 117
APPENDEX A2 118
APPENDEX B1 119
APPENDEX B2 120
APPENDEX C1 121
LIST OF TABLE
NO TABLE PAGE
2.1 DFMA Software Average Reductions 9
(Source: Boothroyd Dewhurst, Inc)
2.2 DFA analysis result 11
(Source: Geoffrey Boothroyd, 1994)
2.3 Result after DFA analysis 13
(Source: Geoffrey Boothroyd, 1994)
2.4 The available commercial DFMA method 19
(Source:Stephen ESkilandar, 2001)
2.5 Evaluating the design efficiency of Piston 35 (Source: Redford Alan, J. Chal, 1990)
2.6 Evaluating the design efficiency of the re-designed piston 37 (Source: Redford Alan, J. Chal, 1990)
3.1 Table for computation of Design efficiency 43 (Source: Redford Alan, J. Chal, 1990)
3.3 Manual Handling 46
(Source: Geoffrey Boothroyd, 1994)
3.4 Manual Insertion 47
(Source: Geoffrey Boothroyd, 1994)
4.2 Alpha & Beta of Optical Mouse part 65
4.3 Analyze Handling and Insertion Time 66
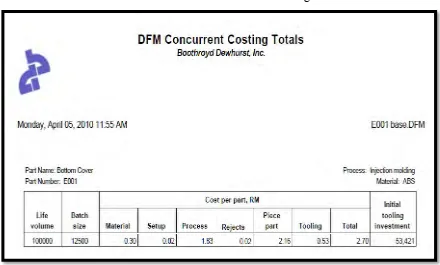
4.4 DFM Software Concurrent Costing Totals 71
4.5 Totals Costing per Part of each part 72
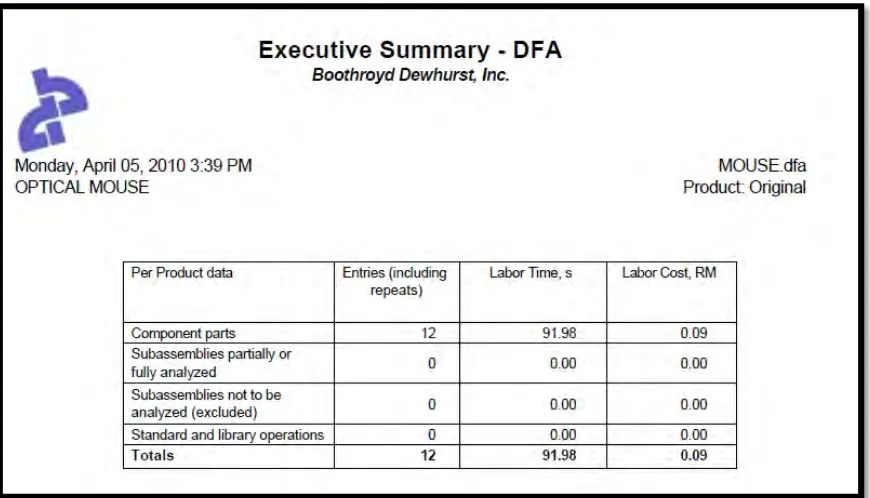
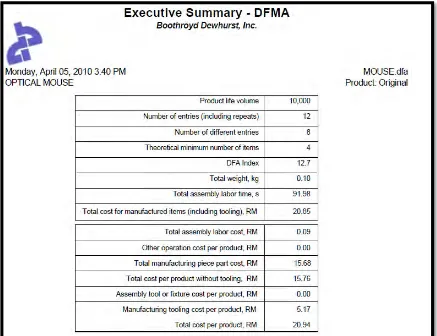
4.6 Executive Summary for DFA 74
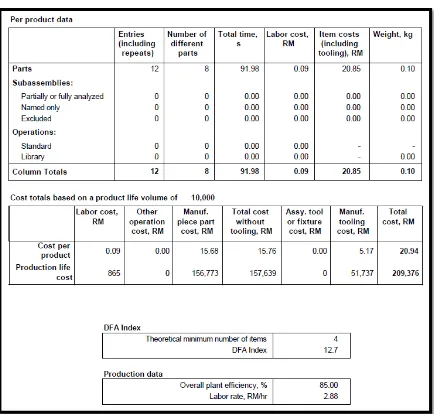
4.7 Total Analysis for DFMA 75
4.8 DFMA summary result 76
5.1 Pugh’s concept selection method 84
6.1 Theoretical Part for New Design 98
6.2 Alpha & Beta of Optical Mouse part 99
6.3 Analyze Handling and Insertion Time 100
6.4 DFM Software Concurrent Costing Totals 101 6.5 Totals Costing per Part of each part 102
6.6 Executive Summary for DFA 103
6.7 Total Analysis for DFMA 104
6.8 DFMA summary result 105
7.1 Result of Manual Analysis 109
LIST OF FIGURE
NO. FIGURE PAGES
Figure 2.1 Traditional product development compared to concurrent engineering
(Source: Stephen Eskilandar, 2001) 6 Figure 2.2 Proposed original design of Motor Drive assembly
(Source: Geoffrey Boothroyd, 1994) 10 Figure 2.3 Redesign of Motor Drive assembly after DFA
(Source: Geoffrey Boothroyd, 1994) 12 Figure 2.4 The Lucas DFMA procedure
(Source: H J Bullinger and M Richter, 1991) 22 Figure 2.5 Lucas evaluation method on existing design
(Source: Redford Alan, Jan Chal, 1994) 25 Figure 2.6 Lucas evaluation method on redesign product
(Source: Redford Alan, Jan Chal, 1994) 26 Figure 2.7 The Hitachi’s AEM procedure
(Source: www.ami.ac.uk/ami4813_dfx/u03/s01/index.asp) 28 Figure 2.8 Assemblability evaluation and improvements
(Source: Redford Alan, J. Chal, 1990) 30 Figure 2.9 A piston-assembly design
(Source: Redford Alan, J. Chal, 1990) 34
Figure 2.10 An improved piston design
(Source: Redford Alan, J. Chal, 1990) 36
Figure 3.1 Project Flow Chart 40
Figure 3.2 Alpha & Beta rotational symmetric guideline
(Source: Geoffrey Boothroyd 1991) 44
Figure 4.2 Top cover of Optical Mouse 50 Figure 4.3 Middle cover of Optical Mouse 51 Figure 4.4 Bottom cover of Optical Mouse 51
Figure 4.5 Scroll Wheel with rubber 52
Figure 4.6 Printed circuit board (PCB) of optical Mouse 52 Figure 4.7 Disassembly view for Optical Mouse 53 Figure 4.8 Assembly Process Flow for Existing Design 54 Figure 4.9 Process Flow for Bottom Cover (Base) 57 Figure 4.10 Process Flow for LED Reflector 58 Figure 4.11 Process flow for PCB Board 59 Figure 4.12 Process Flow for Scroll Wheel 60 Figure 4.13 Process Flow for Middle Cover 61 Figure 4.14 Process Flow for Top Cover 62 Figure 4.15 Process Flow for Scroll Rubber 63 Figure 4.16 Example DFM Software for Bottom Cover Part 68 Figure 4.17 Process and Material Selection 69
Figure 4.18 Add Process 70
Figure 4.19 Example DFA analysis for Part 73
Figure 5.1 Concept 1 Isometric view 78
Figure 5.2 Concept 1 Plan View 78
Figure 5.3 Concept 1 Side View 78
Figure 5.4 Snap Fit Mechanism 79
Figure 5.5 Concept 2 Isometric View 80
Figure 5.6 Concept 2 Plan View 80
Figure 5.7 Concept 2 Side View 81
Figure 5.8 Lock mechanism 81
Figure 5.10 Concept 3 Plan View 82
Figure 5.11 Concept 3 Side View 83
Figure 5.12 Design selected 85
Figure 5.13 Bill of Material Existing Design 86 Figure 5.14 Bill of Material New Design 87 Figure 6.1 Disassembly view for New Design Optical Mouse 89 Figure 6.2 Assembly view for New Design Optical Mouse 90 Figure 6.3 Assembly Process Flow for New Design 91 Figure 6.4 Process Flow for Bottom Cover (Base) 93 Figure 6.5 Process Flow for Led Reflector 94
Figure 6.6 Process Flow for PCB Board 95
Figure 6.7 Process Flow for Scroll Wheel 96 Figure 6.8 Process Flow for Top Cover 97 Figure 7.1 Improvement for Scroll Wheel 110
Figure 7.2 Improvement of Cover 111
Figure 7.3 Improvement of Mechanism 111
LIST OF APPENDIX
NO APPENDIX PAGES
A1 Manual Handling Time 117
A2 Manual Insertion Times 118
B1 Result for DFM Analysis of Existing Design 119 and New Design by Software.
B2 Result for DFA Analysis of Existing Design And 120 New Design by Software.
C1 Detail Drawing for Existing Design Parts 121 120
CHAPTER 1
INTRODUCTION
1.1 General
Design for Manufacturing (DFM) and design for assembly (DFA) are the integration of product design and process planning into one common activity. DFMA can define as “a process for improving product design for easy to manufacture and low-cost assembly, focusing on functionality and on assimilability concurrently.”
The goal of designing for manufacturing and assembly (DFMA) is to design a product that is easily and economically manufacture and assembly. On the other words is to improve the design of the assembly, to reduce the adhesion such as welding operation necessary to end up with a finished product. The most common methods of improvements are reducing the number of times the part have to be reoriented, and eliminating any excess material without sacrifice the product quality (George A. Bekey, 1993).
decisions made during production only 20%. Further, decisions made of the product’s cost, quality and manufacturability characteristics (Piere De Lit, 2003).
1.2 Objectives
The goals of this project are:
i. To design and analyze of optical mouse using Boothroyd-Dewhurst DFMA methodology.
ii. To compare of between existing product and proposed design.
iii. To improve the assembly efficiency of existing product and proposed design.
1.3 Scope Of The Project
To ensure the objectives are achieved, some of the important element must be considered. There are as follow:
i. Literature Review.
ii. Drawing of existing design using the CATIA.
iii. Analysis of existing design using Boothyord-Dewhurst DFMA.
iv. Conceptual design and Detail design for the modification of existing product drawn by using CAD.
v. Boothyord-Dewhurst DFMA analysis of the existing and proposed design.
1.4 Problem Statement
There are several significant problems regarding to the project that exists in the case study:
i. Maximum number of subassembly part which less or not functions
ii. The cost price of the existing product high because using excessive raw material and more purchases part (such as screws) used.
CHAPTER 2
LITERATURE REVIEW
2.1 Designs for Manufacture and Assembly (DFMA)
A literature review is a body of text that aims to review the critical point of current knowledge on a particular topic. Base on literature review, it provides general up to date ideals, theoretical concept and applications related to this project. This literature review will go through those topics related to Design for Manufacturing and Assembly (DFMA), Design for Assembly (DFA) and Design for Manufacturing (DFM) where has become an important concurrent engineering imperative for cost effective product design. The basis of DFMA is a systematic procedure for analyzing product design based on the application of the application of quantifiable data. This chapter also explained the basic concept and method of Boothroyd Dewhurst DFMA. The method is described for effective integration of quantitative and qualitative materials, manufacturing and assembly process information during product design.
the both term are often combined as Design for Manufacture and Assembly (DFMA). Buss et al. (2001) agreed with this point of view, saying that the DFMA allows bring the product design to be effective if the considerations of design related to the assembly and manufacturability of the product.
Design for manufacture and assembly, or DFMA it has become to known, is now a widely accepted technique and are use in many manufacturing industries around the world purpose to earn more profit. There are three goals in DFM (Xiaofan Xie, 2002):
i. Increase the quality of new produces during the developing period, including design, technology, manufacturing, assembly, service and so on.
ii. Decrease the cost, including the cost of design, technology, manufacturing, delivery, technical support, discarding and so on.
iii. Shorten the developing cycle time and increase productivity including the time of design, manufacturing preparing, and repeatedly calculation.
Examples now prove that DFMA analysis provides much greater benefit than a simple reduction in-assembly cost. In fact, it appears that DFMA is the key to very significant reduction in overall manufacturing cost.
DFMA is used to provide accurate cycle time and manufacturing costs at the conceptual stage of the design cycle. This enables engineers to make more informed decisions for design optimization before it is too late make any changes. A few of these simple principles are:
a) Minimize the number of part
b) Minimize the number of assembly operations c) Improve access and visibility
d) Maximize part compliance
Commonly, the incentive for considering design for manufacture and assembly is the need for improved productivity and cost performance. It has become widely accepted that first step in assessing the feasibility of automated assembly is the consideration of the product design and making changes to make automation plausible.
Since all this done at the design stage, the result is the optimum product design and before too much time and money has wasted in unnecessary planning, tooling and perhaps actual production of eliminated parts (Mark Curtis, 1990).
2.2 History and Background of Design for Assembly (DFMA)
In the 1960’s and 70’s various rules and recommendation were proposed in order to help designer consider assembly problems during the design process. Many of these rules and recommendations were presented together with practical examples showing how assembly difficult could be improved. However, it was not until the 1970’s that numerical evaluation method were developed to allow design for assembly studies to be carried out on existing and proposed design.
The first evaluation method was developed at Hitachi and was called the Assembly Method (AEM). This method is based on the principal of “one motion for one part.” For more complicated motions, a point-loss standard is used and the ease of assembly of the whole product is evaluated by subtracting points lost. The method was originally developed in order to rate assemblies for ease of automatic assembly.
Starting in 1977, Geoff Boothyord, supported by NSF grant at the University of Massachusetts, developed the design for Assembly (DFA) method; it is based on timing each of the handling and insertion motion which could be used to estimate the time for manual assembly of a product and the cost of assembling the product on an automatic assembly machine. Recognizing that the most important factor in reducing assembly costs was the minimization of the number of separate parts in a product, he introduced simple criteria which could be used to determine theoretically whether any of the parts in the product could be eliminated or combined with other parts. U.K. Unlike the Boothroyd Dewhurst method, the Lucas method is based on a “point scale” which gives a relative measure of assembly difficulty. Lucas DFA method definitely based on the parts count analysis stage with is known as terms “functional analysis”.
including the National Medal of Technology. There are many manufacturing company of significant savings obtained through the application of DFA software. For example in 1981, Sidney Liebson, manager of manufacturing engineering for Xerox, estimated that this company would save hundreds of millions dollars through the application of DFA. In the 1988, Ford Motor Company credited the software with overall savings approaching $1 billion. In many companies DFA is a corporate requirement and DFA software is continually being adopted by companies attempting to obtain greater control over their manufacturing cost. John Allen (2006) from Celestica identified Boothroyd-Dewhurst’s DFA soft as playing an important role in the early-stage review for manufacturing and assembly design.
Using DFMA software, product engineers assess the cost contribution of each part and then simplify the product concept through part reduction strategies. These strategies involve incorporating as many features into one part as is economically possible. DFMA software tools and services allow companies to develop product with fewer parts at lower cost and with higher quality than was previously possible. Table 2.1 shows the average reductions with using DFMA software where the result compiled from over 100 published case studies. The outcome of DFA software is a more elegant product with fewer parts that is both functionally efficient and easy to assemble. The larger benefits of DFA software are reduced part cost, improved quality and reliability, and shorter development cycles. A few achievements by using DFMA application is:
i. Create products that are functionally efficient and easier to assemble. ii. Estimate assembly costs for alternative design.
iii. Reduce manufacturing and assembly costs.
Table 2.1: DFMA Software Average Reductions (Source: Boothroyd Dewhurst, Inc)
Item Reduction (%)
Labor Costs 45
Part Count 54
Separate Fasteners 57
Weight 22
Assembly Time 60
Assembly Cost 45
Assembly Tools 73
Assembly Operations 53
Product Development Cycle 45
Total cost 50
2.3 Advantage of Applying DFMA
There were advantages of applying Boothroyd Dewhurst DFMA to product. The advantages as following (G. Boothroyd, P. Dewhurst, W. Knight 1994):
i. DFMA provides a systematic procedure for analyzing a design from view of assembly and manufacture. The procedure result more simple and more reliable product which less expensive.
ii. DFMA tools encourage dialogue between designer and manufacture engineers and other individual who involve. This means the teamwork is encouraged and benefite of simulation engineering can achieve.
2.4 Example How DFMA is Apply
The example in Figure 2.2 showed proposed original design of motor drive in exploded view. The design showed the parts before analyze using DFMA method.
Table 2.2: DFA analysis result (Source: Geoffrey Boothroyd, 1994)
Parts No. Theoretical Assembly Assembly
Part Count Time (S) Cost ($)
Base 1 1 3.5 2.9
Bushing 2 0 12.3 10.2
Motor
Subassembly 1 1 9.5 7.9
Motor Screw 2 0 21 17.5
Sensor
Subassembly 1 1 8.5 7.1
Set Screw 1 0 10.6 8.8
Standoff 2 0 16 13.3
End Plate 1 1 8.4 7
End Plate Screw 2 0 16.6 13.8
Plastic Bushing 1 0 3.5 2.9
Thread Leads - - 5 4.2
Reorient - - 4.5 3.8
Cover 1 0 9.4 7.9
Cover Screw 4 0 31.2 26
Total 19 4 160 133
Design efficiency =
Table 2.2 shows the result of Design for Assembly (DFA) analysis for the motor drive assembly proposed design. The result for design efficiency is 7.5%.
Figure 2.3: Redesign of Motor Drive assembly after DFA (Source: Geoffrey Boothroyd, 1994)
Table 2.3: Result after DFA analysis (Source: Geoffrey Boothroyd, 1994)
Parts No. Theoretical Assembly Assembly
Part Count Time (S) Cost ($)
Base 1 1 3.5 2.9
Motor
Subassembly 1 1 4.5 3.8
Motor Screw 2 0 12 10
Sensor
Subassembly 1 1 8.5 7.1
Set Screw 1 0 8.5 7.1
Thread Leads - - 5 4.2
Plastic Bushing 1 0 4 3.3
Total 6 4 46 38.4
Design efficiency =
2.5 Overview of DFMA
The Design for Manufacturing and Assembly has the guidelines that use for ease of assembly and manufacture. There were categorizing between design for assembly and design for manufacture. The guidelines are the principle of all the DFMA method available and can generally used for product design and development.
2.5.1 Guideline for DFM
The following guidelines are the practice use in development the product by DFM (G. E. Dieter, 2000):
i. Minimize total number of parts by eliminate parts by combine the 2 or more parts in single piece of part. However, the combination should consider the difficulty and complexity of design should also reduce.
ii. Standardize components is use which available commercially.
iii. Use common parts across product lines, by usage of parts in more than one product will simplify the process operations.
iv. Part should design to be multifunctional, where it can fulfill more than one function. Therefore, the quantity of part in product is reducing.
v. The part should design for ease of fabrication whenever possible.
vi. Avoid tight tolerance. The high precisions of parts in fabrication are costly which need extra precision tooling and high skill worker. Therefore, the avoidances of the tight tolerance are required wherever possible.
vii.Avoid secondary operations on parts such heat treatment, polish, planting and other. The process use only if has functional reasons or is need for aesthetic purposes.
polymers injection molding can provided with “built-in” color, as opposed to metal that need to be painted.
2.5.2 Rules for DFM
A list of the specific design rules as the following (J. George, 1986):
i. Space holes in machined, cast, molded or stamped parts so they can been make in one operation without tooling weakness. This means that there is a limit on how close holes may be spaced due to strength in thin section within hole.
ii. Avoid generalize statement on drawings, like “polish this surface” or “tool marks not permitted” which are difficult for manufacturing personnel to interpret. Notes on engineering drawings must specific and unambiguous. iii. Dimension should make from specific surface or points on parts, not from
points in space.
iv. Dimension should all be from single datum line rather than from variety of points to avoid overlap of tolerances.
v. The design should aim for minimum weight consistent with strength and stiffness required.
vi. Use the general purpose of tooling rather than special customizes tool wherever possible.
vii.Use generous fillets and radius on castings, molded, formed and machined parts.
2.5.3 Basic DFA Guidelines
Each act of retrieving, handling, and mating a component is called an assembly operation. Each assembly operation takes time and has an associated cost. The assembly of components can from a significant part of the manufacturing cost of a product, especially when large quantities of component are involved. The use of guidelines on good design practice for manufacturing and assembly can help improve manufacturing and assembly efficiency, thereby reduce the time and costs. Here are some basic guidelines for DFA. Generally, start with a concept design and then go through each of these guidelines, decide whether or not it is applicable, and the modified the concept to satisfy the guideline. There is no guarantee that a given guideline will apply to a particular design problem (George E. Dieter. 2000):
i. Minimize part count by incorporating multiple functions into single part. ii. Modularize multiple parts into single subassemblies.
iii. Assemble in open space, not in limited spaces with never hide important components.
iv. Make parts such that it is easy to identify how they should be oriented for insertion.
v. Prefer self-locating parts.
vi. Standardize to reduce part variety. vii. Maximize part symmetry
viii.Design in geometric or weight polar properties if nonsymmetrical. ix. Eliminate tangle parts.
x. Color code parts that are different but shaped similarly. xi. Prevent nesting of parts; prefer stacked assemblies. xii. Provide orienting features on non-symmetries. xiii.Design the mating features for easy insertion. xiv. Provide alignment features.
xv. Insert new parts into an assembly from above.
xviii. Place fasteners away from obstructions; design in fastener access.
xix. Deep channels should be sufficiently wide to provide access to fastening tools; eliminate channels if possible.
xx. Provide flats for uniform fastening case.
xxi. Ensure sufficient space between fasteners and other features for a fastening tool.
xxii.Prefer easily handled parts .
The process of manual assembly is divided into 2 separate areas (G. Boothroyd et. al, 1994):
i. Handling – acquiring, orienting and moving of part
ii. Insertion and fastening – mating a part to another part or group of parts.
2.5.3.1 Design Guideline for Part Handling
Generally, for ease the part handling, the factors should consider are:
i. Design parts that have end-to-end symmetry and rotational about axis of insertion. If thus cannot be achieved, try to design parts having maximum possible symmetry.
ii. Design parts that in those instances where the part cannot be make symmetric are obviously asymmetric.
iii. Provide features that will prevent jamming of parts that tend to nest or stack when stored in bulk.
iv. Avoid features that will allow tangling of parts when stored in bulk.
2.5.3.2 Design Guideline for Insertion & Fastening
For the ease of the handling and insertion designer should attempt to:
i. Design so that there is little or no resistance to insertion and provide chamfers to guide insertion of two mating parts. Generous clearance should be provide and with care must be take to avoid clearances that will result a tendency for parts to jam or hang-up during insertion.
ii. Standardize by using common parts, processes and methods across all models and even across product lines to permit the use of higher volume processes that normally result in lower product cost.
iii. Use pyramid assembly – provide for progressive assembly about one axis of reference. Generally it is best assemble from above.
2.6 DFMA Method
There were several designs for assembly method available to support product development. Sackett and Holbrook (1988) reported of twelve commercially available DFMA methods as Table 2.4.
Table 2.4: The available commercial DFMA method (Source: Stephen ESkilandar, 2001)
DFMA method Authors Country origin
Assemblability Evaluation Method (AEM) Ohashi Yano Japan
Boothyord-Dewurst DFMA Boothyord USA
Dewhurst
A designer guide optimize the assemblability
of the product design (DGO) Hock USA
Lucas Method Miles Swift UK
ASSEMBLY DeWinter Belgium
machiels
Assembly Oriented Product Design (AOPD) Bassler Germany
Warnecke
Assembly System (ASSYST) Arpino Italy
Grppeti
Assembly View Sturges USA
Design for Assembly Cost-effectiveness Yamagiwa Japan Product and System Design for Robust
Assembly Davisson USA
The DFA House Rampersad The Netherlands
There were two approaches of evaluation philosophies in DFA are the qualitative and quantitative evaluation. The qualitative defined as evaluation criteria that used to decide whether the product does fit a certain assembly process or not. The evaluating requirement themselves give information about the preferred solution that will fit the assembly process (Stephen ESkilandar, 2001).
Quantitative evaluation defined as evaluating a product and being given the answer that it takes how much second to assembly process. Quantitative evaluation does not given explicit information about the preferred solution for the assembly process.
2.7 Various DFMA Method
Various researchers have proposed method of evaluating the efficiency of product design from the perspective of product assembly. DFMA consist of three popular methods which is Boothroyd Dewhurst method, Lucas method and Assembly evaluation method. All of these method have their same mission which is to the design team in simplifying the product structure, to reduce manufacturing and assembly cost, and to quantify the improvements. But they their own techniques which is (Mital. A, 2007):
i. The Boothyord Dewhurst method: this method seeks to reduce the number of parts by a consideration of manual handling and manual insertion time. ii. The Lucas method: Analysis is carried out in three sequences
stages-functional, fitting and feeding.
iii. The Assembly evaluation method: This method aims to facilitate design improvements by identifying weakness in the design at the earliest stage in the process by using an assemblability evaluation score and assembly cost ratio.
2.7.1 The Lucas Method
term of “handling” for the manual assembly operations and “feeding” when part handle automatic (H J Bullinger and M Richter, 1991).
2.7.1.1 The Evaluating procedure
The system feature of three assimilability score, which are; design efficiency, feeding/handling and fitting ratio. The evaluation is carried out by the following procedure:
i. Functional analyses carried out by rules of value operation are categorized due to the functional importance. Each operation or activities are categorized as either an A (essential) part or a B (non-essential) parts. Then the design efficiency is derived from the ratio of essential part to total part (A/(A+B)). Design efficiency should exceed 60% as by suggestion to aim.
ii. Feeding or handling analysis; depend on manual or automatic assembly. Each component is examined with respect to a knowledge base, and the user determines a feeding index. The feeding/handling ratio is the feeding index total divided by the number of essential components. The feeding index has a threshold of 1.5 indicating that any greater score be considered for redesign for feeding. The feeding ratio is the ratio of feeding index total to number of essential components, and has its own threshold of 2.5.
2.7.1.2 Improvement of Design
The improvement of the product is done by either eliminate all ‘B’ part or combine with ‘A’. The high index parts should be redesigned according to the evaluation criterion.
2.7.1.3 The Lucas DFA Evaluation Example
The second design illustrated in Figure 2.6, reduces the number of parts to 6 with a resulting design efficiency of 66%. A visual comparison between the two ASFs shows that the redesign is much simpler to assemble. This is reflected in the difference between the two Fitting Ratios (4.0 for the redesign compared to 19.9 for the original).
The redesign has reduced the number of components by getting rid of the bolt, washer and nut. These happen to attribute the higher feeding analysis scores (and fitting) to the total (this makes sense because these tend to be difficult to assemble in reality). As a consequence the feeding and handling ratio has reduced from 6.9 to 1.63.
2.7.2 Assembly Evaluation Method (AEM)
The Assemblability Evaluation Method (AEM), is develop by Hitachi as a result of trying to develop an automatic assembly system for tape recorder mechanism (Hashizume et al., 1980). After years of improvement, Miyakawa (1990) presented the ‘new’ Assembly Evaluation Method from Hitachi. The improvements were e.g. the improvement assembly cost estimate accuracy for individual parts. This methodic formally known as Hitachi’s AEM.
The method does not distinguish manual, automatic or robotic assembly. The reasons are the method is most beneficial when used in early conceptual stage and the manufacturing methods not decide yet.
The method improve design by identify “weakness” in early design process using two indicator. An assemblability index is calculated by summarizing the scores for all parts.
The indicators used in AEM for product evaluation are: i.Assembly evaluation score, “E”.
Asses the design by determine difficulties of assembly operation or design quality.
ii. Estimate assembly cost ratio, “K”.
Analysis procedures start by preparations, which involve collecting data of the design detail. Then the operation analysis is conduct by determine an assembly sequence and the categorizing each part according to “standard operation”. The total assemblability evaluation score individual tasks, divided by the number of tasks. With the evaluation index judgment, the improvement will consider for part reductions. The product’s design been improved by concentrate on evaluation score. As per Figure 2.6, the figure mentions the flow procedure of AEM,
Figure 2.7: The Hitachi’s AEM procedure
2.7.2.1 The Evaluation Procedure
The Hitachi AEM procedures are as per following sequence (R. Alan and J. Chal, 1994):
i. The analysis start by determine and categorized the assembly task sequence according by standard operation, that approximately 20 standard assembly task.
ii. All the parts tasks are receiving the penalty score, which subjects to difficulty of the assembly. The ideal operations are rewarded 100 points, which receive zero on penalty score. The score of 100 points represents the assembled with only downward motions.
iii. All score for the parts will summarize, then modify it by attach coefficients and subtracted from the best score.
iv. The totals then divided by the total number of parts. This may be able to consider a measure of design efficiency where a score of 100 would represent a perfect design.
v. Then the cost ratio, k is estimated continuously by compared to current assembly cost ratio with new design.
2.7.2.2 Improve of design
To redesign the product, the assemblability evaluation score, E is used as guide. However in certain cases, high score of ‘E’ can be achieve by having many simple components and the ‘K’ score will show the increasing due to parts increase.
2.7.2.3 The Hitachi’s AEM Method Example
The following Figure 2.8 is the example of assemblability evaluation and improvement of part.
As illustrated in Figure 2.8, the structure 1 shows an assembly task of the current design. The assembly evaluation score is 73, after sum of part score and divided by number of operation, 3. The result in product assemblability evaluation score is 73 is below than acceptable score of 80. The improvement designs shown in structure 2, which improvement on part by remove the holding. It must spot-facing the chassis down. This gives assemblability evaluation score, E as 88; the assembly cost ratio, K as 0.8 the structure 3, the bolt is removed and block attached to chassis by using press fit. The assemblability evaluation score, E is 89; the assembly cost ratio is 0.5. The significant improved of the of the cost ratio because the reduced number of parts.
2.7.3 The Boothroyd – Dewhurst Method
Boothyord Dewhurst method design for manufacture and assembly is the well-known DFMA method that applicable for industry. The Boothyord-Dewhurst DFMA develops by Geoffrey Boothyord and Peter Dewhurst since 1982. The methods generally applied in industry particularly U.S industry. The methodology is well known for the industry especially US industry. The term “DFMA” is actually a trademark for Boothyord Dewhurst Inc. (BDI) the companies have created and develop the DFMA concept that used for their product development, the DFMA software system.
2.7.3.1 Evaluation Procedure
All parts for product are evaluated according to the geometrical, assembly time, the theoretical part and operation cost. The information is used to calculate the design efficiency.
Theoretical part is the element to determine the possibility to eliminate or combine the parts. The theoretical part determine by answering the question (G.Boothyord, P.dewhurt, W.Knight. 1994):
i. Does the part move relative to other already assembled parts when the product working normally?
ii. Does the part have to be of other material or isolated from other already assembled parts? Only acceptable for fundamental material.
iii. Does the part has to be separate from other already assembled parts because assembly or disassembly of other parts otherwise be impossible.
For the question, which the answer for all is “no”, then the part can be considered for eliminate or integration.
For the geometrical properties analysis of the difficulty, handling and the insertion while assembly. The difficulty of handling and insertion then given the code according to matrix provide by Boothyord Dewhurst. The codes and subsequent times are used to determine a number of metric:
i. Assembly time (TM) is determining by summing the handling and insertion times.
ii. Assembly cost (CM) is proportional to TM by a factor that accounts for wage and overheads
Then the design efficiency is calculated is defined as the ideal assembly time divided by the estimated time. The ideal assembly time is given 3NM, where the 3 represents a handling time of 1.5 seconds and insertion time 1.5 second, for an ideal component. The estimated assembly time is TM
Design Efficiency =
…
Equation (1)2.7.3.2 Improvement of Product
For redesigning the parts is indicating by low value of design efficiency. For the parts elimination, the theoretical parts not necessary should be eliminating. For part with high assembly time should be redesign to better assembly operation that can shorter the assembly time.
2.7.3.3 Boothyord – Dewhurst DFMA Example
Table 2.6: Evaluating the design efficiency of the re-designed piston (Source: Redford Alan and J. Chal, 1990)
2.8 SUMMARY
Design for manufacture and assembly (DFMA) is the practice of designing products with manufacturing in mind so they can be designed in the least time with the least development cost; make the quickest and smoothest transition into production; be assembled and tested with the minimum cost in the minimum amount of time; have the desired level of quality and reliability; and satisfy customers needs and compete well in the marketplace.
DFMA considers manufacturing issues early to shorten product development time and ensure smooth transitions to manufacturing, thus, accelerating time-to-market. DFMA reduces costs since products can be quickly assembled from fewer standard parts. Parts are designed for ease of fabrication and commonality with other designs. This, in turn, means a broader product line can be created by assembling common "building blocks" modules into new products.
CHAPTER 3
METHODOLOGY
3.1 Introduction
In this chapter, project methodology will illustrate what and how methods that have been used for this project until get the result. This project is start with the project plan and project design. This project also has two parts which is the first part is the analyze and evaluate the current product (optical mouse) using Boothyord – Dewhurst Method and the second part is the come out with the proposed design by improved the existing design and redesign each part in the product and evaluate the new design with Boothyord – Dewhurst Method.
NO Yes
Figure 3.1: Project Flow Chart. CAD Drawing (detail design)
Result Result
DFMA Analysis (Existing design)
Result explanation
Data Processing DFMA Analysis
(Redesign)
Data Processing
Comparison
Accept
Report Writing Improvement
Literature Review
Conceptual Design
3.2 Literature Review
The literature review is the process of collecting information based on a given title. The information is collected through two types of source, which is primary source and secondary source. The primary sources are those that are gathered from discussions with lecturer. The secondary data or information collections are searched out from books, case studies, thesis, journals, reports and the internet.
3.3 Conceptual Design
The concept design is based on the improvement of the existing design. The existing design will go through disassemble and assemble operation for several times. For each part, the evaluation is made to determine the current design efficiency. Then from the process, come out with two or three proposed designs of the conceptual design. The concept design develops in order to achieve the objective, for ease of assembly and manufacturing.
3.4 Selection Design
3.5 CAD Drawing (Detail Design)
For the CAD drawing in this project, the detail design will be drawn using CATIA V5R19 software and the detail design will be explained through the existing design and the selected design. The drawing includes the part of the optical mouse, the assembled drawing, and the exploded drawing. Before starting with the detailed design of the concept that has been selected, overall dimension must be determined because it will be easier to draw the detail design afterwards.
3.6 DFMA Analysis
After CAD drawing process, the project will continuous with the Boothroyd Dewhurst DFMA analysis manual and simulation. For the manual DFMA the procedure must follow the step below (Geoffrey Boothroyd 1991):
i. Obtain design details
Engineering drawings, or Exploded 3-D views, or Existing product, or Prototype
ii. Take assembly apart (or imagine doing so) -- assigning identification to each part as it is removed.
Consider sub-assemblies as parts, and analyze them separately (recursively).
iii. Begin re-assembly of the product. Start with the part with the highest identification number, going all the way up to the part 1.
Fill up the assembly worksheet as you go along.
iv. Compute the design efficiency, given as:
EM = 3 x NM / TM
Table 3.1: Table for computation of Design efficiency (Source: Redford Alan, J. Chal, 1990)
3.6.1 Alpha and Beta symmetric
One of the principal geometrical design features that affects the times required to grasp and orient a part is its symmetry. Assembly operations always involve at least two component parts: the part to be inserted and the part or assembly (receptacle) into which the part is inserted. Orientation involves the proper alignment of the part to be inserted relative to the corresponding receptacle and can always be divided into two distinct operations:
ii. Rotation of the part about this axis
It is therefore convenient to define two kinds of symmetry for a part:
i. Alpha symmetry: depends on the angle through which a part must be rotated about an axis perpendicular to the axis of insertion to repeat its orientation. ii. Beta symmetry: depends on the angle through which a part must be rotated
about the axis of insertion to repeat its orientation.
Figure 3.2: Alpha & Beta rotational symmetric guideline (Source: Geoffrey Boothroyd 1991)
3.6.2 Design Guideline for Part Handling
Generally, for ease the part handling, the factors should consider are:
vii.Design parts that in those instances where the part cannot be make symmetric are obviously asymmetric.
viii. Provide features that will prevent jamming of parts that tend to nest or stack when stored in bulk.
ix. Avoid features that will allow tangling of parts when stored in bulk.
x. Avoid parts that stick together or are slippery, delicate, flexible, very small or very large or that hazardous to the handler (i.e.; parts that are sharp, splinter easily, etc)
3.6.3 Design Guideline for Insertion & Fastening
For the ease of the handling and insertion designer should attempt to:
v. Design so that there is little or no resistance to insertion and provide chamfers to guide insertion of two mating parts. Generous clearance should be provide and with care must be take to avoid clearances that will result a tendency for parts to jam or hang-up during insertion.
vi. Standardize by using common parts, processes and methods across all models and even across product lines to permit the use of higher volume processes that normally result in lower product cost.
vii.Use pyramid assembly – provide for progressive assembly about one axis of reference. Generally it is best assemble from above.
3.7 Comparison
CHAPTER 4
DFMA ANAYSIS FOR EXISTING PRODUCT
4.1 Introduction
The product case study is carried out to apply the Boothyord-Dewhurst DFMA method. The Boothyord-Dewhurst DFMA method has developed the systematic system that used for ease of assembly and manufacture. Therefore, the case study on the existing product can show the applications of the method.
4.2 Product Description
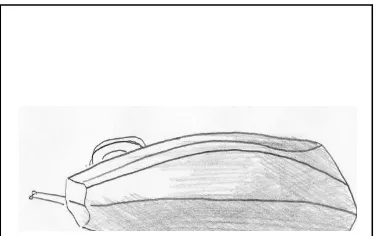
The Egg Shape optical mouse is the chosen as an existing design for Boothroyd Dewhurst DFMA method. The product description is as follows:
Figure 4.1: Optical Mouse
Figure 4.3: Middle cover of Optical Mouse
Figure 4.5: Scroll Wheel with rubber
4.3 Analysis of the existing product (Manual)
The product has gone through a disassemble process to define the assembly process sequence carried out for the product. Figure 4.7 shows the CAD drawing of the exploded view for the disassembled product.
Figure 4.7: Disassembly view for Optical Mouse .
E007-Top Cover
E006-Middle Cover
E008-Screw x 5
E004-Scroll Wheel
E003-PCB Board
E002-LED Reflector
E001-Bottom Cover (Base)
4.3.1 Assembly Flow Chart
After disassemble process, a flow chart for product was constructed to identify the process assembly of the product.
Bottom Cover (Base)
LED Reflector
PCB Board
Scroll Wheel
Scroll rubber Inspection
Middle Cover
Top Cover
Final Inspection
From the flow chart in Figure 4.8, the process assembly of the product is:
- Be full of sub-assembly 1. Assemble LED Reflector (E002) to Bottom Cover (base) (E001).
- Be full of sub-assembly 2. Place in the Scroll Rubber (E005) on the Scroll Wheel part (E004) in slot on the PCB board (E003).
- The parts will be inspected.
- After complete inspection of parts in assembly 1 and assembly 2, assemble Middle Cover (E006) to continue the process assembly. The parts will be connected by using screw.
- To complete the process assembly of the product, assemble the Top Cover (E007) to parts in assemble 3. And the parts are connected by using screws.
- The parts will go through final inspection.
A1
A2
A3
4.3.2 The Process and Material Selection
The selection of appropriate manufacturing process based on matching in the required attributed of part and process capabilities. Most component parts are not produced only with single process but require the sequence of different processes to achieve the required attributes. Combinations of various processes are necessary because the application of a single process is hard to achieve a result of the finished part attributes.
The manufacturing process can be categorized in three groups; primary process, primary/secondary processes, and tertiary process. Primary process used in reproducing the raw materials for manufacturing. The primary/secondary processes, is the process that can generate shape of part, form features of part. The tertiary consist of the finishing processes.
Figure 4.9: Process Flow for Bottom Cover (Base) Deliver to Surface Finish Process
Wait for Treat Process Operator Inspection
Drill Holes Inspection
Injection Molding Inspection
Melted Material
Delivery Raw Material to Injection Molding Inspection
Material Receive from Supplier
Debur and Painting
Inspection
Deliver to Storage Department
Figure 4.10: Process Flow for LED Reflector Deliver to Surface Finish Process Wait for Treat Process Operator Inspection
Drill Holes Inspection
Injection Molding Inspection
Melted Material
Delivery Raw Material to Injection Molding Inspection
Material Receive from Supplier
Debur and Painting
Inspection
Deliver to Storage Department
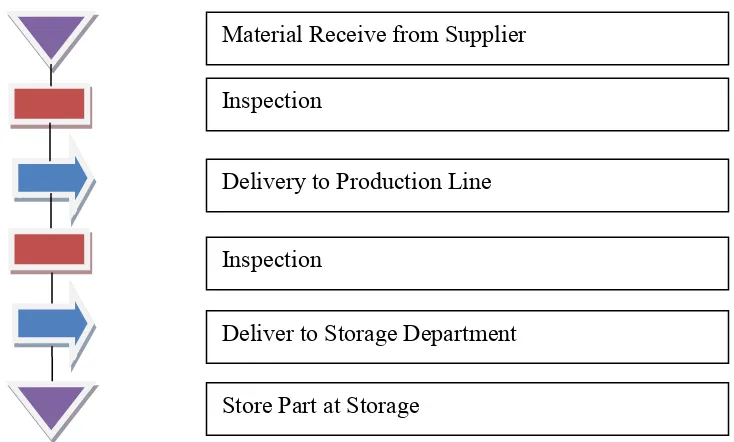
Figure 4.11: Process flow for PCB Board Material Receive from Supplier Inspection
Delivery to Production Line
Inspection
Deliver to Storage Department
Figure 4.12: Process Flow for Scroll Wheel Deliver to Surface Finish Process Wait for Treat Process Operator Inspection
Drill Holes Inspection
Injection Molding Inspection
Melted Material
Delivery Raw Material to Injection Molding Inspection
Material Receive from Supplier
Debur and Painting
Inspection
Deliver to Storage Department
Figure 4.13: Process Flow for Middle Cover Deliver to Surface Finish Process Wait for Treat Process Operator Inspection
Drill Holes Inspection
Injection Molding Inspection
Melted Material
Delivery Raw Material to Injection Molding Inspection
Material Receive from Supplier
Debur and Painting
Inspection
Deliver to Storage Department
Figure 4.14: Process Flow for Top Cover Deliver to Surface Finish Process Wait for Treat Process Operator Inspection
Drill Holes Inspection
Injection Molding Inspection
Melted Material
Delivery Raw Material to Injection Molding Inspection
Material Receive from Supplier
Debur and Painting
Inspection
Deliver to Storage Department
Figure 4.15: Process Flow for Scroll Rubber
From the process flow chart above Figure 4.9 to Figure 4.15, the symbol represent for the each process. The orange circle sign is a symbol of the operation of parts. The red square sign correspond to inspection process. The blue arrow shape, the sign represent the process of transportation, and the triangle purple sign is a symbol of storage or a delay process.
Material Receive from Supplier Inspection
Delivery to Production Line
Inspection
Deliver to Storage Department
4.3.3 Theoretical Part
Theoretical part is the element to determine the possibility to eliminate or combine the parts. All the parts are to be determined whether it is theoretical part or not. The theoretical part determine by answering the question:
i. Does the part move relative to other already assembled parts when the product working normally?
ii. Does the part have to be of other material or isolated from other already assembled parts? Only acceptable for fundamental material.
iii. Does the part has to be separated from other already assembled parts because assembly or disassembly of other parts otherwise be impossible.
Table 4.1: Theoretical part & non-theoretical part for existing design Part
No. Part Name Material Movement Separation Theoretical Part Count
E001 Bottom Cover (Base) No No Yes
E002 LED reflector Yes No Yes
E003 PCB Board Yes Yes Yes
E004 Scroll Wheel Yes Yes Yes
E005 Scroll Rubber No No No x
E006 Middle Cover No No No x
E007 Top Cover No No No x
E008 Screw No No No x
4.3.4 Alpha and Beta symmetric
Alpha and Beta symmetric is one of the principal geometrical design features that affects the times required to grasp and orient a part is its symmetry.
Table 4.2: Alpha & Beta of Optical Mouse part Part
No. Name Part Alpha Justification Beta Justification E001 Bottom Cover (Base) 360 Consider LED Reflector attach on the
body. 360 Consider LED Reflector attach on the body. E002 LED reflector 360 Due to the shape of LED 360 Due to the shape of LED E003 PCB Board 360 consider the position of electronic
component 360 Consider the position of electronic component E004 Scroll Wheel 360 Consider the position of the scroll 0 Symmetric shape
4.3.5 Handling and Insertion Time
From Table 4.1 and Table 4.2, the value of total assembly time can be defined. Thus the efficiency also can be defined by 3 multiplied with the total theoretical minimum part and divided by total operation time refer Equation 1. Table 4.3 shows all the process during to define all the value.
Table 4.3: Analyze Handling and Insertion Time
Par t ID n 0. No. or Ite m M an ual H an dli ng Code M an ual H an dli ng T ime Pe r Par t M an ual In se rtion Cod e M an ual In se rtion T ime Pe r Par t Op er at ion T ime (Sec on d) Op er at ion Cost (Pe r Se con d) Figu re For T he or etic al M in imum Par
t Name Of
Assembly
E001 1 30 1.95 00 1.5 3.45 0.00276 1 Bottom Cover E002 1 30 1.95 00 1.5 3.45 0.00276 1 LED Reflector E003 1 83 5.6 01 2.5 8.1 0.00648 1 PCB Board
E004 1 10 1.5 03 3.5 5 0.004 1 Scroll Wheel
E005 1 10 1.5 03 3.5 5 0.004 0 Scroll Rubber
E006 1 83 5.6 38 6 11.6 0.00928 0 Middle Cover
E007 1 83 5.6 38 6 11.6 0.00928 0 Top Cover
E008 5 12 2.25 38 6 41.25 0.033 0 Screw
From Table 4.3 of part analysis, the total of the parts for optical mouse is 8. The total assembly time for existing optical mouse is 56.45 second and total assembly cost for existing optical mouse is 0.04516 cents/sec. The corresponding assembly cost is 0.0008 cent per second, which count RM2.88 per hour, RM23.08 per day, and RM600.00 per month for 8 hours work time per day.
Design Efficiency = 3 x NM / TM x 100%
4.4 Analysis of the existing product (DFMA Software)
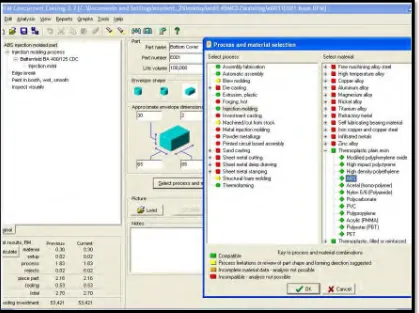
DFMA software is a combination of two complementary tools, Design for Manufacture (DFM) and Design for Assembly (DFA). By using the DFM software, the product cost of manufacturing can be defined. DFM software also can provide an easy method for comparing analysis of manufacturing processes and material selection. Meanwhile DFA software is used to reduce the complexity of a product by consolidating parts into elegant and multifunctional designs resulting in significant cost saving.
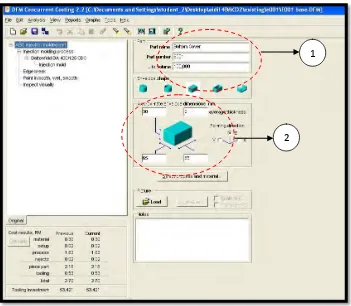
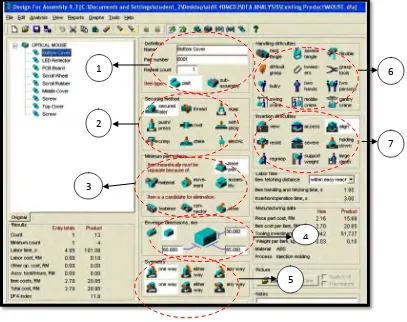
[image:85.612.152.503.359.665.2]4.4.1 Design for Manufacture (DFM)
Figure 4.16: Example DFM Software for Bottom Cover Part
1
Figure 4.16 is an example process to analyze the cost for bottom cover part manufacturing process. At part number 1, the part name and part number is inserted in the columns specified. For part number 2, sizes for bottom cover part need to be inserted in the columns specified.
Figure 4.17: Process and Material Selection
Figure 4.18: Add Process
Table 4.4: DFM Software Concurrent Costing Totals
Table 4.5: Totals Costing per Part of each part Part No. material cost (RM) setup cost (RM) process cost
(RM) Rejects (RM)
tooling cost (RM) total cost (RM)
E001 0.3 0.02 1.83 0.02 0.53 2.7
E002 0.02 0.02 1.14 0.01 0.72 1.9
E003 0.04 0.02 1.67 0.01 0.77 2.51
E004 0.11 0.02 1.57 0.01 1.08 2.79
E005 0.02 0.02 1.49 0.01 0.82 2.35
E006 0.3 0.02 1.83 0.02 0.53 2.7
E007 0.23 0.02 1.43 0.01 0.73 2.42
E008 0 0 0.69 0 0 0.7
Total 18.07
4.4.2 Design for Assembly (DFA)
Figure 4.19: Example DFA analysis for Part
Figure 4.19 is an example process to analyze the assembly cost for part in Optical Mouse. The figure shows the process need to be inserted for bottom cover part assembly process. At part number 1, the part name and part number is inserted in the specified columns. For part number 2, a securing method is identified. For the bottom cover, securing method has been chosen is secured later because the bottom cover is the base in optical mouse. For item in part number 3, is a minimum part criterion. For bottom cover, the base part has been selected for minimum part criterion. For part number 4, is to envelope dimension. For this item, the dimension is imported from the DFM process. Part number 5 is an item of symmetry. To complete this item, Alfa and
1
2
3
4
5
Beta for all parts needs to be identified. For bottom cover, the Alfa and Beta is 360 degree. From that one way has been selected in symmetry item. Part number 6 is an item of handling difficulties. For the bottom cover, not handling difficult process when assemble this part. For part number 7, the item is an insertion difficulty. For bottom cover example, align has been chosen because when assembly the part was easy to insert.
Table 4.6: Executive Summary for DFA
Table: 4.7: Total Analysis for DFMA
From the DFM and DFA software analysis, the total result of DFMA had been contained. Table 4.8 shows the DFMA result.
Table 4.8: DFMA summary result
The result found by using DFMA is the total cost for manufacturing items and the total cost per product. The total manufacturing items result is RM 20.85 and total cost per product is RM 20.94.
Design Efficiency = 3 x NM / TM x 100%
CHAPTER 5
CONCEPTUAL DESIGN
5.1 Introduction
5.1.1 Proposed Design
[image:95.612.226.415.483.601.2]Concept 1
Figure 5.1: Concept 1 Isometric view Figure 5.2: Concept 1 Plan View
Figure 5.4: Snap Fit Mechanism
Concept 2
Figure 5.5: Concept 2 Isometric View
[image:97.612.256.397.357.557.2]Figure 5.7: Concept 2 Side View
Figure 5.8: Lock mechanism
[image:98.612.230.433.321.539.2]Concept 3
Figure 5.9: Concept 3 Isometric View
[image:99.612.237.448.421.638.2]Figure 5.11: Concept 3 Side View
For the third concept, the design is similar with a mobile phone. The shape of the design is flat. For the mechanism, the design uses a sliding system. The mechanism of the design is shown in Figure 5.11.
5.1.2 Selection Design
Table 5.1: Pugh’s concept selection method
Needs Concept 1 Concept 2 Concept 3 Datum
No need for any mouse pad 4 3 3 1
Comfortable to use 3 4 4 2
Attractive design 5 3 3 2
Easy to assemble 5 2 2 1
sharp characterized appearance 2 2 2 4
Modern and smooth shape 4 3 3 4
Total Scoring / (30) 18 17 17 14
5.2 Detail drawing
[image:103.612.129.517.166.487.2]5.2.1 Drawing Design for Existing Design
Figure 5.13: Bill of Material Existing Design
5.2.2 Drawing Design for New Design
Figure 5.14: Bill of Material New Design
CHAPTER 6
DFMA ANAYSIS FOR NEW DESIGN
6.1 Introduction
The product new design is carried out by applying the Boothyord-Dewhurst DFMA method. The Boothyord-Dewhurst DFMA method has developed the systematic system that is used for the ease of assembly and manufacturing. Therefore, the case study on the new design can show the applications of the method.
6.2 Analysis of the New Design (Manual)
Figure 6.1: Disassembly view for New Design Optical Mouse
(N001) Bottom Cover (N005) Top Cover
(N003) PCB Board