Iranian Journal of Fisheries Sciences 16(4) 1187-1203 2017
Osmotic dehydration of anchovy fillets in salt solution:
Optimization by using statistical experimental design
Yildiz Z.
*Received: May 2015 Accepted: April 2016
Abstract
Anchovy fillets that had undergone osmotic dehydration and response surface methodology (RSM) were used to determine the influence and optimal values of the process variables. Also the optimal processing conditions were determined in order to reduce the solid gain and water loss ratio (SG/WL) and firmness for the anchovy fillets. A three-level central composite rotatable design (CCRD) involving the variables such as temperature (20-45°C), processing time (19-221 min) and salt concentration (12-28%, w/w) were developed for this purpose. Data obtained from RSM analysis on the SG/WL and texture property of anchovy fillets were subjected to the analysis of variance (ANOVA) and they were analyzed using a second-order polynomial equation which resulted in the optimum process levels.
Keywords: Osmotic dehydration, Anchovy, Central composite rotatable design,
Response surface methodology
Department of Energy Systems Engineering, Technology Faculty, Mersin University, Turkey *
Corresponding author's Email: [email protected]
1188 Yildiz, Osmotic dehydration of anchovy fillets in salt solution: Optimization by using statistical ...
Introduction
Osmotic dehydration is a water removal process by soaking cellular materials in a hypertonic solution such as concentrated sugar syrup, salt or ternary solutions. Two main counter-current flows during osmotic dehydration are the flow of water out of the food into the solution and a simultaneous transfer of solute from the solution into the food. Osmotic dehydration is used as a pretreatment for many processes used to improve nutritional, sensorial and functional properties of food without changing its integrity (Torrengiani, 1993; Madamba, 2003). It is generally applied as a pretreatment before drying processes, and it also increases sugar to acid ratio, and improves texture and stability of pigments during dehydration and storage (Raoult-Wack, 1994). It is quite effective at around ambient temperatures, so heat damage to texture, colour and flavour can be minimized (Torrengiani, 1993). Moreover, osmotic dehydration is proven to be an energy efficient method for partial dehydration, since there is no need for a phase change. There are various studies available in literature on the osmotic dehydration of fishes (Taheri et al., 2011; Corzo and Gomez, 2004; Corzo et al., 2007).
It is a significant problem for the aquatic food product sector to preserve the left over aquatic food products for a long time after the consumption of fresh products. For the storage of fresh aquatic food product there are various drying techniques so that they can be
stored for a long time and not decompose. These include hot air drying, osmotic dehydration, vacuum drying, solar drying, microwave drying and freeze-drying. Osmotic dehydration processes are known to improve the quality of the food product and produce a better outlook in the dried products. On the other hand the osmotic dehydration process shortens the drying time and the drying potential increases. Low-cost, crispy, fluffy, porous, and a long shelf life products can be obtained by the osmotic dehydration. On an industrial scale with osmotic dehydration drying, process parameters for production should be optimized at lower cost. For this reason, the anchovy of the Black Sea region were dried by osmotic dehydration treatment under optimum conditions. Anchovy are very common in the Black Sea region of Turkey and are famous in any other parts of Turkey. The Black Sea region is very important for anchovy production and more than half of the total anchovy production in Turkey is caught almost completely from the Black Sea region.
Osmotic dehydration process was designed according to Response Surface Methodology (RSM). RSM combines mathematics with statistics for designing experiments, building models, evaluating the controlling factors and determining optimum processing conditions. Several factors can be simultaneously varied in this method. The multivariable approach reduces the number of experiments,
Iranian Journal of Fisheries Sciences 16(4) 2017 1189 improves statistical interpretation
possibilities, and evaluates the relative significance of several affecting factors even in the presence of complex interactions. It is usually employed for multiple regression analysis using quantitative data obtained from properly designed experiments to solve multivariable equations simultaneously. There are several works that have been carried out on the optimization by using RSM (Mudahar et al. 1989; Corzo and Gomez, 2004; Uddin et al., 2004; Eren and Ertekin 2007; Singh et al., 2007, 2008; Taheri et al., 2011). However, no information was found on the statistical modeling of osmotic dehydration of the anchovy. Hence the present work aimed to model the solid gain and water loss ratio (SG/WL) and firmness as a function of the process variables and to find the optimum operating conditions that maximize the water loss to solid gain ratio and minimize firmness according to control pattern using RSM.
Materials and methods
Sample preparation
Fresh anchovy (European anchovy in the Black Sea) were purchased from a local fisherman. Anchovies were 7-8 cm long and weighed 5-6 g/fish. Anchovies were thoroughly washed with water to remove adhering and other debris. Then they were manually filleted with stainless steel knives and then the fillets were cut into fillets from the muscle nearest to the head, thus obtaining two fillets per fillet.The samples were fillets with an average
length of 5±0.5 mm, average width of 1.5±0.5 mm, and average thickness of 0.2±0.1 mm. The average moisture content of the anchovy was found to be 68.9% on a wet basis. As the osmotic agent, marina salt was used. The osmotic solution is prepared by mixing the salt with proper amount of distilled water. The maximum peak force that was chosen as a measurement of firmness was 4.309 N. The value is based on average values of ten replicates.
Experimental design and statistical analysis
Response surface methodology (RSM) was used to estimate the effects of osmotic dehydration process tomodel the solid gain and water loss ratio (SG/WL) and texture property of anchovy fillets. A three level central composite rotatable design (CCRD) design was used with temperature (20-45°C), processing time (19-221 min) and salt concentrations (12-28%, w/w) as the independent process variables (Table 1). Hence for the generated 20 experiments, RSM was applied to the experimental data using DX6 software.
1190 Yildiz, Osmotic dehydration of anchovy fillets in salt solution: Optimization by using statistical ...
Table 1: Codes and actual levels of the independent variables for design of experiment.
Inpendent variables Symbols Codes levels
-α -1 0 1 α
Temperature (oC) A 19,88 25 32,50 40 45,11
Processing time (min) B 19,09 60 120 180 220,91 Salt concentration (w/w.%) C 11,59 15 20 25 28,41
Experimental procedure
The osmotic dehydration experiments were carried out in a 500 mL Erlenmeyer flask, which was placed in a thermostatically controlled water bath shaker. Anchovy fillets were weighed, and the samples were then placed into dehydrating flasks containing salt solution of varying concentrations (12-28%) and the flasks were placed into the water bath at desired constant temperature. The solution to sample ratio was constant at 20:1. At each sampling time (19-221 min), the anchovy fillets were taken out of the solution and then gently blotted with adsorbent paper and weighed. The effect of temperature was also investigated and the experiments were conducted between temperatures 20 and 45°C. The average moisture and dry matter content of the samples were determined by drying at 105°C for 24 hours in a convection oven. In each of the experiments fresh osmotic solution was used. All the experiments were done in 5 replicates and the average value was taken for calculations. Mixing was necessarily done in order to improve mass transfer, maintain uniform concentration, temperature profile and prevent the formation of a dilute solution film around the samples.
For each experiment the agitation speed of 200 rpm was used and maintained constant.
Water Loss (WL) was expressed as the net water loss from the fresh sweet potato sample after osmotic dehydration, based on initial sample mass; Solid Gain (SG) was defined as the net uptake of solids by the anchovy sample based on initial sample weight, according to the following Equations 1 and 2:
( ) (1)
(2)
where ww0, ws0 and w0 are the initial
mass of water, solids and the initial wet mass of the sample, respectively. The total solids mass (ws) is determined in a oven at 105°C for 24 h, and the total wet mass (wt), is the mass of the anchovy fillets at the time of sampling, determined upon removal from the solution.
Maximum water loss and minimum solid gain are desired in order to increase process efficiency of osmotic dehydration of anchovy fillets. On the other hand, the water loss is much higher than solid gain. Since the optimum response of each variable (higher WL and lower SG) did not fall exactly in the same point, the solid
Irnaian Journal of Fisheries Sciences 16(4) 2017 1191 gain/water loss ratio (SG/WL) was used
as a marker of the extent to which the osmotic process succeeds this object (Barbosa et al., 2004).
Textural measurements
One of common shear tests involves a Warner Bratzler or knife blade to cut the sample while measuring the maximum force. For this reason, the texturometer Stable MR hosystems Texture Technologies Texture Analyzer TA-XT2i was used to determine the share force at midpoint of each fillet of each group using Warner-Bratzler shear blade. A v-shaped blade was assembled to the TA.XT2i Texture Analyser. The blade was set to travel 30 mm beyond the point of the 1st contact with the sample; this was sufficient to perform complete shear of the sample. The samples were positioned so that the blade cut the sample block in half, perpendicular to the orientation of muscle fibers. The probe performed a single cut before returning to the start position. Downward probe speed was 2mm/s with a 5g force trigger to commence recording, the maximum peak force (N) required to shear through the sample was recorded as shear force. The maximum peak force (N) was chosen as a measurement of firmness. All reported results are based on average values of five replicates.
Response surface methodology modeling
In order to obtain high levels of water loss, osmotic dehydration should be
conducted at elevated temperatures and low times, but the increase in solid gain is expected in this case. If it is aimed to minimize the solid gain, lower temperatures and concentrations should be used preferably. However, in this case, very long processing times arerequired to reach the desired amount of water removal. Therefore, process parameters should be optimized for desired final product characteristics. RSM was used to analyze the controlling process factors and to determine the optimum process parameters for the osmotic dehydration of the anchovy fillets. Processing time, temperature and salt concentration are the three significant operating parameters affecting the osmotic dehydration of the anchovy fillets that considerably control the firmness and SG/WL. For this reason, a three-level CCRD experimental design was used. The three input variables are temperature (20-45⁰C), processing time (19-221 min) and salt concentration (12-28%, w/w). The five levels chosen were-α, -1, 0, 1 and α as shown in Table 1. The correct spacing for the axial parameter (α) is chosen for the CCRD experiment design.
√ (3)
Where 2k is the number of factorial points. It is α=1.68 for our experimental design (input variables, k=3). The input variables and their ranges were selected on the basis of the preliminary experiments avoiding that any experimental point get burn. The experimental design consisted of a total
1192Yildiz, Osmotic dehydration of anchovy fillets in salt solution: Optimization by using statistical ... of 20 experimental runs (n=2k+2k+m,
n=total experimental points, k=3 and central point, m=6) which included eight factorial points, six axial points, and six replicated central points as shown in Table 2.
The selected independent variables and their ranges for the optimization studies of the solid gain and water loss ratio (SG/WL) and firmness as a textural property of anchovy fillets were chosen as temperature (20-45°C), processing time (19-221 min) and salt concentration (12-28%, w/w). The dependent variables were the solid gain and water loss ratio (SG/WL) and maximum share force. Table 1 shows the three independent variables (temperature, processing time and salt concentration) at different coded levels of the variables employed in the design matrix.
Therefore, second order mathematical models describing the relationships among the process-dependent and the independent variables were developed. Coding of the variables was done according to the following equation: e X X b X b X b b
Y i j
k j ij k j ij k i k İ i ij i
i
1 1
2
0 (4)
Where, i and j are the linear and quadratic coefficients, b is the regression coefficient, k is the number of factors studied and optimized in the experiment, and e is the random error. Quality of the fit of the second-order equation was expressed by the coefficient of determination R2 and its statistical significance was determined by the F-test. The coefficients of the
equations were determined by employing DX6 software. Analysis of variance (ANOVA) for the final predictive equation was done using DX6 software. The response surface equation was optimized for maximum yield in the range of process variables using DX6 software.
Results
RSM modeling
The results of the different runs of the osmotic dehydration the solid gain and water loss ratio (SG/WL) and firmness of the anchovy fillet are shown in Table 2. An analysis of variance was conducted to determine the significant effects of process variables on each response. The p-values were used as a tool to check the significance of each of the coefficients, which are necessary to understand the pattern of the mutual interactions between the independent variables. Values of p less than 0.0001 indicate that the model terms are significant. Table 2 shows that some process variables were found to be statistically significant for output data at p<0.0001. All process variables had a significant effect on the osmotic dehydration of the textural property of the anchovy fillet.
Iranian Journal of Fisheries Sciences 16(4) 2017 1193 The corresponding second-order
response models were assembled for
each response as follows:
Y1=0.44-0.22A+0.009B+0.049C+0.10AB+0.13AC-0.054BC (5)
Y2=6.94+1.44A+1.11B+0.44C-2.31A2-0.17B2-0.55C2+1.26 AB+0.45AC-0.311BC (6)
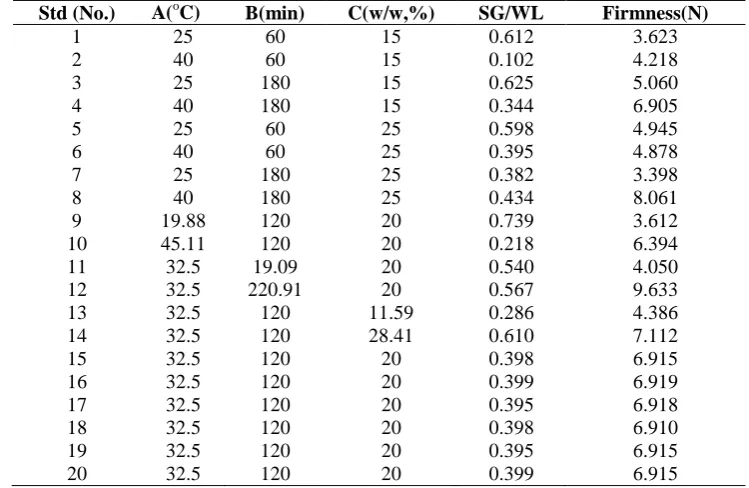
Table 2: Three-level central composite design and the experimental responses of dependent variable .
Std (No.) A(oC) B(min) C(w/w,%) SG/WL Firmness(N)
1 25 60 15 0.612 3.623
2 40 60 15 0.102 4.218
3 25 180 15 0.625 5.060
4 40 180 15 0.344 6.905
5 25 60 25 0.598 4.945
6 40 60 25 0.395 4.878
7 25 180 25 0.382 3.398
8 40 180 25 0.434 8.061
9 19.88 120 20 0.739 3.612
10 45.11 120 20 0.218 6.394
11 32.5 19.09 20 0.540 4.050
12 32.5 220.91 20 0.567 9.633
13 32.5 120 11.59 0.286 4.386
14 32.5 120 28.41 0.610 7.112
15 32.5 120 20 0.398 6.915
16 32.5 120 20 0.399 6.919
17 32.5 120 20 0.395 6.918
18 32.5 120 20 0.398 6.910
19 32.5 120 20 0.395 6.915
20 32.5 120 20 0.399 6.915
Where A is temperature, B is processing time and C is salt concentration. Results of the experimental studies are represented in Table 2. Based on the experimental responses, Y1 was produced from the
solid gain and water loss ratio (SG/WL) data ranged between 0.102 and 0.739 and Y2 from the data of firmness ranged
between 3.398 and 9.633 N. As a result, Runs 7 and 11 had the maximum and minimum SG/WL, Runs 5 and 12 had the maximum and minimum firmness, respectively.
The ANOVA results of the quadratic regression models for Y1 and Y2 are
reported in Table 3. Models with the F-values of 12.47 and 7.49 for Y1 and Y2
imply that the models suggested are significant. There is only a 0.01% chance that an "Y1 Model F-Value" this
large could occur due to noise. On the other hand, there is only a 0.21% chance that an "Y2 Model F-Value" this
large could occur due to noise. The Fisher F-test with a very low probability value (P-model>F=0.05) demonstrates a very high significance for the regression models. The goodness of fitting of the models was checked by the determination coefficient, R2. Table 3 also shows that the SG/WL experimental results of the fitted the factor interaction (2FI) model was quite well as indicated by high R2 values (0.8520).
1194Yildiz, Osmotic dehydration of anchovy fillets in salt solution: Optimization by using statistical ...
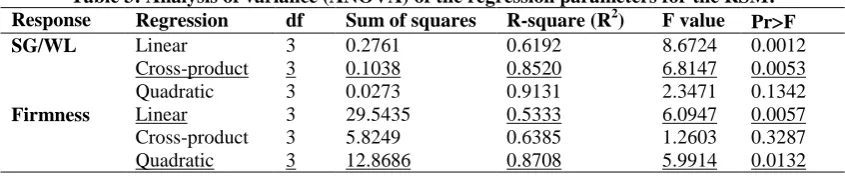
Table 3: Analysis of variance (ANOVA) of the regression parameters for the RSM.
Response Regression df Sum of squares R-square (R2) F value PrResponse F
SG/WL Linear 3 0.2761 0.6192 8.6724 0.0012
Cross-product 3 0.1038 0.8520 6.8147 0.0053
Quadratic 3 0.0273 0.9131 2.3471 0.1342
Firmness Linear 3 29.5435 0.5333 6.0947 0.0057
Cross-product 3 5.8249 0.6385 1.2603 0.3287
Quadratic 3 12.8686 0.8708 5.9914 0.0132
The cubic model is aliased.
However, the firmness experimental results of the fitted the second-order polynomial (quadratic) model was quite well as indicated by high R2 values (0.8708).
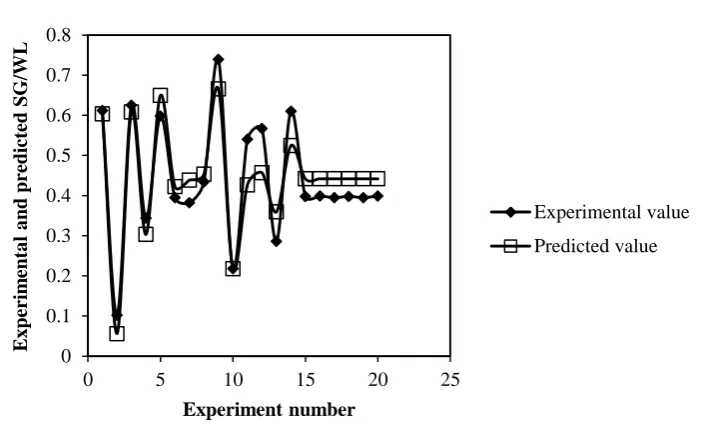
The plots of the experimental values of the SG/WL values against the predicted values by Eq. (5) are shown in Fig.1, while the experimental values of firmness value against the predicted values by Eq. (6) are shown in Fig. 2. It is clear that the observed values were in good agreement with the predicted ones. Hence, statistically significant multiple regression relationships between the independent variables and the response variables (Y1 and Y2) were
obtained. The models showed a good fit and effectively represented the relationship among the parameters selected. An F-value several times higher than the tabulated F-value means that the model predicted the experimental results quite well and the estimated factors effects were real. The regression coefficients of the SG/WL model with their corresponding
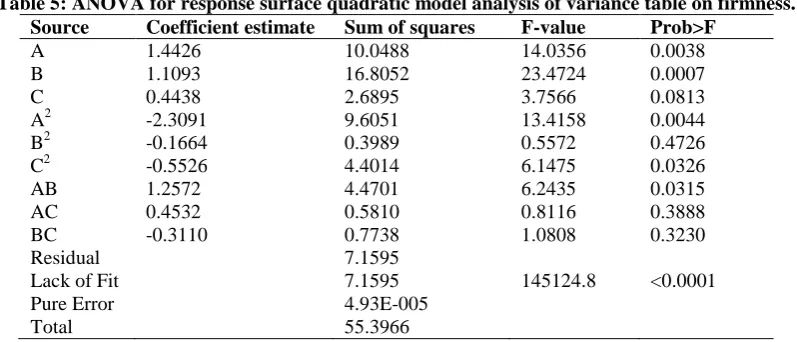
p-values are given in Table 4. It can be deduced that A, C, AB and AC are the significant model terms from these values. The regression coefficients, along with the corresponding p-values, for the model of firmness are described
in Table 5. In this case A, B,A2, C2 and AB are significant model terms.
Values of "Prob>F" less than 0.0500 indicate that the terms of the model suggested are significant. Therefore, the values higher than 0.1000 indicate the model terms are not significant. Analysis of variance (ANOVA) results of the models are shown in Table 3, indicating a good model performance (with an R2 value of 0.8520 and an F value of 6.8147 for SG/WL; with an R2 value of 0.8708 and an F value of 5.9914 for firmness) among linear, quadratic, cross-product, and cubic model. Interactions among the variables are not negligible. The R2 is one of the measures of degree of fit of a model. Tables 4 and 5 show the results of the residual that is not only the difference between the experimental data and the predicted values but also the experimental error as well as mathematical models errors. Errors resulting from the mathematical model are called the model incompatibility (Lack of fit).
Iranian Journal of Fisheries Sciences 16(4) 2017 1195
Figure 1: Comparison between experimental and predicted SG/WL.
Figure 2: Comparison between experimental and predicted firmness.
Table 4: ANOVA for response surface quadratic model analysis of variance table on SG/WL.
Source Coefficient estimate Sum of squares F-value Prob>F
A -0.2239 0.2421 47.6726 < 0.0001
B 0.0090 1.115E-003 0.2196 0.6478
C 0.0491 0.0330 6.4908 0.0245
AB 0.1017 0.0293 5.7667 0.0323
AC 0.1345 0.0512 10.0832 0.0074
BC -0.054 0.0233 4.5942 0.0520
Residual 0.0660
Lack of Fit 0.0660 2379.567 < 0.0001
Pure Error 1.73E-005
Total 0.4460
0 0.1 0.2 0.3 0.4 0.5 0.6 0.7 0.8
0 5 10 15 20 25
E
x
perim
ent
a
l
a
nd
predict
ed
SG
/WL
Experiment number
Experimental value Predicted value
0 2 4 6 8 10 12
0 10 20 30
E
x
perim
ent
a
l
a
nd
predict
ed
firm
nes
s
Experiment number
Experimental value Predicted value
1196Yildiz, Osmotic dehydration of anchovy fillets in salt solution: Optimization by using statistical ...
Table 5: ANOVA for response surface quadratic model analysis of variance table on firmness.
Source Coefficient estimate Sum of squares F-value Prob>F
A 1.4426 10.0488 14.0356 0.0038
B 1.1093 16.8052 23.4724 0.0007
C 0.4438 2.6895 3.7566 0.0813
A2 -2.3091 9.6051 13.4158 0.0044
B2 -0.1664 0.3989 0.5572 0.4726
C2 -0.5526 4.4014 6.1475 0.0326
AB 1.2572 4.4701 6.2435 0.0315
AC 0.4532 0.5810 0.8116 0.3888
BC -0.3110 0.7738 1.0808 0.3230
Residual 7.1595
Lack of Fit 7.1595 145124.8 <0.0001
Pure Error 4.93E-005
Total 55.3966
Ideally, lack of fit for the mathematical models is statistically insignificant, whileon the other hand it should be significant for regression model. Lack of fit tests of the study are shown in Tables 6 and 7.
The table 6 for SG/WL shows that the lack of fit F-value of 2379.57 implying that the Lack of Fit is significant. There is only a 0.01% chance that a lack of fit F-value this large could occur due to noise. A significant lack of fit is not good, but the selected model showed a lack-of-fit. Fig. 1 shows the experimental results of the selected model to fit. Table 7 for firmness showed that the the lack of fit F-value of 145124.82 implies the lack of fit is significant. There is only a 0.01% chance that a Lack of Fit F-value this large could occur due to noise, however the selected model had an insignificant lack-of-fit. Experimental results of the Selected model to fit had an insignificant lack-of-fit as shown (Fig. 2).
Discussion
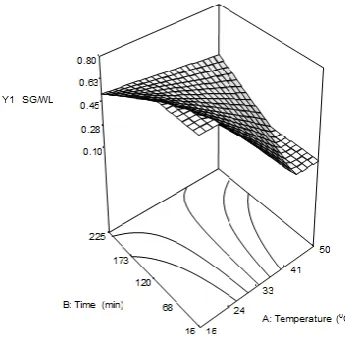
The response surface curves were plotted to understand the interaction of the variables and to determine the optimum level of each variable for maximum response. The curves for SG/WL and firmness are shown in Figs. 3 to 8. The elliptical shape of the curves is an indication of a good interaction and circular shape is an indication of no interaction between the variables. From these figures, it can be clearly seen that the elliptical nature of the contours in 3D-response surface plots depict the mutual interactions of all the variables. Also, significant interaction between every two variables, and the presence of the maximum predicted yields as indicated by the surface confined in the smallest ellipse in the contour diagrams were recorded.
Iranian Journal of Fisheries Sciences 16(4) 2017 1197
Table 6:Lack of Fit Tests for the osmotic dehydration of anchovy fillet on SG/WL.
Source Sum of squares DF Mean square F-value Prob>F
Linear 0.169803 11 0.015437 4452.885 < 0.0001
2FI 0.065993 8 0.008249 2379.567 < 0.0001
Quadratic 0.038719 5 0.007744 2233.769 < 0.0001 Pure Error 1.73E-05 5 3.47E-06
Table 7: Lack of Fit Tests for the osmotic dehydration of anchovy fillet on firmness.
Source Sum of squares DF Mean square F-value Prob>F
Linear 25.85299 11 2.350272 238203.2 < 0.0001 2FI 20.02813 8 2.503516 253734.8 < 0.0001 Quadratic 7.159491 5 1.431898 145124.8 < 0.0001 Pure Error 4.93E-05 5 9.87E-06
Water loss to solid gain ratio
The magnitude of P and F values in Table 4 indicates the maximum positive contribution of salt concentration and processing time, on the other hand thetemperature negative contribution of solution to sample ratio on the water loss during osmotic dehydration. It implies decreased SG/WL with increase in temperature because the accumulation of salt on the fillet surface and the simultaneous moisture removal were accelerated when temperature increased (Fig. 3). On the other hand increased SG/WL increased with processing time and salt concentration and this is clearly depicted (Figs. 4 and 5).
Increase in solids gain/water loss ratio (SG/WL) was observed with increase in salt concentration, while at low salt concentration the ratio showed a decrease, this as observed by Barbosa
et al. for osmotic dehydration process of carrot (Barbosa et al., 2004). Similar results were found by both Boudhrioua
et al. (2007) and Gallart et al. (2009)
when drying salmon fillets. Increased concentrations of salt and decrease in moisture contents on fillet surface were observed for drying conditions. The authors reported that the moisture loss and salt uptake increased with the increase of salt concentration (Gallart et al., 2007; Boudhrioua et al., 2009). The terms salt concentration and processing time have a positive effect and temperature has negative effect on SG/WL. Values of "Prob>F" less than 0.0500 indicate model terms are significant. In this case, A, C, A-C and A-B are significant model terms.Values of "Prob>F" greater than 0.1000 indicate the model terms are not significant. For this reason, the B-C interaction and C terms for SG/WL were eliminated. Furthermore, the interactions of A-B and A-C have positive effecton SG/WL.
1198Yildiz, Osmotic dehydration of anchovy fillets in salt solution: Optimization by using statistical ...
Figure 3: 3D plot of the combined effect of the temperature and processing time on SG/WL.
Figure 4: 3D plot of the combined effect of the temperature and salt concentration on SG/WL.
Figure 5: 3D plot of the combined effect of the salt concentration and processing time on SG/WL.
Irnaian Journal of Fisheries Sciences 16(4) 2017 1199
Texture measurement
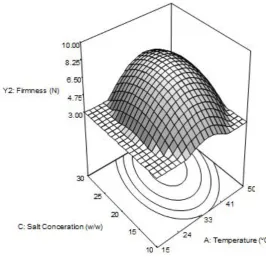
The linear effects of three variables show positive effect on firmness. It implies increased firmness with increase of three process variables (Figs. 6 to 8). The quadratic term of processing time, temperature and salt concentration have positive effects. Similar results were reported by Corzo
et al. (2006) for osmotic dehydration of sardine sheets where firmness increased with increasing dehydration time, salt concentration, and temperature. The authors reported that the firmness increased nonlinearly with time at all concentrations and temperatures (Corzo
et al., 2006).
Several authors explained that higher salt concentrations, and protein denaturation are more important, leading to higher moisture release (Gallart et al., 2007; Heredia et al.,
2007; Boudhrioua et al., 2009). Higher salt concentration leads to changes in texture due to reduced water holding capacity and more protein denaturation and hence a harder product indicating that the amount of the muscle swelling depends on the salt concentration. Hardness increased and elasticity decreased with increasing salt concentration. Higher salt concentration near the surface, resulted in a higher maximum force in the texture analysis. RSM shows that values of "Prob>F" less than 0.0500 indicate model terms are significant. In this case A, B, A-B, A2 and C2 are significant model terms.
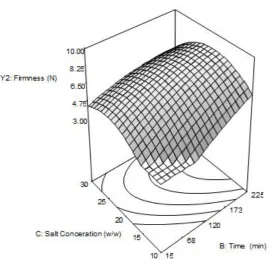
Values greater than 0.1000 indicate the model terms are not significant. The interactive effect of A-B has positive effect (Table 5). The second-order term of A2 and C2 gave significant negative effects on firmness of the anchovy fillets. The studies of the contour plot (Figs. 6 to 8) also reveal the optimum region of the process conditions for the osmotic dehydration of the anchovy fillets.
Optimum condition for osmotic dehydration
Optimum condition for osmotic dehydration of the anchovy fillets was determined to obtain maximum SG/WL and minimum firmness. Regression models Eq. (5 and 6) were used to determine the optimum processing conditions for osmotic dehydration of the anchovy fillets. The values of independent variables (A, B, C) were determined and response was calculated at the optimum point. In order to get these optimum values, first the partial derivatives of the regression Eq. (5 and 6) were obtained with respect to A, B and C, respectively, and They were set to zero to get the two equations. The optimum values obtained by substituting the actual values of variables are for SG/WL: 31.4°C (temperature), 149 min (processing time) and 22.86 w/w (salt concentration). At this point, SG/WL was calculated as 0.465.
1200Yildiz, Osmotic dehydration of anchovy fillets in salt solution: Optimization by using statistical ...
Figure 6: 3D plot of the combined effect of the temperature and processing time on firmness.
Figure 7: 3D plot of the combined effect of the temperature and salt concentration on firmness.
Iranian Journal of Fisheries Sciences 16(4) 2017 1201
Figure 8: 3D plot of the combined effect of the processing time and salt concentration on firmness.
The optimum processing conditions for
firmness of the anchovy fillets were
43.34°C (temperature), 97.7 min (processing time) and 20.27 w/w (salt
concentration); and predicted firmness
value at the optimum point was 5.691
N.
Generally, in this study, RSM was
used to determine the optimum
operating conditions that yield
maximum SG/WL and minimum
firmness in osmotic dehydration of the anchovy fillets. Analysis of variance
has shown that the effects of all the
process variables including
temperature, time and salt concentration
were statistically significant. The
models were obtained for predicting
SG/WL and firmness. The optimum
conditions were found to be:
temperature 31.4-43.34°C, processing time 97.7-149 min and salt
concentration 20.27-22.86%. At these
optimum values, SG/WL and firmness
were found to be 0.465 and 5.691 N,
respectively.
References
Barbosa, J.L., Alves, D.G., El-Aouar,
Â.A., Araujo, É.A.F. and Murr,
F.E.X.,2004. Osmotic dehydration
of carrot (daucus carota l.) using
sodiumchloride solution. Drying
2004 – Proceedings of the 14th
International Drying Symposium
(IDS 2004), C, pp. 1992-1997
Boudhrioua, N., Djendoubi, N.,
Bellagha, S. and Kechaou, N.,
1202Yildiz, Osmotic dehydration of anchovy fillets in salt solution: Optimization by using statistical ...
2009.Study of moisture and salt
transfers during salting of sardine
fillets. Journal of Food Engineering,
94, 83–89.
Corzo, O. and Gomez, E.R., 2004. Optimization of osmotic dehydration
of cantaloupe using desired function
methodology. Journal of Food
Engineering, 64, 213–219.
Corzo, O., Bracho, N. and Marva,
l.J., 2006. The use of fractional
conversion technique on firmness
change kinetics of vacuum pulse
osmotic dehydration sardine sheets.
Journal of Food Engineering, 73,
358–363.
Corzo, O., Bracho, N., Rodrı´guez, J.
and Gonza´lez, M., 2007.
Predicting the moisture and salt
contents of sardine sheets during
vacuum pulse osmotic dehydration.
Journal of Food Engineering, 80,
781–790
Eren, I. and Ertekin, F.K., 2007.
Optimization of osmotic dehydration
of potato using response surface
methodology. Journal of Food Engineering, 79, 344–352.
Gallart-Jornet, L., Barat, J.M.,
Rustad, T., Erikson, U., Escriche,
I. and Fito, P., 2007. Influence of
brine concentration on Atlantic
salmon fillet salting. Journal of
Food Engineering, 80, 267–275.
Heredia, A., Andres, A., Betoret, N.
and Fito, P., 2007. Application of
the SAFES (systematic approach of
food engineering systems)
methodology to salting, drying and
desalting of cod. Journal of Food
Engineering, 83, 267–276.
Madamba, P.S., 2003. Thin layer
drying models for osmotically
predried young coconut. Drying
Technology, 21, 1759-1780.
Mudahar, G.S., Toledo, R.T., Floros,
J.D. and Jen,J.J., 1989.
Optimization of carrot dehydration
process using response surface
methodology. Journal of Food
Science, 54, pp.714-719.
Raoult-Wack, A.L., 1994. Advances
in osmotic dehydration. Trends in
Food Science Technology, 5, pp. 255–260.
Singh, B., Panesar, P.S., Gupta, A.K.
and Kennedy, J.F., 2007.
Optimization of osmotic dehydration
of carrot cubes in sugar-salt
solutions using response surface
methodology. European Food
Research Technology, 225, 157–165.
Singh, B., Panesar, P.S., Nanda, V.
and Bera, M.B., 2008. Optimization
of osmotic dehydration process of
carrot cubes in sodium chloride
solution. International Journal of
Food Engineering, 4, 1-24.
Taheri, A., Kenari, A.A.,
Motamedzadegan, A. and Rezaie,
M.H., 2011, Optimization of
goldstripe sardine (Sardinella
gibbosa) protein hydrolysate using
Alcalase® 2.4Lby response surface
Irnaian Journal of Fisheries Sciences 16(4) 2017 1203 methodology, CyTA. Journal of
Food, 9(2), 114-120.
Torrengiani, D., 1993. Osmotic
dehydration in fruits and vegetable
processing. Food Research International, 26, 59 – 68.
Uddin, M.B., Ainsworth, P. and
Ibanoglu, S., 2004. Evaluation of
mass exchange during osmotic
dehydration of carrots using
response surface methodology.
Journal of Food Engineering, 65,
473–477.