*
Corresponding author:[email protected] 46
Vol. 13, No. 2 (Spring 2016), IAChE
Prediction of Red Mud Bound-Soda Losses in Bayer Process
Using Neural Networks
M. Mahmoudian1, A. Ghaemi2*, H. Hashemabadi1
1 Iran Alumina Complex, P.O. Box 944115-13114, Jajarm, Iran.
2 School of Chemical Engineering, Iran University of Science and Technology, Tehran, P.O. Box 16765-163,
Iran
ARTICLE INFO ABSTRACT
Article history: Received: 2015-09-04 Accepted: 2016-01-06
In the Bayer process, the reaction of silica in bauxite with caustic soda causes the loss of a great amount of NaOH. In this research, the bound-soda losses in Iran Alumina Complex solid residue (red mud) are predicted using intelligent techniques. This method, based on the application of regression and artificial neural networks (AAN), has been used to predict red mud bound-soda losses in Iran Alumina Company. Multilayer perceptron (MLP), radial basis function (RBF) networks and multiple linear regressions (MLR) were applied. The results of three methodologies were compared for their predictive capabilities in terms of the correlation coefficient (R), mean square error (MSE) and the absolute average deviation (AAD) based on the experimental data set. The optimum MLP network was obtained with structure of two hidden layers including 13 and 15 neurons in each layer respectively. The results showed that the RBF model with 0.117, 5.909 and 0.82 in MSE, AAD and R, respectively, is extremely accurate in prediction as compared with MLP and MLR.
Keywords:
Neural Network Linear Regression Bound-Soda Red Mud Bayer Process
1. Introduction
Alumina is an important basic raw
material for national economic
development [1] and Bayer process is known as extracting alumina from bauxite ore [2,3]. Most of the bauxite ores found in Iran are diasporic-characterized by tough processing demands and low alumina to
silica mass ratios (Al2O3 /SiO2). During
the alumina production, the digestion of
bauxite ores to extract aluminum
hydroxides is achieved by dissolution of the ore in a concentrated NaOH solution at elevated temperatures [1,4-7].
Iranian Journal of Chemical Engineering, Vol. 13, No. 2 47
1 ton of silica in composition of clay minerals 1 ton of soda is wasted and if silica exists as quartz, 1 ton of alumina is also wasted as sodalite precipitant [9]. This reaction can be represented by the following equation [5]:
(1)
Where X represents inorganic impurity ions in the liquor, including carbonate, sulphate and chloride [5]. Kaolin, which is usually present in the bauxite, also reacts with the desalination product (DSP) during the pre-desalination and digestion stages (eq. 2 and 3) [10].
Since most of the sodium alumino silicate enters into the bauxite residue (red mud) and it is the main by-product generated in alumina production [11,1], the loss of caustic and alumina from the liquor represents a significant and ongoing process cost [8,11,12].
Globally there are approximately 120 million tons of red muds produced every
year [13]. At present, about 615×103 tons
of red mud is separated from the sodium aluminate solution and disposed in special ponds every year in Jajarm alumina complex, which can cause high bound soda losses (B.S.L). Jajarm alumina complex is located in Jajarm city in north Khorasan province. Jajarm Alumina Plant is capable of producing 280,000 tons of alumina per year, which is a raw material for many chemical and petrochemical industries.
The development of numerical tools,
such as artificial neural network (ANN), has paved the way for alternative methods of prediction [14]. Artificial neural network with radial basis function (RBF) was explored for prediction of the vapor liquid equilibrium (VLE) data [15]. MLP artificial neural networks were also used for prediction of thermal conductivity of
Mg(OH)2–EG [16]. Artificial neural
network has been applied to estimate natural gas/water interfacial tension, too [17]. It was also used for predicting
reverse osmosis desalination plants
performance [18].
Some authors have reported the
application of ANN for estimation of alumina recovery from bauxite [19,20]. In this work, RBF and MLP as an Artificial Neural Network (ANN) method and multiple linear regressions (MLR) were employed to develop an approach for the forecasting of soda losses in Bayer process red mud. This prediction is based on the chemical composition of bauxite including
Al2O3, SiO2, Fe2O3, TiO2, MgO, CaO and
lime quantity and chemical analysis as
feed materials and SiO2 andNa2O analyses
of red mud as Bayer process by-product. This prediction can be useful when ores
with different mineralogical/chemical
bauxite and lime are fed to the plant.
2. Experimental data
We consider daily measurement of bauxite, lime and red mud chemical analyses in the Jajarm alumina complex. The data had been recorded from 2011 to 2012, corresponding to 333 data sets. The input parameters for this study consisted of
Al2O3, SiO2, Fe2O3, TiO2, MgO, CaO,
analyses for the bauxite, chemical
composition of lime and the ratio of lime
(2)
48 Iranian Journal of Chemical Engineering, Vol. 13, No. 2 to bauxite as feed materials and the
chemical analyses of Na2O and SiO2 for
the red mud. These data in the form of descriptive statistics results are presented in Table 1.
The output of the investigated process is B.S.L., which refers to the bound-soda losses in the red mud and is presented in relation to flow rates (ton/h) of the feed (bauxite ore) in the Bayer process that was calculated using the following equation:
(4)
Where SiO2 (Bauxite) is the mass fraction of
silicon in the bauxite (%) and SiO2[(Red mud)]
and Na2O(Red mud) are the mass fraction of
silicon and soda in the resulting red mud
(%), respectively. Silicon-containing
minerals are decomposed by alkali solution, most of which enters into the red mud and a little of which remains in the solution and deposits slowly [8]; therefore, the ratio of bauxite to red mud (ton/ton) is
determined from the ratio of SiO2 (Bauxite) to
SiO2 (Red mud) in Eq. (10). To normalize the
input data before submission to the neural
network and regression models is vitally important. This normalization is necessary to reduce the range of a set of values, so as to make them appropriate for the transfer or activation function that will be used. In general, all of them have to be normalized between 0 and 1 to prevent the saturation effect of the transfer function. The input parameters are normalized according to the following equation [14]:
(5)
Where Ui, mi, mi, min mi, max are the
normalized parameter, the actual
parameter, minimum of the actual
parameters and maximum of the actual parameters, respectively. The normalized data were fed as inputs to MLR, MLP and RBF for training whereas normalized red mud bound-soda losses were kept as outputs.
3. Methods
3.1. Multi-Layer perceptron network (MLP)
Feed forward multi-layer networks are
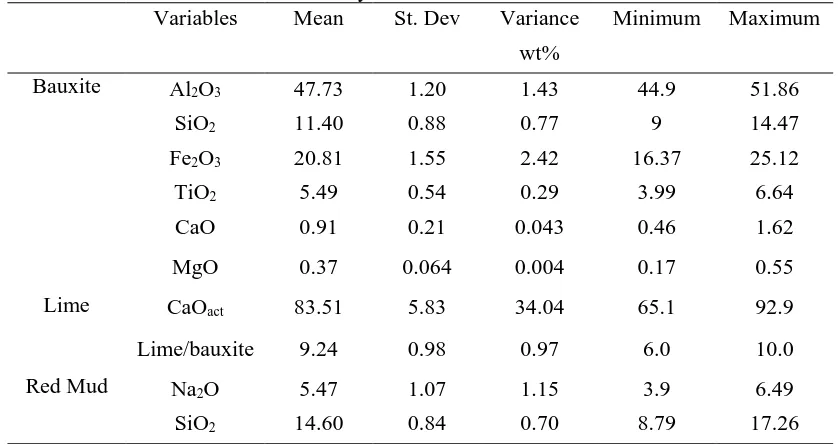
Table 1
Lime to bauxite ratio and chemical analyses of bauxite and lime.
Variables Mean St. Dev Variance Minimum Maximum wt%
Bauxite Al2O3 47.73 1.20 1.43 44.9 51.86
SiO2 11.40 0.88 0.77 9 14.47
Fe2O3 20.81 1.55 2.42 16.37 25.12
TiO2 5.49 0.54 0.29 3.99 6.64
CaO 0.91 0.21 0.043 0.46 1.62
MgO 0.37 0.064 0.004 0.17 0.55
Lime CaOact 83.51 5.83 34.04 65.1 92.9
Lime/bauxite 9.24 0.98 0.97 6.0 10.0
Red Mud Na2O 5.47 1.07 1.15 3.9 6.49
Iranian Journal of Chemical Engineering, Vol. 13, No. 2 49
listed as the most important and widely used artificial neural networks’ structures [21-24]. Typically, the MLP is organized as a set of interconnected layers of artificial neurons, input layer, one or more hidden layers and output layer [25]. It usually uses sigmoid activation function in the hidden layers and linear combination function in the hidden and output layers [26-30].
In neural network, training algorithms play quite an important role in the process [31]. Throughout the process, the learning algorithm is used to adjust the weight, bias and other input parameters in such a manner that the model is able to count its best fit immediately.
3.2. Radial basis function (RBF)
The radial basis function is another popular architecture utilized in ANN. The RBF, which is multilayer and
feed-forward, is often used for strict
interpolation in multi-dimensional space [25]. In the structure of RBF network, the input data, x, is a p-dimensional vector which is transmitted to each of the nodes in the hidden layer [25]. The nodes calculate the Euclidean distances between the centers and the network input vector [28], and pass the results through a nonlinear [32]. The RBF network output can be obtained by following equation [25]:
(6)
Where, Wi denotes the hidden-to-output weight corresponding to the i-th hidden node, and N, xi and G are the total number of hidden nodes, the mean (center) and Gaussian function, respectively. Radial basis function networks require more
neurons than feed forward standard networks with back propagation algorithm [33], but due to their better approximation capabilities, simpler network structures and faster learning algorithms, RBF networks have been widely used in many science and engineering applications [21,34,35].
3.3. Multiple linear regression model (MLR)
Multiple linear regression models are the best tools for predicting the future value of a variable based on the linear relationship between a dependent variable and independent variables [36-40]. MLR has been applied extensively as a predictive model in engineering and non-engineering domains [41]. Equation 7 represents n-value MLR model [41].
(7) β stands for the coefficient, n represents the explanatory variable, while X and Y are independent and dependent variables, respectively.
4. Results and discussion
50 Iranian Journal of Chemical Engineering, Vol. 13, No. 2 (8)
The mean square error and absolute average deviation are defined by the following equations [42-43]:
(9)
(10)
Where yi and ydi are the experimental and
calculated responses, respectively, and n is the number of the experimental data.
4.2. ANN results
4.2.1. Application of MLP
For training of Multi-Layer Perceptron (MLP) network, a program code, including
neural network was written. Data
randomization was processed before the training process. In the training process, 70% and 15% of the total data were utilized for training and cross validation,
respectively. Network testing was
conducted using 15% of the total data. The number of neurons in the first and second hidden layers, and learning rates were determined based on several trials. The optimum properties of the MLP network are shown in Table 2. In order to train, test and validate the optimum model, statistical tests (the correlation coefficient (R), mean square error (MSE) and the absolute average deviation (AAD)) between the measured and the estimated B.S.L were carried out. The results are summarized in Table 3 and Figs. 1, 2 and 3.
4.2.2. Application of RBF
In the training of the RBF, spread factor is
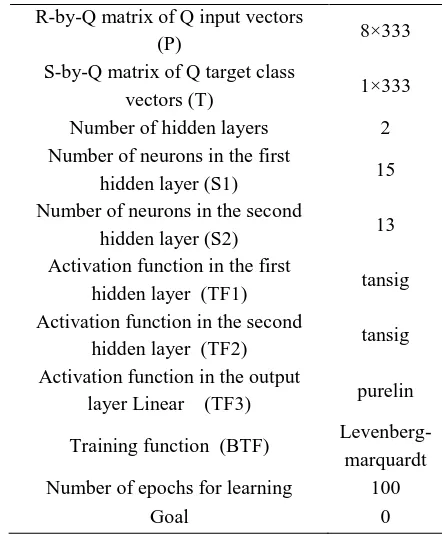
Table 2
The optimum structure of MLP model. R-by-Q matrix of Q input vectors
(P) 8×333
S-by-Q matrix of Q target class
vectors (T) 1×333 Number of hidden layers 2 Number of neurons in the first
hidden layer (S1) 15 Number of neurons in the second
hidden layer (S2) 13 Activation function in the first
hidden layer (TF1) tansig Activation function in the second
hidden layer (TF2) tansig Activation function in the output
layer Linear (TF3) purelin
Training function (BTF) Levenberg-marquardt Number of epochs for learning 100
Goal 0
Table 3
Testing performance of MLP model.
Training Validation Testing
MSE 0.108 0.138 0.202
AAD 6.058 7.059 8.63
R 0.87 0.79 0.732
Min Abs
Error -0.883 -0.556 -0.828 Max Abs
Error 1.365 1.091 1.104
the only parameter which is obtained by the trial and error method and unlike the MLP model, it is not necessary to determine the optimum number of neurons [44]. In this study, 85% and 15% of the total data were utilized for training and
testing, respectively. The optimum
structure of the RBF network is given in Table 4. The results of statistical tests (R, MSE and AAD) between the actual and the predicted B.S.L are shown in Table 5 and Fig. 2.
4.3. Application of regression
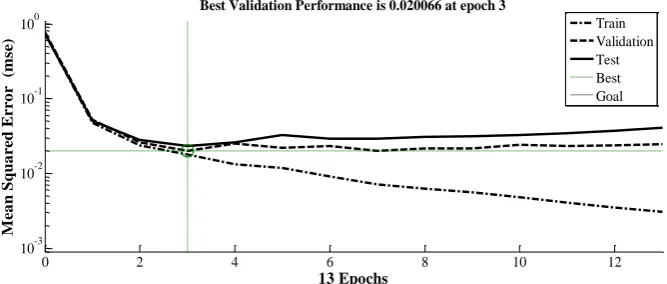
Iranian Journal of Chemical Engineering, Vol. 13, No. 2 51 Figure 1. Mean squared error of training, validation, and test sets in each epoch.
Figure 2. The scatter plot of actual data versus predicted data in MLP method.
Table 4
The optimum structure of RBF model.
R-by-Q matrix of Q input vectors
(P) 8×333
S-by-Q matrix of Q target class vectors
(T) 1×333
Goal 0
Spread 1.2
Maximum number of neurons
(MN) 20
Number of neurons to add between
displays (DF) 1
Table 5
Testing performance of RBF model.
Parameter Training Testing
MSE 0.133 0.117
AAD 6.9018 5.909
R 0.824 0.82
Min Abs Error -0.109 -0.541 Max Abs Error 1.012 0.9404
(Pearson Correlation and Statistical
Significance) used for defining the correlations dependence between B.S.L
and chemical analysis of bauxite and lime. The results show that the value of PC
between B.S.L and the analyses of Al2O3,
SiO2, TiO2 in bauxite and concentration of
CaOact and the lime to bauxite ratio
((ton/ton)×100) are statistically significant (P-Value ≤0.05).
The relationship between B.S.L and selected input variables was described using multiple linear regression. In this case, 85% of the total data was utilized for creation of the model, the same as MLP and RBF models, using 15% of the total data for testing. Equation 11 represents the linear model developed during the first phase of the MLRA modeling procedure.
(11)
In order to train and test the optimum model, statistical tests (the correlation
0 2 4 6 8 10 12
10-3 10-2 10-1 100
Best Validation Performance is 0.020066 at epoch 3
M
ea
n
Sq
ua
red
Err
o
r
(m
se)
13 Epochs
52 Iranian Journal of Chemical Engineering, Vol. 13, No. 2
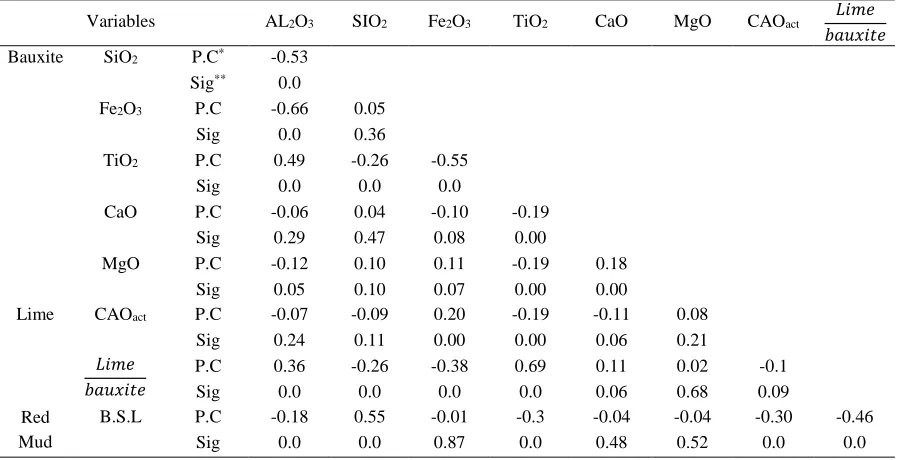
Table 6
Correlation matrix for the input variables and B.S.L.
Variables AL2O3 SIO2 Fe2O3 TiO2 CaO MgO CAOact 𝐿𝑖𝑚𝑒
𝑏𝑎𝑢𝑥𝑖𝑡𝑒
Bauxite SiO2 P.C* -0.53 **
Sig 0.0
3 O 2
Fe P.C -0.66 0.05
Sig 0.0 0.36
2
TiO P.C 0.49 -0.26 -0.55
Sig 0.0 0.0 0.0
CaO P.C -0.06 0.04 -0.10 -0.19
Sig 0.29 0.47 0.08 0.00
MgO P.C -0.12 0.10 0.11 -0.19 0.18
Sig 0.05 0.10 0.07 0.00 0.00
Lime CAOact P.C -0.07 -0.09 0.20 -0.19 -0.11 0.08
Sig 0.24 0.11 0.00 0.00 0.06 0.21
𝐿𝑖𝑚𝑒 𝑏𝑎𝑢𝑥𝑖𝑡𝑒
P.C 0.36 -0.26 -0.38 0.69 0.11 0.02 -0.1
Sig 0.0 0.0 0.0 0.0 0.06 0.68 0.09
Red Mud
B.S.L P.C -0.18 0.55 -0.01 -0.3 -0.04 -0.04 -0.30 -0.46
Sig 0.0 0.0 0.87 0.0 0.48 0.52 0.0 0.0
coefficient (R), mean square error (MSE) and the absolute average deviation (AAD)) between the measured and the estimated B.S.L were carried out. The results of the developed model are presented in Table 7 and Fig. 4.
5. Conclusions
In the Bayer process, the reaction of silica in bauxite with caustic soda causes the loss of a considerable amount of NaOH [45]. In this work, MLR, MLP and RBF models were adapted for prediction of bound-soda losses in red mud of Iran Alumina Company. The predictive performance of each model was assessed using three statistical measures: R, MSE and AAD. However, the application of the RBF
Table 7
Testing Performance indices for MLR model. Deviation Training Testing
MSE 0.191 0.182
AAD 8.42 7.67
R 0.735 0.72
Min Abs Error -1.140 -0.588 Max Abs Error 1.201 1.241
A: MLP, B: RBF and C: MLR (in testing stage).
network using the testing data set resulted in lesser amounts of the MSE and AAD, i.e., 0.117 and 5.909, respectively as compared to the MLP and MLR models. A comparison of the correlation coefficient (R) presented in Tables 3, 5 and 7 show that RBF model has higher accuracy when estimating the red mud bound-soda losses than MLP and MLR models is concerned. The obtained results of mean standard error, min and max abs error confirm the superiority of the RBF technique over the MLP and MLR techniques. We can conclude that the predicted data generated by the RBF network are eminently evidently suitable for estimating the red mud bound-soda losses of Iran alumina complex.
Acknowledgements
This work was funded by Iran Alumina
Company. The authors thank the
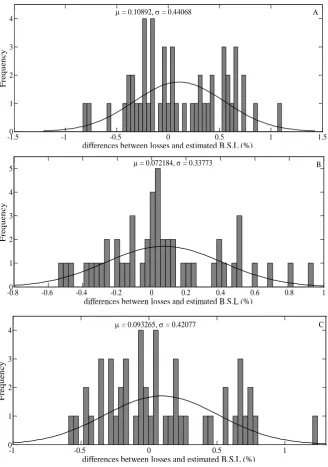
Iranian Journal of Chemical Engineering, Vol. 13, No. 2 53 Figure 4. Distribution of differences between actual bound-soda losses and
estimated data; A: MLP, B: RBF and C: MLR (in testing stage).
would like to acknowledge the support of the Iran Alumina Company manager for preparation of this study.
References
[1] Barnes, M. C. Addai-Mensah, J. and Gerson, A.R., "The solubility of sodalite and cancrinite in synthetic
spent Bayer liquor", Colloids Surf.,
157, 101(1999b).
[2] Sonthalia, R. Behara, P. Kumaresan, T. and Thakre, S., "Review on alumina trihydrate precipitation mechanisms and effect of Bayer impurities on
hydrate particle growth rate", J. Miner.
Proc. 125, 137 (2013).
[3] Xiao, J. B. Jiang, X. Y. and Chen, X. Q., "Identification of Organic Acids in
Bayer Liquors By GC–MS: A
Comparison Using Butylation and
Methylation", J. Chromatogr. Sci., 45,
-1.50 -1 -0.5 0 0.5 1 1.5
1 2 3
4 = 0.10892, = 0.44068
differences between losses and estimated B.S.L (%)
Fre
q
u
en
cy
A
-0.80 -0.6 -0.4 -0.2 0 0.2 0.4 0.6 0.8 1
1 2 3 4
5 = 0.072184, = 0.33773
differences between losses and estimated B.S.L (%)
Fre
q
u
en
cy
B
-1 -0.5 0 0.5 1
0 1 2 3
4 = 0.093265, = 0.42077
differences between losses and estimated B.S.L (%)
Fre
q
u
en
cy
54 Iranian Journal of Chemical Engineering, Vol. 13, No. 2 183 (2007).
[4] Barnes, M. C. Addai-Mensah, J. and Gerson, A.R., "The mechanism of the
sodalite-to-cancrinite phase
transformation in synthetic spent Bayer
liquor", Microporous Mesoporous
Mater., 31, 287 (1999a).
[5] Xu, B. Wingate, C. and Smith, P., "The effect of surface area on the modelling of quartz dissolution under conditions relevant to the Bayer process",
Hydrometallurgy, 98, 108 (2009).
[6] Kumaresan, T. Thakre, S. S. Basu, B. Kaple, K. Gupta, H. P. Bandi, A. Chaturvedi, P. Roy, N. N. Gararia, S. N. Sapra, V. and Shah, R. P., "Performance improvement of alumina
digestors". 7th International
Conference on CFD in the Minerals
and Process Industries CSIRO,
Melbourne, Australia (2009).
[7] Zhao, Q. J. Yang, Q. F. Chen, Q. Y. Yin, Z. L. Wu, Z. P. and Yin, Z. G.,
"Behavior of silicon-containing
minerals during Bayer digestion",
Trans. Nonferrous Met. Soc. China.,
20, 1 (2010).
[8] Leonard, J., "Proceeding of bauxite symposium". Published by SME Los angles, California, pp 656 (1984). [9] Ma, S. H. Wen, Z. G. Chen, J. N. and
Zheng, S. L., "An environmentally
friendly design for low-grade
diasporic-bauxite processing", Miner.
Eng., 22, 793 (2009).
[10] Liu, W. Yang, J. and Xiao, B., "Review on treatment and utilization
of bauxite residues in China", Int. J.
Miner. Proc., 93, 220 (2009).
[11] Xiao-bin, L. Wei, X. Wei, L, Gui-hua, L. Zhi-hong, P. Qiu-sheng, Z. and Tian-gui, Q., "Recovery of alumina
and ferric oxide from Bayer red mud rich in iron by reduction sintering",
Trans. Nonferrous Met. Soc. China.,
19, 1342 (2009).
[12] Liu, W., "The developing of red mud
utilization in china", Zhengzhou
Research Institute of CHALCO., 1
(2015).
[13] Ghaemi, A. Shahhoseini, Sh.
Ghannadi Marageh, M. and Farrokhi, M., "Prediction of Vapor-Liquid Equilibrium for Aqueous Solutions of Electrolytes Using Artificial Neural
Networks", J. Appl. Sci., 8, 615
(2008).
[14] Ganguly, S., "Prediction of VLE data
using radial basis function network",
Comput. Chem. Eng., 27, 1445
(2003).
[15] Hemmat E, M. Afrand, M.
Wongwises, S. Naderi, A. Asadi, A.,
Rostami, S. and Akbari, M.,
"Applications of feedforward
multilayer perceptron artificial neural networks and empirical correlation for prediction of thermal conductivity of
Mg(OH)2–EG using experimental
data", Int. Commun. Heat and Mass
Transfer, 67, 46 (2015).
[16] Zhang, J. Feng, Q. Zhang, X. Zhang,
X. Yuan, N. Wen, S. Wang, S. and Zhang, A., "The use of an artificial neural network to estimate natural
gas/water interfacial tension", Fuel.,
157, 28 (2015).
[17] Aish, A. M. Zaqoot, H. A. and
Abdeljawad, S. M., "Artificial neural network approach for predicting reverse osmosis desalination plants performance in the Gaza Strip",
Desalination, 367, 240 (2015).
Iranian Journal of Chemical Engineering, Vol. 13, No. 2 55
"Artificial neural network prediction
of Al2O3 leaching recovery in the
Bayer process—Jajarm alumina plant
(Iran)", Hydrometallurgy, 97, 105
(2009).
[19] Duric, I. Mihajlovic, I. Zivkovic, Z. and Dragana, K., "Artificial neural network prediction of aluminum extraction from bauxite in the Bayer
process", J. Serbian chem. Soc., 76,
1259 (2012).
[20] Oludolapo, O. A. Jimoh, A. A. and
Kholopane, P.A., "Comparing
performance of MLP and RBF neural network models for predicting South
Africa’s energy consumption", J.
Energy South. Afr., 23, 40 (2012).
[21] Mata J., "Interpretation of concrete dam behavior with artificial neural
network and multiple linear
regression models", Eng. Struct., 33,
903 (2011).
[22] Labiosa, A. A., "Dynamic simulation of red mud washers used in aluminum industries". Msc thesis, School of civil, Environmental and chemical engineering RMIT university victoria, 3000, Australia (2010).
[23] Almeida, L. B., "Multilayer
perceptrons. Handbook of Neural Computation". Publishing Ltd and Oxford University Press, C1.2, 1 (1997).
[24] Memarian, H. and Balasundram, S. K., "Comparison between Multi-Layer Perceptron and Radial Basis Function Networks for Sediment Load Estimation in a Tropical
Watershed", J. Water Res. Prot., 4,
870 (2012).
[25] Salarian, T. Zare, M. and Mahmoudi, M., "Evaluation of shallow landslides
hazard using artificial neural network of Multi-Layer Perceptron method in Subalpine Grassland (Case study: Glandrood watershed - Mazandaran)",
Int. J. Agriculture Crop Sci., 7, 795
(2014).
[26] Firoozi, S. Sheikhdavoodi, M. J. and
Sami, M., "Evaluation the Ability of Different Artificial Intelligence-Based Modeling Techniques in Prediction of Yield Using Energy Inputs Data of
Farms", J. Life Sci. Biomed., 4, 305
(2014).
[27] Lasota, T. Makos, M. and Trawinski,
B., "Comparative Analysis of Neural
Network Models for Premises
Valuation Using SAS Enterprise
Miner", New Challenges Comput.
Collective Int., 244, 337 (2009).
[28] Russo, A. Raischel, F. and Lind P. G.,
"Air quality prediction using optimal
neural networks with stochastic
variables", Atmos. Environ., 79, 822
(2013).
[29] Amato, F. Lopez, A. Peña-Méndez,
E.M. Vaňhara, P. Hampl, A. and Havel, J., "Artificial neural networks
in medical diagnosis", J. Appl.
Biomed., 11, 47 (2013).
[30] Nogay, H. S. Akinci, T. C. and
Eidukeviciute, M., "Application of artificial neural networks for short term wind speed forecasting in
Mardin, Turkey", J. Energy South.
Afra., 23, 1 (2012).
[31] Omurlu, I. K. Ture, M. Unubol, M.
Katranci, M. and Guney, E.,
"Comparing Performances of Logistic
Regression, Classification &
Regression Trees and Artificial
Neural Networks for Predicting
56 Iranian Journal of Chemical Engineering, Vol. 13, No. 2
Mellitus", Int. J. Sci. Basic and Appl.
Res., 16, 173 (2014).
[32] Vali, A. A. Ramesht, M. H. and Mokarram, M., "The Comparison of RBF and MLP Neural Networks Performance for the Estimation of
Land Suitability", J. Environ., 2, 74
(2013).
[33] Benghanem, M. and Mellit, A., "Radial Basis Function Network-based prediction of global solar radiation data: Application for sizing of a standalone photovoltaic system at
Al-Madinah, Saudi Arabia", Energy,
35, 3751 (2010).
[34] Mellit, A. and Kalogirou, S.,
"Artificial intelligence techniques for photovoltaic applications: a review",
Prog. Energy Comb. Sci., 34, 574
(2008).
[35] Abu Bakar, N. M. and Tahir, I. M.,
"Applying Multiple Linear
Regression and Neural Network to
Predict Bank Performance", Int. Bus.
Res., 2, 176 (2009).
[36] Mustafar, I. B. and Razali, R., "A Study on Prediction of Output in
Oilfield Using Multiple Linear
Regression", Int. J. Appl. Sci.
Technol., 1, 107 (2011).
[37] Olaniyi, S. A. S. Kayode, S, A. and Jimoh, R. G., "Stock Trend Prediction Using Regression Analysis – A Data
Mining Approach", ARPN J. Sys.
Softwr., 1, 154 (2011).
[38] Abyaneh, H. Z., "Evaluation of multivariate linear regression and artificial neural networks in prediction
of water quality parameters", J.
Environ. Health Sci. Eng., 12,
1(2014).
[39] Razi, M. A. and Athappilly, K., "A
comparative predictive analysis of neural networks (NNs), nonlinear regression and classification and regression tree (CART) models",
Expert. Syst. Appl., 29, 65 (2005).
[40] Anyaeche, C. O. and Ighravwe D. E.,
"Predicting performance measures using linear regression and neural
network: A comparison", Afr. J. Eng.
Res., 1, 84 (2013).
[41] Ghaffari Moghaddam, M. Ahmad, F.
B. H. Basri, M. and Abdul Rahman, M. B., "Artificial neural network modeling studies to predict the yield of enzymatic synthesis of betulinic
acid ester", Electr. J. Biotech., 13, 1
(2010).
[42] Bas, D. and Boyac, I. H., "Modeling
and optimization II: Comparison of estimation capabilities of response surface methodology with artificial neural networks in a biochemical
reaction", J. Food Eng., 78, 846
(2007).
[43] Kia, E. Emadi, A. R. and Fazlola, R.,
"Investigation and Evaluation of
Artificial Neural Networks in
Babolroud River Suspended Load
Estimation", J. Civil Eng. Urbanism,
3, 183 (2013).
[44] Xu, B. Smith, P. Wingate, C. and
Silva, L. D., "The effect of calcium and temperature on the transformation of sodalite to cancrinite in Bayer
digestion", Hydrometallurgy, 105, 75