22 | P a g e
International Journal of Pharmaceutical
Development & Technology
e ISSN - 2248 - 910X
www.ijpdt.com
Print ISSN - 2248 - 9096SOLUBILITY AND DISSOLUTION ENHANCEMENT OF
ACECLOFENAC BY SOLID DISPERSION TECHNIQUE
Priti Tagde
1and Madan Bilawer
21. Department of Pharmaceutics, NRI Institute of Pharmaceutical Sciences, Bhopal, Madhya Pradesh. 2. Department of Pharmaceutics, NRI Institute of Pharmacy, Bhopal, Madhya Pradesh.
ABSTRACT
Aceclofenac an analgesic and anti-inflammatory drug used intreatment of Osteo arthritis, rheumatoid arthritis and ankylosing spondylitis.Aceclofenac solid dispersions were prepared using hydrophillic polymers such as polyethylene glycol-4000, polyethylene glycol-6000 and Polyvinyl Pyrrolidone in the ratio of 9:1, 7:3 and 1:1 by solvent evaporation technique. The prepared formulations were evaluated for number of parameters like solubility, drug content uniformity, drug-polymer interactions, differential scanning calorimetry, X-ray diffractogram study showed the reduced number of peaks and decrease intensity of the peaks in the formulations, this suggests that the crystalline nature of the drug was converted to amorphous form, which is the reason for the higher solubility, faster dissolution rate and improved bioavailability of the drug when it is formulating in the form of solid dispersion. Drug Aceclofenac and its various formulations were subjected to scanning electron microscopy studies. The results showed the conversion of crystalline nature of the drug to amorphous form, which indicates enhanced solubility, dissolution rate and bioavailability of the drug. The in vitro release study was carried out on plain pure drug Aceclofenac and various solid dispersion formulations by employing pH 6.8 phosphate buffer as a dissolution medium. This shows an increased release of the drug from the dispersions in comparison to pure Aceclofenac drug. In vitro data of all formulations was subjected to first order plots, the graphs plotted were fairly linear and the ‘r’ values of all the formulations were very close to one, indicating the release mechanism followed first order kinetics.
Keywords: Analgegic, Ankylosing spondylitis, Dispersion.
INTRODUCTION
The number of sparingly soluble active pharmaceuticals ingredients (API) has risen sharply in recent years and the formulation of such entities presents greater challenges to formulation pharmacists. As a matter of fact, more than 40% of new chemical entities are insufficiently soluble to allow for acceptable dosage formulation. In the last decade, competition in the pharmaceutical area has revolved around improving physicochemical properties of drugs and improving formulations to give the patient a better product1.
The knowledge of Biopharmaceutical Classification System (BCS) included in the guidelines of the U.S. food and drug administration, can be utilized by the formulation scientists for developing an optimized dosage form2. Along with the permeability, the dissolution of drug in gastro-intestinal fluid is a key factor in the determination of its oral bioavailability3. Drug dissolution from oral solid dosage forms depend on the release of a drug from the dosage form and subsequent solubilization of drug particles in physiological fluid4.
For poorly soluble, the rate of oral absorption is often controlled by the dissolution rate in the Gastro intestinal tract. Therefore together with the permeability, the solubility and dissolution behavior of a drug are key determinants of its oral bioavailability5,6. There have been numerous efforts to improve drug dissolution rate. These include, (a) reducing particle size to increase surface area, thus increasing dissolution rate of drug; (b) solubilization in surfactant systems; (c) formation of water-soluble complexes; (d) use of pro-drug and drug derivatization such as a strong electrolyte salt forms that usually have higher dissolution rate; and (e) manipulation of solid state of drug substance to improve drug dissolution i.e. by decreasing crystallinity of drug substance through formation of solid solutions7. The most common method is increasing the surface area of the drug by micronization. But, in practice the effect of micronization is often disappointing, especially when the drugs are encapsulated or tableted. This phenomenon was attributed to the agglomeration tendency of micronized, poorly soluble, hydrophobic drugs, which
23 | P a g e
results in a decreased effective surface area for dissolution.By many estimates up to 40 percent of new chemical entities discovered by the pharmaceutical industry today are poorly soluble or lipophilic compounds. The solubility issues complicating the delivery of these new drugs also affect the delivery of many existing drugs8. Aceclofenac is aceclofenacum (O–(2, 6-dichloroaniline) phenyl] acetate glycolic acid ester, 2–(2, 6-dichloraniline) phenyl acetoxyacetic acid. Aceclofenac is a NSAID. It is used in the management of osteoarthritis, rheumatoid arthritis and ankylozing spondylitis. Aceclofenac when taken orally shows gastrointestinal disturbances such as GI discomfort, nausea, diarrhea. In some patients peptic ulceration and severe gastrointestinal bleeding may also occur.
Solid dispersion technology can be used to improve the in vitro and in vivo dissolution properties of dissolution dependent poorly water soluble drugs. PEG 4000, PEG 6000 and PVP have been reported to be used for increasing the solubility of a poorly soluble drugs10. The usual dose of aceclofenac is 100 mg given twice daily by mouth. The initial dose should be reduced to 100 mg daily in patients with hepatic impairment. Its low solubility makes it a suitable candidate for solid dispersion systems.
Materials and Method
Aceclofenac was obtained as a gift sample from Cipla Pharmaceutical Ltd. Mumbai India.Polyethylene glycol 4000, Polyethylene glycol 6000 was gift sample from Loba Chemie Pharmaceutial Pvt. Ltd. Mumbai India.PVP K30 were supplied by MIDC Pharmaceutical Ltd. Tarapur India.Concentrated hydrochloric acid, sodium hydroxide were supplied by NICE Chemical Pvt. Ltd. Cochin India.Disodium Hydrogen Phosphate, Methanol were supplied by Merck Pvt. Ltd. Mumbai India.
Preparation of solid dispersions by Solvent Evaporation method
(i) Preparation of aceclofenac – PEG 4000 solid dispersion
Weighed quantity of aceclofenac and PEG 4000 was dissolved in ethanol solvent to get a clear solution. The solvent was evaporated at room temperature. The mass obtained was pulverized and sifted through mesh no.100 and stored in closed airtight container.
(ii) Preparation of aceclofenac -PEG 6000 solid dispersion
Weighed quantity of PEG and aceclofenac was dissolved in ethanol to get a clear solution. The solvent was evaporated at room temperature. The mass obtained was pulverized and sifted through mesh no: 100 and stored in closed airtight container.
(iii) Preparation of aceclofenac – PVP solid dispersion Weighed quantity of PVP and aceclofenac was dissolved in ethanol to get a clear solution. The solvent was evaporated at room temperature. The mass obtained was
pulverized and sifted through mesh no: 100 and stored in closed airtight container. Table 1 showing Various Solid Dispersions Prepared by Solvent Evaporation method
RESULT AND DISCUSSION Preformulation studies
Organoleptic Properties: The sample drug Aceclofenac
was found to be white crystalline through visual inspection which is in accordance with I.P
Solubility: The solubility of aceclofenac was determined in different solvents. The drug was found to be more soluble in organic solvents.
Melting point: Melting point of the sample drug
aceclofenac was found to be 149 °C which is in accordance with IP.
Partition Coefficient: The partition coefficient of aceclofenac was determined in n-octanol: distilled water and log P value was found to be 3.65
Interference of Additives / Compatibility Testing: The above results of UV spectroscopic analysis indicated that there was no chemical interaction between the drug and the additives as the respective formulation (Drug and Polymer combination) exhibited absorption nearly similar to those of the pure drug sample (Table 2 showing Interference of Additives)
Ultraviolet Absorbance spectra: Mention in Graph 1 & Table 3 Showing Standard Curve of Aceclofenac in Phosphate Buffer pH 6.8
FT-IR Spectrum of Aceclofenac: FT-IR Spectra of
Aceclofenac was recorded. The characteristic peaks due to pure Aceclofenac at 667.32, 1291.25 1717.49, 1771.50, 1291 for C-H bending, C-N Stretching, C= O Str., due to polynuclear aromatic ring, secondary aromatic, carboxylic group, esters to group respectively, which us shown in Table-4.
Differential scanning calorimetery (DSC) of Aceclofenac : The DSC thermo gram shows that when the drug aceclofenac was taken to study its properties at higher temperature it has exhibited the melting endotherm at onset 152.51 o C and peak at158.92 o C (Fig 1-4)
Drug Content Uniformity:
24 | P a g e
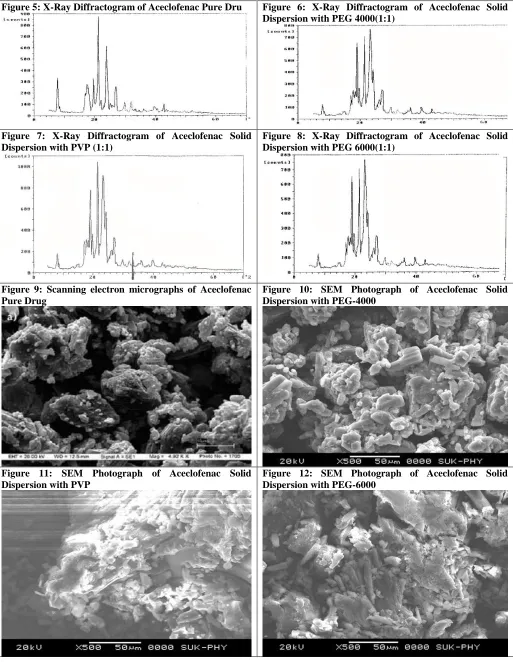
X-Ray Diffractograms of Aceclofenac and its
Formulations:
The pure drug Aceclofenac and some selected formulations such as F3, F6 and F9 were subjected to X-ray diffraction studies and they were shown in figure-00 respectively. The X-ray diffractogram of pure drug Aceclofenac shows more number of intense and sharp peaks, whereas the other diffractograms like formulation F3, F6 and F9 shows lesser number of peaks. The results showed that the numbers of peaks were reduced and also the intensity of the peaks was also decreased in the formulation diffractograms. The results suggests that the crystalline nature of the drug was converted to amorphous form, which is the reason for the higher solubility, faster dissolution rate and improved bioavailability of drug when it is formulating in the form of solid dispersions. (Fig 5-8)
Scanning Electron Microscopy:
The pure drug Aceclofenac and its various formulations were subjected to scanning electron microscopy studies. The Aceclofenac pure drug shows crystalline nature of the drug in its microphotographs, whereas in case of its formulations, the crystalline nature of the drug is get converted to amorphous form to maximum extent as shown in photograph. This converting crystalline property of a drug into amorphous form by preparation of solid dispersion is the one of the reason in enhancing its solubility, dissolution rate and bioavailability of the drug.
(Fig 9-12)
In-Vitro Drug Release Studies
The Aceclofenac pure drug and its various formulations prepared were subjected to in vitro drug release studies and the release data were shown in the table-00 and the data was plotted for cumulative percent release versus time (release plots) and also for log percent drug remaining versus time (first order plots). The Aceclofenac pure drug and its formulation with polyethylene glycol-4000 (F1, F2 and F3) shows 9.11%, 77.20%, 80.40% and 85.30% of drug release respectively at the end of one hour. Similarly the Aceclofenac formulations with polyethylene glycol-6000 (F4, F5 and F6) show 80.50 %, 85.90 and 87.40 of drug release respectively at the end of one hour. Similarly Aceclofenac formulations with polyvinyl pyrrolidone (F7, F8 and F9) release 80.10%, 82.10% and 80.06% respectively. In all the cases, the first order plots were found to be fairly linear and the ‘r’ coefficient value for pure drug Aceclofenac and its formulations with polyethylene glycol-4000 i.e., F1, F2 and F3 were 0.8133, 0.9935, 0.9928 and 0.9974 respectively. The same ‘r’ value for polyethylene glycol-6000 formulations i.e. F4, F5 and F6 were 0.9661, 0.9910 and 0.9772 respectively. Similarly the ‘r’ coefficient values for PVP formulations (F7, F8 and F9) were 0.9835, 0.9943 and 0.9904 respectively. So the regression data of first order plots indicates that the drug was released by first order kinetics.(Graph 2-7)
Table 1: Various Solid Dispersions Prepared by Solvent Evaporation method
Formulation code Solid Dispersions Drug –carrier ratio
F1 Aceclofenac-PEG 4000 9:1
F2 Aceclofenac-PEG 4000 7:3
F3 Aceclofenac-PEG 4000 1:1
F4 Aceclofenac-PEG 6000 9:1
F5 Aceclofenac-PEG 6000 7:3
F6 Aceclofenac-PEG 6000 1:1
F7 Aceclofenac-PVP 9:1
F8 Aceclofenac-PVP 7:3
F9 Aceclofenac-PVP 1:1
Table 2 : Interference of Additives/Compatibility Testing
Formulation Absorbance of solutions Interference
Yes / No
Polymer blend with drug Placebo Pure drug
Aceclofenac-PEG 4000 0.065 0.003 0.062 No
Aceclofenac-PEG 6000 0.066 0.001 0.062 No
Aceclofenac-PVP 0.065 0.004 0.062 No
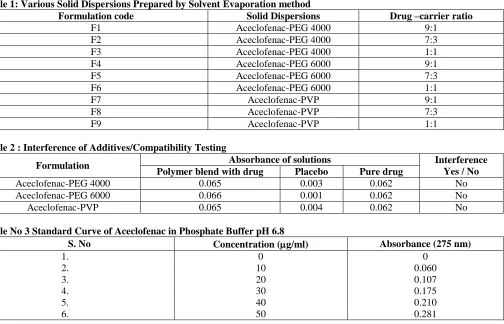
Table No 3 Standard Curve of Aceclofenac in Phosphate Buffer pH 6.8
S. No Concentration (g/ml) Absorbance (275 nm)
1. 0 0
2. 10 0.060
3. 20 0.107
4. 30 0.175
5. 40 0.210
25 | P a g e
7. 60 0.322
8. 70 0.375
9. 80 0.421
10. 90 0.458
11. 100 0.523
R2= 0.996, Y= 0.005x
Table No - 4 Characteristic peak ranges of Aceclofenac
S. No. Transition Ranges (cm-1) Drug
1. C = O str 1740 – 1680 1717.49
2. C = O Str 1800 – 1725 1771 .50
3. C – N Str. 1350 – 1280 1291.25
4. C – H bend 900 – 625 667.32
Table No.5: Drug Content Uniformity of Aceclofenac
Formulation Code Percentage Drug Content Mean percent drug
content ± SD
I II III
F1 96.90 95.26 98.15 96.77 ± 0.0072
F2 98.68 94.90 96.42 96.66 ± 0.0040
F3 96.57 97.89 95.00 96.48 ± 0.0032
F4 96.52 98.63 98.89 98.01 ± 0.0030
F5 97.63 95.31 98.26 97.06 ± 0.0015
F6 96.63 99.12 97.57 97.77 ± 0.0015
F7 97.00 98.68 95.94 97.20 ± 0.0017
F8 92.63 98.90 98.68 96.63 ± 0.0020
F9 98.40 99.68 98.63 98.90 ± 0.0030
Fig. 1: DSC Thermogram of Pure Aceclofenac Figure 2: DSC Thermogram of PEG 4000
26 | P a g e
Figure 5: X-Ray Diffractogram of Aceclofenac Pure Dru Figure 6: X-Ray Diffractogram of Aceclofenac Solid
Dispersion with PEG 4000(1:1)
Figure 7: X-Ray Diffractogram of Aceclofenac Solid Dispersion with PVP (1:1)
Figure 8: X-Ray Diffractogram of Aceclofenac Solid Dispersion with PEG 6000(1:1)
Figure 9: Scanning electron micrographs of Aceclofenac Pure Drug
Figure 10: SEM Photograph of Aceclofenac Solid Dispersion with PEG-4000
Figure 11: SEM Photograph of Aceclofenac Solid Dispersion with PVP
27 | P a g e
Graph 1: Standard Curve of Aceclofenac in PhosphateBuffer pH 6.8
Graph 2: Zero order plots of Aceclofenac Pure Drug and it’s Solid Dispersions prepared with PEG-4000
Graph 3: First order plots of Aceclofenac Pure Drug and it’s Solid Dispersions prepared with PEG-4000
Graph 4: Zero order plots of Aceclofenac Pure Drug and its Solid Dispersions Prepared with PEG-6000
Graph 5: First order plots of Aceclofenac Pure Drug and it’s Solid Dispersions prepared with PEG-6000
Graph 6: Zero order plots of Aceclofenac Pure Drug and its Solid Dispersions prepared with PVP
Graph 7: First order plots of Aceclofenac Pure Drug and it’s Solid Dispersions prepared with PVP
CONCLUSSION
In the present research work, Aceclofenac solid dispersions were prepared using hydrophillic polymers such as polyethylene glycol-4000, polyethylene glycol-6000 and Polyvinyl Pyrrolidone in the ratio of 9:1, 7:3 and 1:1 by solvent evaporation technique. The prepared formulations were evaluated for number of parameters like solubility,
28 | P a g e
bioavailability of drug. The pure drug Aceclofenac and itsvarious formulations were subjected to scanning electron microscopy studies. The results showed the conversion of crystalline nature of the drug to amorphous form, which indicates enhanced solubility, dissolution rate and bioavailability of the drug. The in vitro release study was carried out on plain pure drug Aceclofenac and various solid dispersion formulations by employing pH 6.8 phosphate buffer as a dissolution medium. This shows an increased release of the drug from the dispersions in comparison to
pure Aceclofenac drug. In vitro data of all formulations was subjected to first order plots, the graphs plotted were fairly linear and the ‘r’ values of all the formulations were very close to one, indicating the release mechanism followed first order kinetics.
ACKNOWLEDGEMENTS
The authors thank to management of NRI College Bhopal for providing required facilities to carry out this research work.
REFERENCES
1. Leuner C, Dressman J. Improving drug solubility for oral delivery using solid dispersions. Eur. J. Pharm. Biopharm. 2000; 50:47-60.
2. Swarbrick J, Boylan JC. Encyclopedia of Pharmaceutical Technology. Marcel Dekker. INC. New York. 1991;3:315.
3. Chio WL, Reigelman S. Pharmaceutical applications of solid dispersion systems: Review article. J. Pharm. Sci. 1971; 60:1281-1302.
4. Corrigan OI. Drug Dev. Ind. Pharm. 1985; 11:697-724.
5. Mayershon M, Gibaldi M. New method of solid state dispersion for increasing dissolution rates. J. Pharm. Sci. 1966; 55:1323.
6. Guillory JK, Hwang SC, Lach JL. Interactions between pharmaceutical compounds by thermal methods. J. Pharm. Sci. 1969; 58:301-308.
7. Goldberg AH, Gibaldi M, Kanig JL. Increasing dissolution rates & gastrointestinal absorption of drugs via solid solutions & eutectic mixtures II. J. Pharm. Sci. 1966; 55:482-487.
8. Chiou WL, Niazi SC. Differential Thermal Analysis & X-Ray diffraction studies of Griseofulvin- succinic acid solid dispersions. J. Pharm. Sci. 1973; 62:498-501.
9. Kaur R, Grant DJW, Eves T. Comparison of PEG & Polyoxyethylene stearate as excipients for solid dispersion systems of Griseofulvin & Tolbutamide I, II: Phase equilibria. J. Pharm. Sci. 1980; 69:1317-1326.
10. Simonelli AP, Mehta SC, Higuchi WL. Dissolution rates of high energy PVP-Sulfathiazole coprecipitates. J. Pharm. Sci. 1969; 58:538-549.
11. Bates TR, Higuchi WL. Dissolution characteristics of Reserpine- PVP coprecipitates. J. Pharm. Sci. 1969; 21:710-712. 12. Bochner F, Huffman DH, Shen DD, Azarnoff DL. Bioavailability of Digoxin-Hydroquinone complex : A new oral Digoxin
formulation. J. Pharm. Sci. 1977; 66:644-647.
13. Spiears SS, Rohera BD, Jarowski CI. Pharm. Res. 1992; 9:1351.
14. Liao CC, Jarowski CI. Dissolution rates of Corticoid solutions dispersed on Silicas. J. Pharm. Sci. 1984; 73:401.
15. Spireas S, Sadu S, Grover R. Invitro release evaluation of Hydrocortisone liquisolid tablets. J. Pharm. Sci. 1998; 87:867-872. 16. Yang KY, Glemza R, Jarowski CI. Effects of amorphous silicon dioxides on drug dissolution. J. Pharm. Sci. 1979;
68:560-565.
17. Sheth A, Jarowski CI. Use of powdered solutions to improve the dissolution rate of Polythiazide tablets. Drug Dev. Ind. Pharm. 1990; 16:769-777.
18. Sekiguchi K, Obi N. Chem. Pharm. Bull. 1961; 9:866-872.
19. Jain NK, Parikh RH. Invitro dissolution rate enhancement of a combination of drugs via solid dispersion. Ind. J. Pharm. Sci. 1986; 48:64-66.
20. Broman E, Khoo C, Taylor LS. A comparison of alternative polymer excipients and processing methods for making solid dispersions of a poorly water soluble drug. Int. J. Pharm. 2001; 222:139-151.
21. Tachibana T, Nakamura A. Kolloid-Z Polym. 1965; 203:130-133.