E-learning support to the onboard marine engineer : towards an integrated model
110
0
0
Full text
(2) DECLARATION. I certify that all the material in this dissertation that is not my own work has been identified, and that no material is included for which a degree has previously been conferred on me.. The contents of this dissertation reflect my own personal views, and are not necessarily endorsed by the University.. (Signature)……………………………….. (Date)…………………………………….. Supervised by: Dr. Shuo Ma Position:. Vice Rector and Academic Dean/Professor of Shipping Management and Port Management. Institution/organization: World Maritime University. Assessor:. Dr. Imai Akio. Position:. Professor of Shipping Management and Port Management. Institution/organization: World Maritime University. Co-assessor:. Professor. Gary Crook,. Position:. Chief of Transport Section (Logistics Branch). Institution/organization: UNCTAD-United Nations Conference on Trade and Development.. ii.
(3) ACKNOWLEDGMENTS This thesis has marked the completion of a meaningful time at the World Maritime University, and an important place in my shipping career. I take this opportunity to thank those people who have made this possible. I am much obliged to my parents, my family, my fiancée and my relatives for continuously encouraging and supporting me with all their love. Without their help, I would not have completed this course or developed my career in shipping. I also wish to express my gratitude to all the people who have rendered their assistance and support towards this endeavour in various ways: •. Mr. Vo Nhat Thang, former deputy general director of Vietfracht, a lawyer, a maritime arbitrator and my counsel, for inspiring and guiding me into the shipping world and also, for nominating me to study at WMU. •. To the Canadian International Development Agency (CIDA) which sponsored my study at WMU. •. Special mention goes to the professors and staff of WMU for providing us with an ideal living and studying environment. In particular, I wish to thank Professor Shuo Ma, who supervised my work, and shared his wide shipping knowledge with me, and Professor Akio Imai for his kindness in sharing his research papers.. •. My gratitude is also extended to Ms. Jane R.C. Boyes, Editorial Director, and Ms Marie Bates, Senior Accounting Manager, Containerisation International (CI), for giving me access to CI data online. Thanks too, to Mr. Robert Willmington, Senior Researcher, CI, for spending precious time providing me with data and advice for my research.. iii.
(4) •. My thanks are also extended to Mr. Graham White, Support Services Manager, Fairplay, Mr. Carlos Canamero, UNCTAD and others for helping me to find data for this thesis.. •. My appreciation also goes to: Mr. Patrick Alain-Launay, Executive Director of MOL (Europe), Mr. Yasufumi Funao - Manager of MOL (Tokyo) Shipping Research, Mr. S.H Lee, Director of Pan Continental Shipping (Korea), Mr. Neil Everest- MOL (London) and other MOL (Vietnam) colleagues for their great assistances.. •. Special thanks go to Mr. Clive Cole for his esteemed guidance and English language correction; Ms. Cecilia Denne and Ms. Susan Wangeci-Eklöw, WMU Library, for their assistance in library research.. •. Last but not least, special thanks to all my friends and colleagues at WMU, who have made this journey worthwhile.. iv.
(5) ABSTRACT Title of Dissertation: A strategic study of the top 20 liners during period 1980-2001 Degree:. M.Sc. Since Malcom McLean started his business with the converted vessel ‘’The Ideal X’’, container shipping has been developed with double-digit average per annum growth. Containerised cargo is moving around the world as the result of globalisation, the lifting of trade barriers, the development of technology and so on.. Over the past 20 years, container shipping has been shown to be a high-risk business with a continuos changing of the list of the top 20 container service operators. The merging, acquisition and bankruptcy of some companies as well as the increase in capacity of the others have been witnessed.. This dissertation will studies: the changing in the ranking, capacity development of liners in the top 20 from 1980 to 2001; the factors and strategies that can lead to the success and failure of liners during this period; and the trends in the liner industry for the coming years.. This research shows the lists of ranking of liners from 1980 to 2001 based on the capacity deployed and the findings from the study of the top 20. It then comes to analyse a few selected liners, which the author thinks, outperformed others in offering container-shipping services. The trends, development in container shipping and the reactions of the top 20 liners to those trends are analysed in chapter 5. Finally, the last chapter summarizes the findings of this study.. Key Words: Liner, Strategy, Ranking, Capacity, Profitability, Top 20.. v.
(6) TABLE OF CONTENTS Declaration. ii. Acknowledgements. iii-iv. Abstract. v. Table of contents. vi-ix. List of tables. x. List of figures. xi. List of abbreviations. xii-xiii. Chapter 1: Introduction. 1-4. 1.1. Background. 1. 1.2. The outline of dissertation. 2. 1.3. Methodology. 2. 1.4. Limitation. 3. Chapter 2: Containerisation during 1980-2001 and liner shipping. 5-25. strategies 2.1. Global container shipping. 6. 2.2. Liner shipping strategies. 12. 2.2.1: Conference or non-conference. 12. 2.2.2: Alliance/ Consortium or Solo. 14. 2.2.3: The ownership or outsource. 17. 2.2.4: The status option: global carrier or niches carrier. 20. 2.2.5: The service option: multi-modal transport operator/ Logistics. 21. provider or Ocean carrier 2.2.6: The routing options:. 22-23. vi.
(7) 2.2.6.1: The round the world, end-to-end or pendulum service. 22. 2.2.6.2: Direct calling or hub-spoke service. 23. 2.2.7: Yield management. 24. Chapter 3: The top 20 liners during period 1980-2001 and some findings. 26-50. 3.1 The changing of the ranking and capacity development of liners during. 26-38. 1980-2001 3.1.1: The period 1980-1985. 26. 3.1.2: The period 1986-1990. 28. 3.1.3: The period 1991-1995. 32. 3.1.4: The period 1996-2001. 35. 3.2 Some finding from the study on the top 20. 38-45. 3.2.1: The top 20 is controlling more world fleet capacity. 36. 3.2.2: Big is bigger. 40. 3.2.3: Merger and acquisition help a carrier to jump to a higher rank. 42. 3.2.4: The top 20 liners have been increasing their chartered tonnage. 43. 3.2.5: The Asian carriers have dominated in the top 20. 44. 3.2.6: Maintaining rank means increasing capacity, even unprofitably.. 46. Capacity increased as a result of the short prosperous periods in shipping 3.2.7: Profitability is not correlated with a company’s size. 49. Chapter 4: Analysis of some selected carriers. 51-74. 4.1 Maersk-Sealand. 52-61. 4.1.1: Historical background and general information. 52. 4.1.2: A diversified shipping company. 53. 4.1.3: Decentralised organisation and effective network. 55. 4.1.4: Building corporate culture. 56. vii.
(8) 4.1.5: The industry influence and new technology application. 57. 4.1.6: Expansion. 57. 4.1.7: Branding. 58. 4.1.8: A solo, independent player. 59. 4.1.9: Yield management. 59. 4.2 MOL. 61-67. 4.2.1: Historical background and general information. 61. 4.2.2: A diversified shipping company. 63. 4.2.3: Management style and strategies. 64. 4.2.4: Partnership and long-term corporation. 66. 4.3 Evergreen. 67-69. 4.3.1: Historical background and general information. 67. 4.3.2: Changing strategy: from independence to corporation. 68. 4.3.3: Changing strategy: expanding to logistics. 69. 4.4 MSC. 69-72. 4.4.1: Historical background and general information. 69. 4.4.2: Organization and management. 71. 4.4.3: Tonnage policy. 72. 4.4.4: Service expansion. 73. Chapter 5: Some trends and developments in liner shipping. 75-81. 5.1 Tonnage policy. 75. 5.2 Consolidation. 76. viii.
(9) 5.3 Diversification. 77. 5.4 E-commerce and shipping portals. 77. 5.5 Alliance and conference. 78. 5.6 The growth trend of demand and supply. 80. Chapter 6: Conclusion. 82-86. References:. 87-93. Appendices. 94-97. Appendix A: The financial results of some liners from 1980-1989. 94. Appendix B: Carrier’s financial roller-coaster 1999-2001. 95. Appendix C: Shipping liners ranked by 2001 operating profit. 96. Appendix D: The growth of the world container traffic, the world container. 97. fleet capacity and the top 20 fleet capacity during period 1980-2001. ix.
(10) LIST OF TABLES Table 1. The World Container Traffic 1980-2001. 7. Table 2. The growth of the containership’s size. 9. Table 3. The alliances in shipping from 1996-2001. 15. Table 4. The development of ranking and capacity of the top 20 from 1980-1985. 27. Table 5. The development of world fleet capacity and world container traffic. 28. 1980-1985 Table 6. The development of ranking and capacity of the top 20 from 1986-1990. 29. Table 7. The development of world fleet capacity and world container traffic. 31. 1986-1990 Table 8. The development of ranking and capacity of the top 20 from 1991-1995. 32. Table 9. The development of world fleet capacity and world container traffic. 33. 1991-1995 Table 10. The development of world fleet capacity and world container traffic. 35. 1996-2001 Table 11. The development of ranking and capacity of the top 20 from 1996-2001. 36. Table 12. Comparison: World, the top 20 fleet capacity from 1980-2001. 40. Table 13. The capacity development of some liners from 1980-2001. 41. Table 14. Merge and Acquisition in the top 20 liners. 43. Table 15. The share of chartered-in capacity on the total of liner’s fleet capacity. 44. Table 16. MSC- Fleet composition profile. 72. Table 17. The conference and alliance member ship of the top 20. 79. x.
(11) LIST OF FIGURES Figure1. The growth of the container trade. 7. Figure 2. Regional container lift and world container fleet capacity. 8. Figure 3. Container fleet by size. 10. Figure 4. Economic of scale. 10. Figure 5. The building price of containerships. 11. Figure 6. World container fleet and world cellular fleet. 39. Figure 7. World Fleet Capacity and the top 20 fleet capacity. 40. Figure 8. Container lift by regions and percentage growth. 45. Figure 9. Regional breakdown of the top 20 -based on the number of liners. 45. Figure 10. Regional breakdown of the top 20 fleet capacity (% share). 46. Figure 11. Carrier size and profit margins in 2001- No correlation. 49. Figure 12. MSL -The development of fleet capacity and ranking 1980-2001. 53. Figure 13. MSL - Financial performance. 54. Figure 14. World coverage of major container terminal groups in 2001. 58. Figure 15. MOL- The development of fleet capacity and ranking 1980-2001. 62. Figure 16. MOL- Growth and expansion in 2001. 62. Figure 17. MOL- Financial performance. 64. Figure 18. EMC- The development of fleet capacity and ranking 1980-2001. 68. Figure 19. MSC- The development of fleet capacity and ranking 1980-2001. 70. Figure 20. The forecast of world container traffic to 2012. 81. xi.
(12) LIST OF ABBREVIATIONS ACL. Atlantic Container Lines. ACT. ABC Container Lines. APC. American President Companies (Parent company of APL). APL. American President Lines. APM. Arnold Peter Moller. BBS. Baber Blue Sea. BSC. Baltic Shipping Company. CEO. Chief Executive Officer. CGM. Compagnie Generale Maritime. CI. Containerisation International. CMA. Compagnie Maritime de Affretement. CRM. Customer Relationship Management. COSCO. China Ocean Shipping Company. CSAV. Company SudAmericana de Vapores. CSCL. China Shipping Container Lines. EMC. Evergreen Marine Company. FEU. Forty Foot Equivalent Unit. HLCL. Hapag Lloyd Container Lines. KSC. Korean Shipping Corporation. MISC. Malaysia International Shipping Corporation. MOL. Mitsui O.S.K Lines. MSC. Mediterranean Shipping Company. MSL. Maersk- Sealand. NOL. Neptune Orient Lines. NYK. Nippon Yusen Kaisa. OCL. Oversea Container Lines. OECD. Organization for Economic and Co-operation Development.. OOCL. Orient Oversea Container Lines. xii.
(13) POL. Polish Ocean Lines. PONL. P&O Nedlloyd Lines. TEU. Twenty Foot Equivalent Unit. UASC. United Arab Shipping Corporation. USL. United State Lines. VLC. Virtual Liner Company. WMU. World Maritime University. WSC. World Shipping Council. xiii.
(14) CHAPTER 1 INTRODUCTION. 1.1 Background. Globalization is spreading all over the world, Mr. Ikuta, former senior managing director of MOL, emphasizes that ’’International commerce is becoming increasingly global as more people throughout the world expect a better standard of living and availability of any merchandise they desire. Transportation is the key to serve that purpose’’ (Damas,P. December 1991,cover story). Traders are becoming bigger and they trade on the global scale wanting long-term, stable contracts with carriers on the global scale.. In shipping, carriers are facing globalization in both supply and demand. The customer is more demanding and wants the carrier to be big enough to serve their business demands in the global perspective. As the consequence, carriers have to expand their operations. We can see the picture of the capacity increase and the carrier’s ambition by examining the top 20 liners through the period 1980 to 2001.. In 1980, the top 20 liners shared around 40% of the total world’s fleet capacity, it was 43% in 1993, and 50% in 1997. In 2001, they controlled nearly 59% of the world container fleet and 83% of the world cellular fleet. In fact, the top 20 liners created a big barrier for the new comers entering the league.. 1.
(15) This research will try to discover and analyze data collected about those top 20 liners from 1980 to 2001 with the aim to achieve the objectives below: Ø To trace the development of their fleets Ø To find and analyse the strategies that can lead to the success and failure of liners Ø To find and analyse what makes some liners outperform their rivals or their changing strategies as they respond to the changes in liner shipping Ø To analyse the trends in liner shipping and the reactions of the top 20 liners to those trends. 1.2 Dissertation outline. Chapter 1:. In the introduction, the background and the purpose of the study are stated. Chapter 2:. Containerisation and the main liner shipping strategies. Chapter 3:. The top 20 liners during period 1980- 2001 and some findings from the study. Chapter 4:. Analysis of some selected liners: Maersk-Sealand, MOL, Evergreen and MSC. Chapter 5:. Some trends and developments in liner shipping. Chapter 6:. The Conclusion. 1.3 Research methodology:. All the collected data and reports were processed and analyzed in order to get the best picture of the top 20 liners. The ways of collecting data were as follows: ü Due to the fact that in container shipping carriers do not always inform and publish their fleet capacity, management, marketing strategies and financial. 2.
(16) situation, therefore all the shipping research and consultant companies have different data. Even one single consultancy may have different statistics. Some reports (UNCTAD’s Annual Maritime Review, OECD report, etc) were used statistics coming from several sources. Indeed, this creates conflicts where making comparisons for long periods of time. Therefore, in my research I tried to collect data from reliable sources as: v Data for a liner’s capacity and their ranking: Ø Containerization International (CI) v Data for market report, all analyses: Ø Lloyd’s List Ø Lloyd’s Shipping Economist Ø Fairplay Ø American Shipper Magazine Ø Containerization International Magazine. Ø Drewry Shipping Consultant Ø Clarkson Shipping Research Ø Platou Ø UNCTAD Maritime Reviews Ø Carrier’s report and their websites ü The statistics for the ranking and capacity of liners were based on the fleet capacity deployed in services (nominal capacity) but sometimes were quite approximate statistics due to: Ø The carrier’s subsidiaries: whether or not to include their subsidiaries or affiliates in their total capacity (for example: MSL and Safmarine, Hanjin and Senator, Evergreen and Hatsu, Lloyd Trestino,Uniglory). 3.
(17) Ø Ship particulars (True vessel’s capacity is controversial, the carriers and ship-yards did not disclose exactly the carrying capacity, like the case of Maersk- Sealand with its S- type vessel) ü Recently, due to the request from carriers, some research and consultant companies have revised their statistics. They have separated the capacity of the carrier with its subsidiaries (like CI). However, the author has kept CI’s previous rankings and statistics as the main source for this research, as those truly reflect the carrier’s capacity. ü The capacities were mainly figured as of a particular month of the year. Therefore the reader could find some small discrepancies between this research data and other publications as they used data figures at different times of the year.. Because of the difficulties in finding data, this research could not avoid errors. The author would appreciate having the understanding and comments of the reader.. 4.
(18) CHAPTER 2 CONTAINERISATION AND THE MAIN LINER SHIPPING STRATEGIES. Although containerization was started in 1965 by Malcom McLean with the converted vessel ‘’ the Ideal X’’, it was during the period 1980-2001 that container shipping developed rapidly and has been ‘’the engine driving our global economy, a key factor in making today’s economic globalization possible’’(WSC 2001, p. 27). Container shipping (liner shipping) is different from tramp shipping and is characterized by many economic and political factors (WSC, 2001, p17) that we can be seen below: v Operational features: Ø Services are based on a commitment with fixed and regular schedules Ø Ships must sail even without cargo on board. Ø There is a high fixed cost to operate regular services. Most costs are fixed, cargo handling costs are variable costs, Ø Self-regulated industry. No regulatory barriers for new entries Ø Inelasticity of supply and demand. Ø Subsidization from governments for some liners in shipping and shipbuilding.. 5.
(19) Ø Information and communication technology is more important than that of tramp shipping. Ø The imbalance of trade causes the imbalance of equipments Ø Service deployment or withdrawal is on large scale (network, capacity) Ø An international business, therefore the liner business is subject to national, international law and regulation. v Organizational features Ø Liner companies are large and complex with a network of offices and agents v Contractual features Ø Sometimes, there is no contractual document signed between parties before shipment and the bill of lading is the transport document. v Commercial features: Ø The tariff system is too complicated which may combine both the FAK rate and the commodity rate.. Like other shipping market segments, liner shipping is also governed by the rule of supply and demand. Since 1980, the world has been changing quickly and liner shipping has evolved into an international and complex industry. Liners have been struggling to maximize profits and minimize costs through many strategies and industrial trends.. 2.1 Global container shipping:. Container shipping has proved to be a high efficient means of transport with a low cost, fast transit time and low risk. Thanks to the globalisation process, the lifting of trade barriers and the development of new technologies, the cost per TEU has decreased annually. This has paved the way for containerisation to come into other shipping. 6.
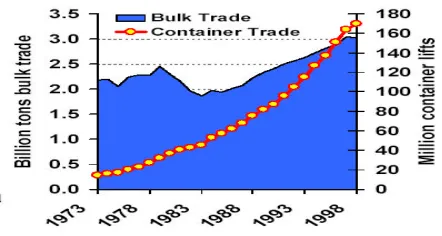
(20) sectors, which used to be served by bulk shipping. During the period 1980-2001, container shipping has penetrated the bulk market The total world sea-bone trade increased on average at 2-3% per annum (Stopford.M, 2002a, p.2), in which the container traffic grew on average at 6-8% per annum while the bulk trade grew 1-2% per annum only (figure 1). Figure 1: The growth of the container trade. Source: Clarkson (2002), http://www.clarksons.net/. According to the table 1, the world container traffic has increased steadily since 1980. In 1980, the world container traffic was only 37.2 million TEU. In 2001, it was 236.5 million TEU and 6.4 times larger than it used to be.. Table 1: The world container traffic 1980-2001 Year. World Container Percentage Traffic (million TEU) increase 1980 37.2 16.3% 1981 40.9 9.9% 1982 42.8 4.6% 1983 45.6 6.5% 1984 53.3 16.9% 1985 55.9 4.9% 1986 60.9 8.9% 1987 67.3 10.5% 1988 73.8 9.7% 1989 78.5 6.4% 1990 85.6 9.0% Source: Combined from CI. Year World container Percentage Traffic (million TEU) increase 1991 93.6 9.3% 1992 102.9 9.9% 1993 113.2 10% 1994 128.3 13.3% 1995 137.2 6.9% 1996 147.3 7.4% 1997 163.7 11.1% 1998 171.5 4.1% 1999 203.2 18.5% 2000 225.2 10.8% 2001 236.5 5.0%. 7.
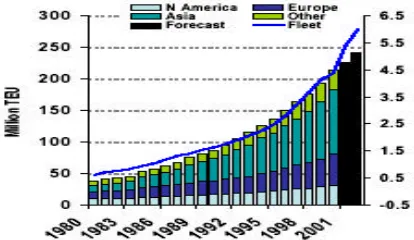
(21) The major markets of containerisation are North America, Asia and Europe. The health of those economies creates impacts on the development of container traffic. In the 1980s, the United States of America adopted a policy to stimulate the domestic consumption, so-called ‘’Reaganomics’’ (Jamri, 1990, p.3) that increased the consumption expenditures and created more trade in the world.. Especially, in Asian countries. (Taiwan, Korean, Philippines, Singapore and Malaysia), trade grew tremendously because their economics are largely dependent on exports to the USA.. In the 1990s, the world changed faster than ever because of: the globalisation process, the emergence of Asian ‘tigers‘, the policy developments of the USA, the EU countries and others. Trade agreements among countries or in the region have been adopted like GATT (WTO), EFTA, and AFTA. These agreements have facilitated the movement of cargo around the world. North America, Asia and Europe are the three biggest markets for containerisation (see figure 2). As the major trading partner of the USA and EU, Asia appeared as the area with the strongest growth and the Intra-Asia lifting increased all the time with hundreds of shipping companies operating services. Figure 2: Regional container lift and world container fleet capacity. Source: Clarkson (2002), http://www.clarksons.net/. 8.
(22) Ma (2001, p.14) emphasizes that ‘’the shipping industry has been the sector where probably the most significant in productivity has been experienced during the last 40 years’’. The developments of containerisation and new technology have been the main factors that contributed to the increase in the size of the containership.. Since the first generation of container ships deployed in service in 1964, containerships have passed to the 5th generation nowadays (table 2). The economics of scale forced carrier to pursue large ships and tonnage. People in the industry are now discussing the mega-ship of 10,000 TEU or 12,000 TEU. However, many people are wondering about this application, as it may turn out to be a ‘dis-economy of scale’ if the ship’s allocations are not fulfilled.. Time 1964-1967 1967-1972 1972-1984 1984-1995 1995- now. Table 2:The growth of the containership’s size Generation Capacity (TEU) st 1 generation 1000 2nd generation 1500 3rd generation 3000 th 4 generation 4500 5th generation 6000 and over. Source: Author compiled from Drewry. In the 1970s, liners preferred to use multipurpose ships or Ro-Ro ships for carrying containers. Thus, specialization in the shipping industry has made the carrier specialise their fleet to the fully cellular ship. The fleet of cellular ships increased by 144% between 1980 and 1990, while the total world fleet capacity increased by 111% (Drewry 1991, p.65). In 2001, most of the liner fleets were cellular containerships in which the top 20 liners held 83% of the total world cellular fleet (Willmington. R, 2002, p.7).. All the liners wanted to achieve a so-called ‘’economics of scale’’ by ordering new, bigger ships. The number of bigger ships increased tremendously as figure 3 illustrates. In 2001, according to the CI data bank, there were 155 ships (5,000 TEU plus capacity). 9.
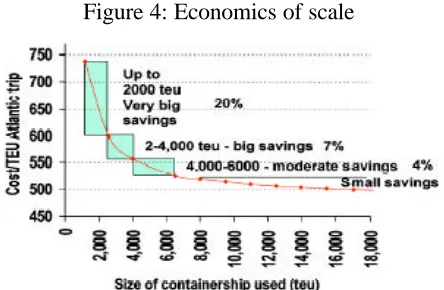
(23) and 435 ships (3,000-4,999 TEU capacity). The post- panamax fleet is continuing to grow and the mega ship (over 10,000 TEU capacity) may be introduced into services in the coming years. Figure 3: Container fleet by size. Source: Clarkson (2002) However, Stopford (2002, p.4) revealed: ‘’the average ship size is not always increased’’, the average size being 2,200TEU in 1988, 1800 TEU in 1992, 2200 TEU in 1998 and 3300 TEU in 1999-2003 (order book included). At the CI conference in April 2002, Stopford emphasized that the unit cost could save 20% by increasing the ship size from 1000TEU to 2000 TEU, by 7% from 2000 TEU to 4000 TEU and only by 4% from 4000 TEU to 6000 TEU (see figure 4) (‘Size is not everything’, June 2002). Figure 4: Economics of scale. Source: Clarkson (2002), http://www.clarksons.net/. 10.
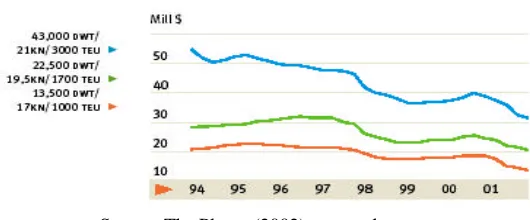
(24) In the new building market, the prices of new buildings have slightly decreased (see figure 4) as the result of the moving orders from European shipyards to the Asian shipyards in Japan, Korean and China. Figure 5:The new building price of container ships. Source: The Platou (2002), www.platou.com. The main reasons for this shifting are: the reduction of EU subsidies to the shipbuilding sector, the labour relation problem in European shipyards during the 1980s and the high productivity, the lower cost of Asian Shipbuilders.. Despite the increase in the world container traffic and the low price of new buildings, the profitability in liner shipping was under expected. The freight rate has decreased over time, ocean freight now accounts for a small portion (around 2% or less) of the total cost of cargo transported. According to the analysis published on CI-online recently, between 1993-2001, the freight decreased at an annual rate of ‘’5% on the transpacific, 4% on the transatlantic, and 6% on the Europe/Asia’’ (Déjà vu, June 2002). In the period 1980- 2001, container shipping has been underwent many changes on both the supply and demand sides and liners struggled for survival in the game by implementing many shipping strategies to adapt to the situations. Some failed and were out of the game while others continued to develop. In the next part, the main liner shipping strategies during 1980-2001 will be examined in order to reflect their response to the changes.. 11.
(25) 2.2 – Liner shipping strategy:. ‘Shipping is a highly volatile business’’ (Wergeland.T 1992, p. 541). Indeed shipping is a high-risk industry, one can earn a lot of money in this month but he can lose all in the next month if the wrong decision on investment, strategy was chosen. The container shipping is even more risky, as Sir Yue-Kong Pao, former chairman of world wide shipping, once described as ‘’a poker game – you just have to keep putting more money on the table which you are about to lose’’ (Drewry 1991,p.9). Nowadays, liners have been seeking many ways in order to survive and to be profitable in the game. There are many individual strategies taken by liners, however there are some main areas of conceptual and organizational strategies where carriers have to make decision: Ø Conference or non- conference Ø Alliance/ consortium or solo Ø The ownership or outsource Ø Global carrier or niches carrier Ø Total logistic provider or ocean carrier Ø The routing option: RTW, Pendulum, End-to-end, Hub-spoke or direct call service. Ø The yield management. 2.2.1 Conference or non- conference:. As mentioned above, the liner services are based on the commitment of fixed schedules and regular services. In the past, there were some liners deployed on services when the trade was profitable and withdrawn when the trade was weak. This caused an unfair situation for other liners and of course to the traders. Beside, the fierce competition and. 12.
(26) the lower ROI (return of investment) also pushed liners to cooperate in order to stabilize the market, to minimize cost.. During the period 1980-2001, shipping lines have much enjoyed the umbrella of the freight conference system, which helped them to maintain and stabilize the freight market. The conference and rate agreement was said to: ‘’have been about as effective in halting the drop [freight rate] as a parasol for a skydiving elephant’’ (‘Conference countdown’, 1998, p.24). Today, the number of freight conferences has been reduced in comparison with that of in the last decades, however they still remained and have impacts on the major trades. The reasons for this decrease are not only due to regulatory requirements but also from the strong growth of non- conference members. The period 1980-2001 witnessed the change in the freight conference system through the regulations: the 1984 Ocean Shipping Act (for the right of independent action), 1998 OSRA- Ocean Shipping Reform Act (individual contract), EC regulation 4056/86 (Block exemption in relation to the EU competition rules).. There were two types of conferences: open and closed conference, but the closed conference was abandoned by the EC and USA. In the 1980s and early 1990s, the choice to be a conference member was also based on the regulatory requirement of the different law system: Ø US Trade: (open conference) A liner was entitled to join any conference provided it satisfied the membership’s requirements. Ø Europe trade: (close- conference). 13.
(27) The closed conferences controlled the admission of new liners by the various stringent requirements: market share, service quality, etc.. The conference system has both disadvantages and advantages in view of liners: v Advantages: Ø Controlling, managing the capacity and facilitating corporation among members for minimizing cost and expanding services. Ø Providing a stable rate, regular service and efficient capacity to the traders Ø Creating one voice to authorities to protect member’s interests. Ø Offering security to the carrier for capital investment. v Disadvantages: Ø Strictly binding conference rules and arrangements (freight and capacity) thus not being flexible for a liner to change its strategies (operation, marketing, sale and pricing) when there was suddenly a change in demand or supply side or when the liner wanted to take independent action for any rate item. Ø Application for being a conference member was (sometimes) a long process Ø Costly, bureaucratic Ø Being the objects of some authorities and organizations like OECD, shipper councils, etc to claim for the antitrust exemption.. A liner decided to be a conference member or outsider based on its policies and the company’s objectives.. 14.
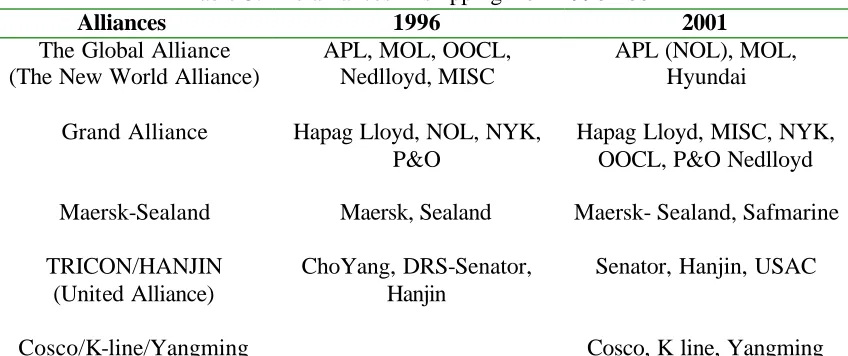
(28) 2.2.2 Alliance/ Consortium or sole: The need for co-operation among liners is more demanding than that in any other industry due to the liner shipping’s characteristics and the changing of the global economy. In 1972, the first consortiums named TRIO (included OCL, BLC, Hapag Lloyd, MOL, NYK) and ScanDutch (East Asiatic, Tran-Atlantic, Wilhelmsen, Nedloyd and CGM) were formed and those lasted till the early 1990s. Two consortiums operated in the different philosophies. For TRIO, members had their own marketing policy and the neutral body- the TRIO Tonnage Center, controlled the ship schedule and allocation arrangement. For ScanDutch, consortium members created the new marketing organization and sold services under the consortium brand, in each country one member was nominated as the liner agent (Drewry 1991, p.25).. Passing over time, only TRIO ‘s philosophy remained and became the liner consortium’s standard. In the 1996, the concept of strategic/global alliance was developed from the TRIO consortium philosophy with the new alliances in the industry- the Global alliance, the Grand Alliance, Tricon, Maersk- Sealand (see table 3). Table 3: The alliances in shipping from 1996-2001 Alliances 1996 2001 The Global Alliance APL, MOL, OOCL, APL (NOL), MOL, (The New World Alliance) Nedlloyd, MISC Hyundai Grand Alliance. Hapag Lloyd, NOL, NYK, P&O. Hapag Lloyd, MISC, NYK, OOCL, P&O Nedlloyd. Maersk-Sealand. Maersk, Sealand. Maersk- Sealand, Safmarine. TRICON/HANJIN (United Alliance). ChoYang, DRS-Senator, Hanjin. Senator, Hanjin, USAC. Cosco/K-line/Yangming. Cosco, K line, Yangming. Source: compiled from various sources. 15.
(29) The parties in the alliance agreed on the full operational integration, employment and utilization of vessels in the global scale. The pros and cons of joining consortium/alliance can be summarized as below: v Advantages: Ø Maximizing the use of capital investment Ø Achieving economies of scale in deploying bigger ships in service that an individual carrier alone could not fulfill her capacity and achieving bargaining power for operational costs and expenditures. Ø Offering more frequent, reliable services Ø Improving the quality of services Ø Sharing the use of other assets: vessel, port, terminal, equipment, etc Ø Taking other advantages to penetrate the new market Ø Being able to offer global services to global customers v Disadvantages: Ø Causing problems in balancing member’s interests Ø Holding dissimilar views as the gap of different cultures Ø Falling into the dilemma if a member was merged or took over by another or went bankrupt. Ø Binding by the alliance rule and requirements Ø Being in-flexible in changing liner strategies Ø Being a homogenous service, cargo booked to different liners will be loaded on the same ship, transit at the same hub and get the same service. Minimizing costs can be better achieved by joining an alliance Mr. C.C Tung, CEO of Orient Oversea (International) Ltd, revealed: ’’carriers today are not only under pressure to achieve further cost reduction but also need to match the cost efficiency of the largest. 16.
(30) existing carrier group’’ (Damas.P, 2002 C). However, one of the biggest obstacles is to choose a consortium/alliance partner as Mr. Lim How Teck, NOL’s chief executive officer, in the interview with Containerization International in 1990 emphasized: ’’a consortium work best when all member are the same, preferably small size. Then they all need each other. If members are of different sizes, the thing will not work. The bigger will know they can live without smaller’’ (Drewry, 1991, p.26). 2.2.3 The ownership or outsource:. During the period 1980-2001, many decisions on ownership or outsourcing, buying or leasing have been seen in the industry. These varied from company to company, and were based on various factors like: subsidiary of government, the cost of finance, the taxation system, cash flow considerations, off balance sheet financing, etc.. The assets, in which liners have to invest are the hardware and software (containership, containers, chassis, trailer, port, depot, wagon, computer, regional office, administrative office- ship management, etc). Wergeland (1997, p.565) remarks: ’’to have success in shipping, timing is everything’’. Indeed, to choose the right option ownership or outsourcing is dependent on the time and various situations and found ‘’through competitive advantage analysis’’ (Shuo Ma, 2001b, p.14). We shall examine those two options as follows:. Ownership v Advantages Ø Increasing liquidity if the assets acquisition was taken at the right time Ø Creating the image of being more committed to the market Ø Being more flexible in changing operations, management of assets Ø Creating synergy for overall activities. 17.
(31) v Disadvantages Ø Increasing capital for investment and maintenance assets Ø Being less flexible to change. Outsource v Advantages: Ø Reducing capital investment Ø Achieving economics of scale, expertise, know how from the third parties Ø Concentrating on the core business Ø Controlling costs more easily Ø Being more flexible in changing strategies v Disadvantages: Ø Depending on the other’s operations, less controlling over assets Ø Considering as being not service committed in the long run. According to Mr. Poon, managing director of OOCL, ownership or outsource decisions are taken based on two fundamental criteria: ‘‘first, unless you can provide the same product or service at a cheaper cost, you must outsource it. The second criteria is not to over invest, because if the assets or service is not appreciated by the customer, they will not pay for it’’ he also emphasizes that ‘’we have to build our capabilities not our capacities’’(‘Poon aims…game’, 1999, p.10).. Container shipping is asset based and a network industry. The unpredictable volatility of earnings and assets values reflects this high-risk shipping industry. Generally, in other shipping segments, the successful company is the one who has “maintained liquidity capacity by trading ahead of the market” (Drewry, 1983 page 25). This means, one can purchase a ship at the bottom price and sell it at the top of the market. If the ship is purchased at the bottom price, it will have a competitive advantage (lower fixed costs) in. 18.
(32) comparison with that of a similar ship bought at a higher price. However, this effective/famous philosophy could hardly be applied to container shipping where liners have to keep vessels in the regular service and cannot withdraw a vessel for ‘‘asset play’’. So in container shipping, the question on the asset option: ‘Ownership or Outsource’ should be considered very carefully and is a strategic decision for the liner.. Liners operating on the main routes usually own a fleet. By doing so, they can enhance their image in the market as the long-term service provider and that is crucial in the marketing process. Some liners prefer acquiring new buildings (Maersk, APL, MOL, etc) others prefer second hand ships (MSC). There is a trend in the industry that a liner acquires a ship then sales it and leases it back. This method shows an effective way of combining the advantages of: asset play, owner ship and outsourcing. A ship owner can make a profit from the new acquisition when the market is low or there are favors from the tax regime, then sells the ship when the market is high and leases it back for its operation without interfering with its regular services.. Port, terminal activities and value added services could bring better ROI (Return on Investment) than that of sea transport. Therefore, liners are trying to own depots, terminals and other inland facilities in order to create a synergy for their business and ‘‘provide a very high quality end-to-end service’’ according to Mr. Kjaedegaard, senior vice president of MSL. (Beddow.M, 1999, p.46).. The liner service is required to have a network of offices. The question of establishing an in house office network or nominating agency is also quite important to decide. When the cargo volume and trade activity is sufficient enough, it is better to establish an in house office. However the ‘‘controlling’’ idea in selling, commercial and operational activities is privileged. More and more liners are setting up their in house offices instead of appointing an agency.. 19.
(33) 2.2.4 The status option: Global carrier or niches carrier. At a matter of fact, together with a liner’s ambition, if the liner has good financial capacity, it may want to expand its service to all major trades of the world and to be global carrier. In case, if they have limited financial resources, they will satisfy themselves to be a niche carrier. However the questions of ‘‘is big or small beautiful’’ or ‘‘is it necessary to be small in every market or big in a few?’’ are really a pivotal matter of liner strategy. In the 1980s and early 1990s, people said that the North –South trade was for niche carriers as those trades were so ‘‘specialized that was not suitable for global carrier’’ (Damas.P, 1991, cover story) and the East-West trade was for global carrier. Actually, there is no firmly definition or concept about the global carriers, but its main characteristics are: ü Strong corporate branding ü Present in all major trades: East –West, North South ü Value added services ü Market share ü Financial capacity ü Global commercial orientation and ambition. For the niche carrier, its characteristics can be summarized as: ü Sufficient size to be profitable ü Potential growth ü Specialist market ü Regional commercial orientation and ambition. ü Strong market share Shipping has changed to cope with the globalization process in both supply and demand. To trade with the global carrier, customers can ‘‘be assured of high quality service world wide’’ as Mr.Takashi.H, senior managing director of NYK stated and ‘‘expect a more. 20.
(34) long-term service from global carriers than from single trade operators’’ as Mr.Ikuta, former senior managing director of MOL said (Damas.P, 1991, cover story). However, other liners did not support this argument, Mr. Mikolajczak, deputy chief executive of CMB, remarks: ‘‘shipper, even those moving into the global markets, sooner or later will discover that no shipping company in the world is strong in every trade. Shippers will always find ways and means to best suit their needs, which are not necessarily through a one-stop-shopping global carrier’’(Damas.P, 1991, cover story). While many liners want to be on the global scale like: Maersk-Sealand, MOL, NYK, HLCL, CMA, Evergreen, etc some liners prefer to be ‘’big fish in several small ponds’’ and want to call themselves the niche carriers (ACL for Europe-American, Delmas for EuropeAfrica trade). Recently the trend of M&A (Merge and Acquisition) continued on both the supply and demand sides, with the result that there will be few liners in the world but they operate on the global scale and are truly global carriers.. 2.2.5 The service option: Multi-modal Transport Operator/Logistics Provider or Ocean Carrier?. Since 1980, there has been a strong demand for multi-modal transport and the United States of America became the flourishing land for multi-modal transport development. In that decade, most liners wanted to be involved in multi-modal transport with the hope of getting better revenues and offering more services to customers. In the early 1980s, liners were involved in inland transport (road, rail and water way). In the late 1980s they wanted to devote more value added services to customers by expanding their scope of business to cover all the supply chain management. Liners wanted to create ‘one stop shopping’, to offer total logistics from the production sites to the consumer sites. During this period, we can see the changes in the terminology concepts, liners claimed themselves to be Ocean carriers, Multi-modal Transport Operators, Container Service Providers, and now to the Total Logistic Providers.. 21.
(35) Is it necessary to be in all the parts of the game ‘Supply Chain Management?’ Some liners say ‘yes’ and others say ‘no’. The business philosophies of liners are more or less different.. MSL, MOL, APL, NYK, PONL, etc re-branded themselves as the total. logistic providers. They wanted to expand more in the supply management chain while other liners (Evergreen) wanted to concentrate on sea transport only. Still others are in the middle of the stream in this option. Liners found opportunities in the supply chain management as they could get higher profits from the logistics and value added services offered to customers (Thorby.C, 2001, April). Therefore, we could expect more diversification of liners into other transport modes.. 2.2.6 The routing options. 2.2.6.1: The round the world, end to end, pendulum, double dipping service:. One of the main problems of liners is how to increase the utilization of ships and improve the slot earning capability. Beside many other strategies, to choose the best suitable routing option can be the most effective way. There are four main routing options: end -to-end, pendulum, double dipping and round the world service. End-to-end is the traditional service in liner shipping, the pendulum operating as the end-to-end service but through the intermediate market. In 1985, Evergreen and USL debuted the round the world service (RTW) which covered the major trades with big capacity vessels. Through the RTW service, they hoped that the vessel could get high utilization as she carries cargo over from one leg of the service routes to another. Because of the imbalanced trade, the technical and operational problems, now there are few liners operating this type RTW service.. Choosing the right routing options should be based on the economic study of each liner in accordance with their capabilities.. 22.
(36) 2.2.6.2: Direct calling or hub-spoke service. The size of the ship has been increasing rapidly in order for the liner to achieve ‘economic of scale’. There are many reasons that bigger ships could not call at some ports such as: insufficient cargo, draft restriction, minimizing the turn around time in the port and reducing the number of ports served. Therefore, liners have to make their clear decisions by choosing between two alternatives: Ø The Direct calling Ø The Hub-spoke service. When choosing one of them, various factors must be taken into consideration like: Ø Cost comparison Ø Cargo volume Ø Political, technological reasons Ø The ambition of liners Ø The availability of feeder networks in the region Ø Customer policy (transit or direct call). Ma (2001a, p.89) remarks: ‘‘in many case, transshipment or direct call is an economics decision’’ and liners have to make a comparison for the ‘‘total cost which includes ship related costs and cargo related costs.’’. 2.2.7: Yield management:. The liner business is a more sophisticated industry than that of others. People not only need to utilize the allocation of ships, they need to consider the total cost of the business (sales, customer service, vessel, terminal, inland transportation, equipment, overhead, etc.). Nowadays, all liners want to devote a “ global service” to customers by deploying. 23.
(37) more ships and equipment. However, trade imbalance caused liners in the dilemma of surplus or shortage of equipment. The equipment repositioning cost is a huge amount so they try to cut the cost of repositioning by: Ø Using cheaper cost ships and terminals to move empty equipment, Ø Using affordable containers Ø Pooling information, direct interchange (DIR) among the alliance members Ø Leasing or off hiring from the container leaser. However, in fact, these are negative ways of solving a problem when it has already occurred. “Prevention is better than cure”, liners should have strategies and contingency plans to reduce and avoid the imbalance of equipment rather than to pursue the abovementioned methods. The way out for this headache, a costly matter, is the yield management strategy. Hapag Lloyd, MSL and others have implemented this yield management effectively and successfully. By doing so they are now considered as one of the most profitable liners in the world. The following are the key elements of yield management: ü All staff from the board of directors to simple staff are aware of the importance of equipment control, inland operation in determining company financial success ü To establish the yield management system for controlling the productive time of equipment ü To consider the “total cost “ of the business rather than isolated business ü To classify customers to different categories and use different strategies for each of them ü To categorize customers for selecting the most profitable cargo based on a ‘'winwin” situation. 24.
(38) ü To negotiate with the customer for the best utilization of equipment for their cargo; to have confidential negotiations of contract with customers. ü To control the cost of inland haulage ü To locate inland points (ICD, depot) for flexibility of shipment ü To introduce an effective IT system to support the yield management ü To have a database of the total cost structure of every point (inland and sea port). Yield management is the best way that liners should implement for their operations. There are many other strategies and management ways that liners have applied in practice. Besides those above-mentioned strategies, liners also consider some strategies such as: decentralization or centralization, M&A, diversification or specialization.. ****************************************************. This chapter has gone through the development of containerization and some basic strategies that liners have to take for their operations. All those strategies could lead to the failure or success of a liner. ‘‘A poker game - you just have to keep putting more money on the table which you are about to lose’’ (Drewry 1991,p.9). Yes, that is container shipping where liners have to continue investing money into their operation and hope to get it back. But things do not always go as they expected, shipping markets are changing in circles. Some good years will be followed by bad years. Liners have to take prompt and proper strategic decisions to get enough profit to cover the bad years. All these things caused the ups and downs of the top 20 liners from 1980-2001 and the next chapter will investigate those changes.. 25.
(39) CHAPTER 3 THE TOP 20 LINERS DURING PERIOD 1980-2001 AND SOME FINDINGS 3.1. The changing of the ranking and capacity development of carriers during 1980-2001. In the back issues of various maritime publications such as: CI, Lloyd list, American Shipper, Drewry reports, European Shipper Council, etc we can read the big titles about the top 20 such as ‘‘the bigger have got bigger’’, ‘‘the top 20’’, ‘‘top cat’’, ‘’ leader of the pack’’, ‘‘top 20 boost share’’, ‘‘top 20 tighten their grip’’, etc. By tracking the development in both capacity and ranking of the top 20-container shipping liners, the top 20 is really a powerful force in the whole world container shipping. The appearance and disappearance of liners in the list, besides external environmental conditions, could be caused by the successful or failed strategies which were taken by individual liners at a particular time as explained in chapter two. Below, the development of the world container, top 20 fleet capacity and world container traffic during the period 1980-2001 will be examined.. 3.1.1 The period 1980-1985 After the peak period of 1979-1980, the world economy went into recession from 1980-1982 in which GDP growth fell from 2.2% in 1980 to 1.1% in 1982. The world container traffic growth decreased from 16.3% (1980) to 4.6% (1982), however the world container fleet continued to expand with a growth of up to 15% in 1982 (table. 26.
(40) 5). As a result, the supply was exceeded demand and many vessels had to be laid up as per research by the NYK research chamber revealed: ‘’ the container ship subsector, too, reflected the slacking of cargo on many route. At the end of 1982,full and semi-container ship suspended from service on a long-term basis, or laid up, total some 1.5m GRT or 53,000TEU'’ (Koike.Y, 1983, p.35). All liners faced the decrease in demand and the world container fleet growth was – 1% for 1983.. Table 4: The development of ranking and capacity of the top 20 from 1980-1985 SEPTEMBER 1980 Carrier Sealand Hapag Lloyd OCL Maersk line Nedlloyd NYK MOL CGM Evergreen APL OOCL USL BBS Seatrain ZIM Yangming ACT K line Safmarine ACL Top 20 Total World Total Top 20 Share. TEU 45,367 42,208 36,201 32,749 29,416 27,607 27,223 27,153 27,125 23,585 21,488 20,408 19,934 19,897 17,304 15,060 14,748 12,626 11,149 10,926. SEPTEMBER 1981 SEPTEMBER 1982 SEPTEMBER 1983 SEP TEMBER 1984 Carrier Sealand Hapag Lloyd Maersk Lines OCL OOCL Nedlloyd MOL CGM NYK Evergreen APL United State lines BBS ZIM K line Yangming ACT Safmarine Korea Shipping Corp. ACL. 482,174 Top 20 Total 1,200,000 World Total 40.2% Top 20 Share. TEU Carrier 47,000 Sealand 46,098 Hapag Lloyd 38,800 Maersk 37,653 OCL 34,178 MOL 31,116 OOCL 29,584 Nedloyd 28,524 NYK 28,497 APL 27,664 Evergreen 23,585 CGM 23,124 USL 20,021 Zim 18,090 NOL 14,640 K Line 14,573 BBS 14,536 Yang Ming 12,540 ACT 11,720 CMB 11,469 Safmarine 513,412 Top 20 Total 1,350,000 World Total 38% Top 20 Share. TEU Carrier 51,846 Sea-Land 48,817 Hapag-Lloyd 45,500 Maersk 41,275 OCL 36,673 Nedlloyd 36,130 OOCL 31,193 MOL 31,133 APL 30,523 US Lines 28,998 Zim 27,974 NYK 24,194 Evergreen 22,102 CGM 21,600 Wilhelmsen 20,473 Yangming 20,021 K-Line 17,036 Star Shipping 14,151 NOL 12,956 POL 12,865 EAC 575,460 Top 20 Total 1,551,000 World Total 37.1% Top 20 Share. TEU Carrier 60,302 Evergreen 49,816 Sealand 45,500 Maersk 43,986 Hapag-Lloyd 43,446 OCL 32,717 USL 31,659 Nedlloyd 30,523 MOL 29,956 OOCL 29,570 CGM 29,509 Zim 28,968 NYK 27,974 APL 22,633 NOL 20,728 K-Line 19,421 UASC 18,998 Yang Ming 18,610 BBS 17,896 POL 16,064 ACL 618,276 Top 20 Total 1,527,948 World Total 40.5% Top 20 Share. JULY 1985. TEU Carrier 74,132 Evergreen 60,302 US Lines 56,100 Sea-Land 53,817 Maersk 49,480 Hapag-Lloyd 42,610 OCL 41,560 Nedlloyd 40,885 NYK 37,597 MOL 34,383 Zim 33,283 CGM 33,262 Cosco Shanghai 30,523 UASC 28,334 OOCL 27,120 APL 23,804 Yangming 23,409 K-Line 18,000 Star Shipping 17,896 POL 17,141 DSR 743,638 Top 20 Total 1,753,000 World Total 42.4% Top 20 Share. TEU 85,714 78,850 61,945 59,317 45,179 44,899 39,497 37,975 35,662 35,194 35,088 34,987 34,964 33,755 32,481 23,409 22,787 21,998 18,763 18,514 800,978 2,211,763 36.2%. Source: compiled from CI. In the list of top 20 from 1980-1983 (table 4), we did not see many changes in the ranking of liners. Sealand was always the leader of the top 20 and Hapag Lloyd was the second ranked. Coming to 1984, the total top 20’ s capacity increased tremendously by nearly 20% from 1,52 million TEU (1983) to 1,75 million TEU. Those increases in 1984 and 1985 were partly due to the new ships, which were ordered from previous years, deployed in the service and partly due to the new routing concept RTW- Round The World service introduced by United State Lines (USL) and Evergreen. With the RTW service, USL and Evergreen brought a massive capacity into the market. USL lines used 12 vessels of 4,258 TEU capacity while. 27.
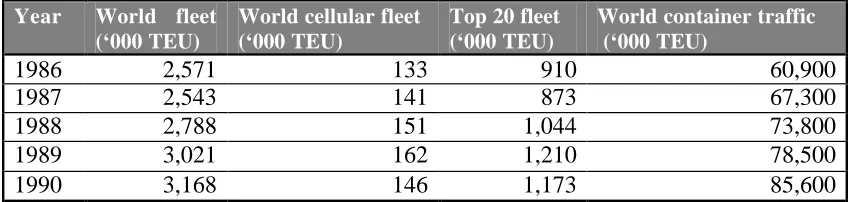
(41) Evergreen ran 22 vessels of 2,728-2,982 TEU capacity in services. (Drewry, 1986, p.61). The market had been already suffering with the over-tonnage situation but now evens became more serious. Carriers faced with the hard time of capacity surplus and fierce rate competition with those two RTW operators, were trying to fulfil their big hungry ships. Two big lines - Sealand and Happag Lloyd were pushed to give way the 1st and 2nd rank to Evergreen and USL. The surprise for 1985 was the jump of Chinese carrier COSCO, being the first time in the list in 1980 but ranked 12th.. In the USA market, the US Shipping Act 1984 gave exemption for the conference and recognized the benefit of the conferences system to the US sea-born trade. Thus, in 1985, most of the carriers in the top 20 had joined the conferences: Trans-pacific Westbound Rate Agreement–TWRA, Asia North America Eastbound Rate Agreement-ANERA like: Evergreen, USL, MOL, NYK, K Lines, OOCL, NOL, Hanjin, Zim, BBS, APL, Sealand, Lyke (Drewry, 1986, page 74-76). Between 19801985, the world container traffic increased by 50%, while the total world fleet capacity increased by 84% and the top 20 capacity increased by 66% (table 5). Table 5: The development of world fleet capacity, World container traffic 1980-1985 Year. 1980 1981 1982 1983 1984 1985. World fleet (‘000 TEU). World cellular fleet (‘000 TEU). 1,200 1,350 1,551 1,527 1,754 2,211. 665 702 799 883 1,012 1,160. Top 20 fleet (‘000 TEU). World container traffic (‘000 TEU). 482 513 575 618 743 801. 37,200 40,900 42,800 45,600 53,300 55,900. Source: compiled from various issues of CI, Drewry. 3.1.2: Period 1986-1990. In September 1986, the top 20 continued to increase their capacity by nearly 14% in comparison with that of July 1985 (table 7). There were three main reasons: Ø The increase in demand. 28.
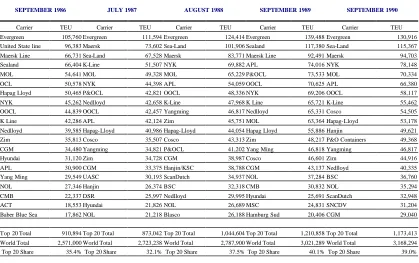
(42) Ø The need to achieve economies of scale and reduce cost by new, bigger ships with new technology Ø The ambition of liners to increase their market share However, things did not happen as the liners expected, as the lower unit cost of bigger ships could be obtained only when most of the allocations were fulfilled. Those, with the imbalance of trade, were the main causes leading US lines into the bankruptcy at the end of 1986. In 1987, all US lines vessels were laid up or withdrawn from service. That was a hard time in the market; few new orders were placed and with an ageing fleet, the liner ‘‘had to sell operational expensive container tonnage’’ (‘Period of transition’, 1989, p.13). So the top 20 capacity was reduced from 910,894 TEU in 1986 to 873,042 TEU in 1987 and the growth rate decreased by 4% (table 7) Table 6: The development of ranking and capacity of the top 20 from 1986-1990 SEPTEMBER 1986 Carrier Evergreen United State line. TEU. JULY 1987 Carrier. AUGUST 1988 TEU. Carrier. SEPTEMBER 1989. TEU. Carrier. 124,414 Evergreen 101,906 Sealand. TEU. SEPTEMBER 1990 Carrier. 139,488 Evergreen 117,380 Sea-Land. TEU. 105,760 Evergreen 96,383 Maersk. 111,594 Evergreen 73,602 Sea-Land. 130,916 115,367. Maersk Line Sealand. 66,731 Sea-Land 66,404 K-Line. 67,528 Maersk 51,507 NYK. 83,771 Maersk Line 69,882 APL. 92,491 Maersk 74,016 NYK. 94,703 78,148. MOL. 54,641 MOL. 49,328 MOL. 65,229 P&OCL. 73,533 MOL. 70,334. OCL Hapag Lloyd. 50,578 NYK 50,465 P&OCL. 44,398 APL 42,821 OOCL. 54,059 OOCL 48,336 NYK. 70,625 APL 69,206 OOCL. 66,380 58,117. NYK OOCL. 45,262 Nedlloyd 44,839 OOCL. 42,658 K-Line 42,457 Yangming. 47,968 K Line 46,817 Nedlloyd. 65,721 K-Line 65,331 Cosco. 55,462 54,505. K Line. 42,286 APL. 42,124 Zim. 45,751 MOL. 63,364 Hapag-Lloyd. 53,178. Nedlloyd Zim. 39,585 Hapag-Lloyd 35,813 Cosco. 40,986 Hapag-Lloyd 35,507 Cosco. 44,054 Hapag Lloyd 43,313 Zim. 55,886 Hanjin 48,217 P&O Containers. 49,621 49,368. CGM Hyundai. 34,480 Yangming 31,120 Zim. 34,821 P&OCL 34,728 CGM. 41,202 Yang Ming 38,987 Cosco. 46,818 Yangming 46,601 Zim. 46,817 44,916. APL Yang Ming. 30,900 CGM 29,549 UASC. 33,375 Hanjin/KSC 30,193 ScanDutch. 38,788 CGM 34,937 NOL. 43,137 Nedlloyd 37,284 BSC. 40,335 36,760. NOL. 27,346 Hanjin. 26,374 BSC. 32,318 CMB. 30,832 NOL. 35,294. CMB ACT. 22,337 DSR 18,553 Hyundai. 25,997 Nedlloyd 21,826 NOL. 29,995 Hyundai 26,689 MSC. 25,691 ScanDutch 24,831 SNCDV. 32,948 31,204. Baber Blue Sea. 17,862 NOL. 21,218 Blasco. 26,188 Hamburg Sud. 20,406 CGM. 29,040. Top 20 Total. 910,894 Top 20 Total. 873,042 Top 20 Total. 1,044,604 Top 20 Total. 1,210,858 Top 20 Total. 1,173,413. World Total Top 20 Share. 2,571,000 World Total 35.4% Top 20 Share. 2,723,238 World Total 32.1% Top 20 Share. 2,787,900 World Total 37.5% Top 20 Share. 3,021,289 World Total 40.1% Top 20 Share. 3,168,294 39.0%. Source: compiled from CI. Evergreen was always the first rank in the list from 1986 to 1990, with an average capacity growth of 9%. The highest growth rate of Evergreen was 23% in 1986 (111,594 TEU in service) and it became the biggest and youngest one of the. 29.
(43) independent giants. By late 1986 OCL, ranked in 6th position (1985), was taken over by P&O and named P&OCL (see table 6).. The 20% growth in capacity of the top 20 liners was recorded at the end of 1988 (table 7). Sealand deployed a huge capacity, increased by 38% from 73,602 TEU in 1987 to 101,906 TEU in 1988 and overcame Maersk to the second position in the top 20. The Japanese liner MOL also increased by 32% of its capacity. However, the most impressive increase was NYK, nearly 57%, to 69,882 TEU in 1988 from 44,398 TEU in 1987. The time of the bigger ship had come as the study of CI showed that ‘‘approximately 46% of the slot in operation or ordered by the world’s 20 largest carries were on vessels of 2,500 TEU or over’’(‘Period of transition’, 1989, p.8). The first ultra- panamax containership APL C-10s, 4,300 TEU was introduced in the market in 1988 and even those vessels could carry more if six tiers were loaded on deck. Going further, the big lines Maersk Line deployed nine 3,900 TEU vessels (it could be 5000 TEU if the containers were stacked on desk). All other carriers pursued that way and ‘‘the search for economic of scale with large vessels shows no signs of ending’’ as this CI study concluded (‘Period of transition’, 1989, p.8). The huge tonnage put in service during 1987 and 1988 had caused a great imbalance between demand and supply. Major liners had increased their capacity at a faster rate than the growth rate of trade. In the following years, they suffered much from these impacts. The vessel ‘s utilization of most carriers was very low (on the east west trades, except APL and Sealand who got the advantage of carrying US military cargoes) and the imbalance of trade created more sinking costs for empty container repositioning.. Some years before liners believed that a higher market share with cheaper rates could bring more profits than that of the lower market share with higher rates and they could make profits up on the volume carried. This strategy together with the overtonnage situation made the market collapsed and ‘‘they just destroy the prices. They are not even covering the out of pocket costs’’ (Drewry 1991, p.73). Freight dropped. 30.
(44) and the question of profitability in container shipping was put on the table for discussion. Coming to 1990, the top 20 fleet capacity was reduced by 3% (table7) Table 7: The development of world fleet capacity, world container traffic 1986-1990 Year. World fleet (‘000 TEU). 1986 1987 1988 1989 1990. 2,571 2,543 2,788 3,021 3,168. World cellular fleet (‘000 TEU). Top 20 fleet (‘000 TEU). 133 141 151 162 146. World container traffic (‘000 TEU). 910 873 1,044 1,210 1,173. 60,900 67,300 73,800 78,500 85,600. Source: combined from various issues of CI, Drewry. Liners were forced to seek increasing utilization and profit. The ways out could be: the global network, cost effective control, information system, value added services, inter-modal services, large/efficient tonnage and corporation among them Participating consortia, joint service and slot charters could obtain the weekly regular services, economies of scale and market coverage. Major carriers in the top 20 had joined some forms of co-operation. Maersk Line, the most independently minded operator, joined service agreement: with P&OCL in the Europe- Far East Trade; with P&OCL and Sealand for Europe- WCNA service and with Sealand in the Transpacific trade. Even Evergreen had seen the benefit of chartering capacity in 1989. However at the end of 1990, they were still ‘‘only one which did not appear to be turning away from a consistently isolationist approach’’ (Phillips.F, 1991 p.5). We can recognise the strong development and ambition of US carrier Sealand during this time by inaugurating more tonnages and implementing a highly centralized computer system. Sealand had invested heavily in capital for a computer system network, software, and provided EDI links with its customers and used it as a management tool (‘‘Distribution revolution’’, 1988, p.6). However, not all the liner in top 20 were able or agreed to invest in that.. Recognizing the business opportunities and the business trend of ‘‘total distribution services’’, in 1988, some of the top 20 liners continued to expand ‘‘total distribution. 31.
(45) services’’ like: APL, Sealand, Maersk lines, P&O, Hapag Lloyd, ACL, ScanDutch and they had well–established distribution services (‘’Distribution revolution’’, 1988, p.6). Entering to 1991, liners were in a bad mood about the uncertainties and changes with the threat of the Iraq war and its impact on the world’s economy.. 3.1.3: The period 1991-1995. During this period, the total world capacity, traffic and the top 20 capacity continued to increase (table 9). From 1990 to 1991, the world container traffic continued to grow at the rate of 9.3%, the total world fleet grew by 7%, while the top 20 capacity increased by nearly 16% (table 9). Cosco increased its fleet with the surprising rate of 64% from 54,505 TEU to 89,600 TEU, primarily through acquisitions on the second hand market and held 5th rank. This time P&O grew by 52%. The third fastest growth rate was 37% of NYK when it added its newly acquired Japanese shipping lines TSK line (see table 8). That year marked the disappearance of ScanDutch, the return of DSR and the first time appearance of French carrier CMA. Table 8: The development of ranking and capacity of the top 20 from 1991-1995 SEPTEMBER 1991 Carrier Evergreen/Uniglory Sealand Service NYK Line/TSK Line Maersk Line Cosco MOL P&O (OCL) APL K Line Nedlloyd Hanjin Zim Hapag-Lloyd OOCL Yangming CGM NOL Baltic CMA DSR Top 20 Total World Total Top 20 Share. SEPTEMBER 1992. TEU Carrier 132,386 Sealand 118,376 Evergreen 109,540 Maersk 102,260 NYK 89,600 MOL 88,600 Nedlloyd 82,613 OOCL 65,638 ZIM 64,360 APL 64,200 K Line 62,615 Hanjin 60,166 P&O 58,600 Cosco 53,218 Hapag Lloyd 52,005 Yang Minh 39,615 CGM 37,613 UASC 37,000 Baltic 29,600 NOL 23,200 Scac Delmas. TEU 136,729 132,386 117,194 110,198 95,764 78,781 67,536 66,010 65,638 65,589 65,458 63,470 60,526 60,281 59,644 42,133 41,062 39,540 39,188 36,655. SEPTEMBER 1993 Carrier Maersk Line Sealand Evergreen/Uniglory NYK Line/TSK Line MOL P&O K Line Hanjin Nedlloyd Zim APL Hapag-Lloyd NOL Cosco Yangming OOCL UASC MSC Hyundai DSR. TEU 174,088 147,765 144,140 122,130 91,015 80,984 80,168 77,398 75,938 71,397 69,527 63,222 59,208 58,576 56,330 53,074 50,371 43,991 40,359 37,388. SEPTEMBER 1994 Carrier Maersk Line Evergreen/Uniglory Sea-land Cosco NYK Line/TSK line P&O MOL DSR-Senator Lines Hanjin Nedlloyd Lines K Line Zim APL MSC Hapag-Lloyd NOL Yangming OOCL Hyundai CMA. TEU 185,805 160,108 153,658 146,068 123,930 99,977 88,238 85,843 85,466 84,651 80,375 70,675 69,985 67,649 63,939 59,416 57,534 55,596 55,031 43,611. SEPTEMBER 1995 Carrier Sealand Maersk Line Evergreen/Uniglory Cosco NYK Line/TSK Nedlloyd MOL P&O Hanjin MSC APL Zim Israel Navigation K Line DSR-Senator Linie Hapag-Lloyd NOL Yangming Hyundai OOCL CMA. TEU 196,708 186,040 181,982 169,795 137,018 119,599 118,208 98,893 92,332 88,955 81,547 79,738 75,528 75,497 71,688 63,469 60,034 59,195 55,811 37,388. 1,370,205 Top 20 Total 1,443,782 Top 20 Total 1,597,069 Top 20 Total 1,837,555 Top 20 Total 2,049,425 3,400,000 World Total 3,610,451 World Total 3,700,000 World Total 4,100,000 World Total 4,410,000 40.3% Top 20 Share 40% Top 20 Share 43.2% Top 20 Share 44.8% Top 20 Share 46.5% Note: Cosco capacity included all the liner operating units of COSCO: Dalian Ocean Shipping co, Ghangzhou Ocean Shipping Co, Shang Hai Ocean Shipping Co and Tienjin Ocean Shipping Co. Source: compiled from CI. 32.
(46) In 1992, the world economy was still in recession, the lower economic growths gave container shipping in the hard time and put more pressure on liners to controll costs and rationalize their operations. However, due to the purpose of securing the economies of scale and operating efficiencies, the top 20 still placed more orders for new ships. In July 1992, the top 20 ‘‘accounted for nearly 50% of the total world order for containerships’’ (Boyes.J, 1993, p.5). Table 9: The development of world fleet capacity and world container traffic 19911995 Year World fleet World cellular fleet Top 20 fleet World container traffic (‘000 TEU) (‘000 TEU) (‘000 TEU) (‘000 TEU) 1991 3,400 1,979 1,370 93,600 1992 3,610 2,098 1,443 102,900 1993 3,700 2,217 1,597 113,200 1994 4,100 2,531 1,837 128,300 1995 4,410 2,761 2,049 137,200 Source: combined from various issues of CI and Drewry. In 1992, there was a little change in the structure of the league: CMA, DSR were out and gave way to UASC, Scan-Delmas. Sealand regained its position as the world’s largest liner from Evergreen by increasing by 18% its capacity. Cosco fell from 5th rank to 13th, the main reason being scraping of old tonnage. The top 20 operated the bigger container ships. In 1992, the total capacity of the top 20 liners, (ship was larger than 3000 TEU) occupied nearly 30% (399,316 TEU) of the total capacity deployed (1,443,782 TEU). They held 97.4% of all 3,500 TEU plus vessels deployed in the global services. (Damas.P ,December 1992, cover story).. Maersk lines boosted its fleet by taking over EAC Ben in April 1993 and went above Evergreen and Sealand to 1st place with a capacity increase of 49%. By deploying more than 27% of its fleet capacity in 1992 (63,470 TEU), P&O quickly held 6th rank and became the second largest European liner after Maersk Lines. Hanjin, the only Korean carrier in the top 20, jumped from 11th to 8th position by increasing its capacity by 18.2%. The first time appearance, MSC entered the league in position 18. Its capacity was mainly acquired from the second hand market with a shipload of less. 33.
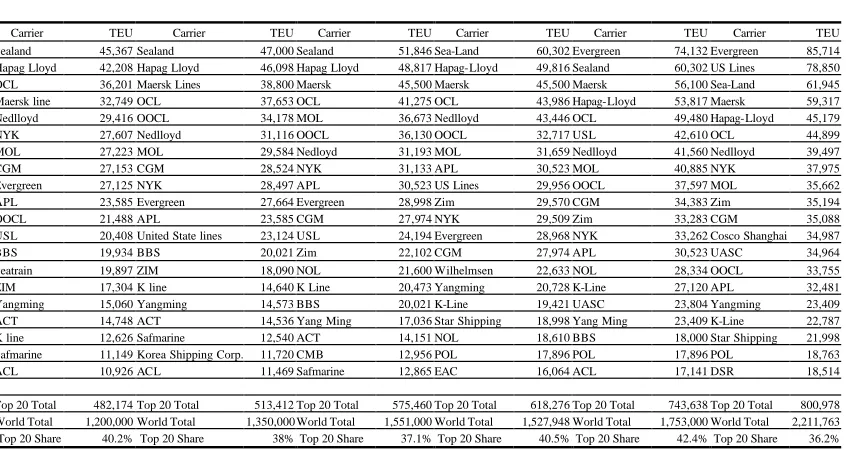
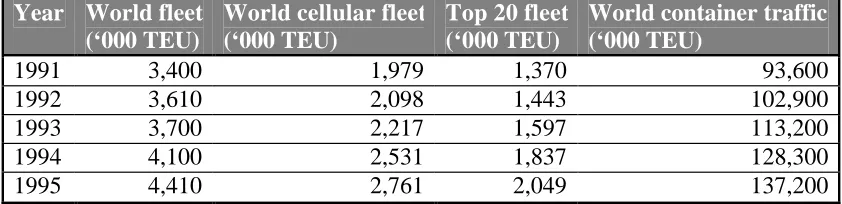
(47) than 1,500 TEU. The Chinese carrier- Cosco seemed to have a slow growth in those years, even the capacity was reduced from 60,526 TEU (1992) to 58,576 TEU (1993). APL dropped from 6th position to 9th position in 1993 (table 8).. Most trades were containerised and the world container traffic continued to grow rapidly with a rate of 13.3% from 113,2 million TEU in 1993 to 128.3 million TEU in 1994. The world fleet and top 20 capacity also increased by 11% and 15% respectively (table 9). Cosco, the China State-owned container line seemed to have deep pockets as they took deliveries of more than a dozen 2,500/ 3,800 TEU during 1993-1994 and acquired more tonnage from the second hand market (Fossey. J, 1995, p.11). Cosco’s capacity was jumped to 146,066 TEU from 58,576 TEU in 1993, nearly by 149%. It kept 4th position after Maersk, Evergreen, Sealand and put NYK behind. An Asian carrier, Huyndai, entered in the league in 1993 at 19th position but showed strong ambition to be a mega-carrier with a capacity increase of 36%. With the merging of Senator and DSR, the new entity DSR-Senator comprised 85,843 TEU capacity in service and was ranked as 8th position. MSC, the Swiss based liner, had self-affirmed its position in the list by deploying more 23,658 TEU and increased by nearly 54% and was in 14th position. In 1995, the top 20 list changed in structure only, all the league’s members still remained from the 1994 list. Liners had increased their capacity. Indeed, in order to be in that list, a liner had to have nearly half of a million TEU capacity in service. Sealand added more vessels and came back in the leader position. Nedlloyd and MSC increased capacity by 41% and 31% respectively and moved up to the higher ranks. 11.5 % and 7.6 % were the growth rates of the top 20 and world fleet capacity while the world container traffic went up by 6.9% only (table 8). This means the supply and demand was still imbalanced and most liners had to seek new strategies or cooperation in the next period.. 34.
(48) 3.1.4 The period 1996-2001. As a result of the increase in world trade and the penetration of containerisation into the bulk cargo market, the world container traffic continued to rise with an average rate of 9.6% from 1996 to 2001 (table 10). The world container fleet and the top 20 fleet capacity also increased on average by 8.7% and 13% respectively during this period. Table 10: The development of world fleet capacity and world container traffic 1996-2001 Year World fleet World cellular fleet Top 20 fleet World container traffic (‘000 TEU) (‘000 TEU) (‘000 TEU) (‘000 TEU) 1996 4,800 3,718 2,297 147,300 1997 5,270 3,563 2,618 163,700 1998 5,874 4,159 3,113 169,600 1999 6,021 4,237 3,345 203,200 2000 6,536 4,716 3,524 225,200 2001 7,270 5,353 4,245 236,500 Source: compiled from CI, Drewry. In 1995-1996, being forced to adapt to the changing business environment, a carrier had to cooperate together through their newly established global alliances: Global alliance (APL, MOL, OOCL, Nedlloyd, MISC), Grand alliance (Hapag Lloyd, NOL, NYK,P&O), United alliance (Cho-Yang, Hanjin, DSR-Senator), Maersk- Sealand. By doing so, ‘’a massive concentration of power was in the hands of a few carriers’’ (Boyes, J.R.C, 1996, p.V). While most of the lines in the top 20 looked for cooperation, even Evergreen had seen some benefits of cooperation, Cosco still operated in ‘‘total isolation’’ (Boyes, J.R.C, 1996, p. V).. By bringing an additional 23,242 TEU into service, Evergreen became the leader of the list. Sealand increased its capacity slightly and accepted the second position. Hyundai continued to deploy more capacity, climbing 7 ranks to 11th position and it ‘‘has made no secret of its intention of becoming a top 10 carrier by the year 2000’’ (Fossey, J, November 1996, p.42). MSC went over the traditional container liners:. 35.
Figure

+7
Related documents
In the present investigation, an attempt were made to improve the solubility and dissolution rate of a poorly soluble drug, Nateglinide by solid dispersion method using Urea,
The main objective of this paper is to test the ability of different Fusarium isolates to produce indole-3-acetic acid on glucose medium, secondly to improve IAA production
The current study was conducted to investi- gate the adverse effects of daily administration of different pain killers like Diclofenac sodium (Diclo), Ibuprofen (Ibu)
.The known causative molecules underlying ichthyosis include ABCA12, lipoxygenase-3, 12R-lipoxygenase, CYP4F22, ichthyin and stero- id sulfatase, all of which are thought to
A comparison made on level of heterozygosity for all the four loci studied, indicated variation between the two populations giving an idea that the two populations
stratum as a result of the intervention of the growth arrest were compelled to spread out under and through it. After all, if the capillaries and osteoblasts can get to the Muller
enterocolitica strains from children in Poland belonging to biotype 4 and 2 had all investigated virulence genes, including the plasmid gene yadA, except the two
The Sharing- technique is not enough to distinguish the cache hit ratio despite the popularity of different class of content so that it is required differentiation techniques
