R E S E A R C H
Open Access
A label-free differential quantitative mass
spectrometry method for the characterization
and identification of protein changes during
citrus fruit development
Ehud Katz
1, Mario Fon
1, Richard A Eigenheer
2, Brett S Phinney
2, Joseph N Fass
3, Dawei Lin
3, Avi Sadka
4,
Eduardo Blumwald
1*Abstract
Background:Citrus is one of the most important and widely grown commodity fruit crops. In this study a label-free LC-MS/MS based shot-gun proteomics approach was taken to explore three main stages of citrus fruit development. These approaches were used to identify and evaluate changes occurring in juice sac cells in various metabolic pathways affecting citrus fruit development and quality.
Results:Protein changes in citrus juice sac cells were identified and quantified using label-free shotgun methodologies. Two alternative methods, differential mass-spectrometry (dMS) and spectral counting (SC) were used to analyze protein changes occurring during earlier and late stages of fruit development. Both methods were compared in order to develop a proteomics workflow that could be used in a non-model plant lacking a
sequenced genome. In order to resolve the bioinformatics limitations of EST databases from species that lack a full sequenced genome, we established iCitrus. iCitrus is a comprehensive sequence database created by merging three major sources of sequences (HarvEST:citrus, NCBI/citrus/unigenes, NCBI/citrus/proteins) and improving the annotation of existing unigenes. iCitrus provided a useful bioinformatics tool for the high-throughput identification of citrus proteins. We have identified approximately 1500 citrus proteins expressed in fruit juice sac cells and quantified the changes of their expression during fruit development. Our results showed that both dMS and SC provided significant information on protein changes, with dMS providing a higher accuracy.
Conclusion:Our data supports the notion of the complementary use of dMS and SC for label-free comparative proteomics, broadening the identification spectrum and strengthening the identification of trends in protein expression changes during the particular processes being compared.
Background
Fruit ripening and development has being studied using transcriptomic, proteomics, and metabolomics approaches [1-8]. Quantitative proteomics provides an alternative approach for studies of fruit development. In the last few years, quantitative proteomics has been widely applied for the quantification of complex biological samples [9-11]. The most commonly used approach for comparative proteomic analysis of plant tissues is the application of
2DE-gels. This method is limited in sensitivity, has a low dynamic range, it is inefficient when analyzing insoluble proteins or proteins with very high or low molecular mass and are limited in their reproducibility [12], although reproducibility has been improved with the use of differen-tial imaging gel electrophoresis (DIGE) [13,14]. Alternative techniques to 2DE-gels are non-gel LC-MS/MS-based shotgun proteomics [15-18], where quantification is per-formed using the mass-spectrometer data. Some success for the quantification of proteins has been achieved by using stable isotope labeling,15N,13C,2H and SILAC [19], ICAT [20,21], iTRAQ [22] and18O stable isotope incor-poration [23]. One of the main limitations of these * Correspondence: [email protected]
1Department of Plant Sciences, University of California, Davis, CA, 95616, USA Full list of author information is available at the end of the article
Katzet al.Proteome Science2010,8:68 http://www.proteomesci.com/content/8/1/68
methods is that full labeling of the proteins is rarely achieved and that different peptides incorporate the label at different rates which complicates data analysis. Recently, a label-free method for comparative proteomic analysis has emerged [9-11,24].
Label-free proteomics allows for the quantification of peptides using spectral characteristics such as retention time, m/z ratio and peak intensity by comparing the direct mass spectrometric signal intensity for any given peptide (differential Mass Spectrometry, dMS) or by counting the number of acquired tandem mass spectra matching to a specific peptide as an indicator for their abundance in a given sample (spectral counting, SC) [25,26]. dMS is based on comparisons of chromato-graphic peaks of peptide precursor ion measurements belonging to a specific protein extracted from an LC-MS/MS run [27-32]. This approach is based on the observation that dMS in most cases is proportional to the concentration of the peptide in the sample investi-gated [10,27-29]. Peak intensity for every individual spectrum is determined and the comparison of spectra between multiple LC-MS runs provides quantitative measurement of thousands of peptides. From this mas-sive data a selected list of differential peptides can be produced for subsequent fragmentation by LC-MS/MS for sequence determination and protein identification. In order to match the massive spectra data according to retention time and precursor m/z characteristics various software have been developed. Once matched, expres-sion ratio in peak intensity is calculated according to peak areas corresponding to the matched peptides. SC counting is based on counting and comparing the num-ber of spectra identifying specific peptides of a given protein to assess relative protein abundance, also found to be in good correlation with protein abundance [15,30].
Proteomics has been used successfully to characterize and identify changes in plant protein compositions dur-ing different developmental stages [3,5,33,34], and pro-teomic comparative analysis of citrus fruits, mainly using 2DE-gels, have been published recently [35-38].
Label-free comparative proteomics is a relatively new approach that has been used successfully in different systems (humans, yeast, fly, etc.) [39-42], but its applica-tion in plants is scanty [26,43]. Using LC-MS/MS we recently analyzed soluble and enriced membrane frac-tions of mature citrus fruit to identity the proteome of fruit juice cells and classified these proteins according to their putative function according to known biosynthetic pathways [18]. Here, we describe a method for the use of label-free LC-MS/MS-based shotgun differential pro-teomics for the study of fruit development in Citrus, a non-model plant lacking a fully sequenced genome. The method combines the use of dMS and SC and the
creation of iCitrus, a citrus fruit-specific database and interface, for the identification of the protein changes occurring during the development of citrus fruits.
Results
Citrus proteins annotations using iCitrus
Although the citrus genome has not been fully sequenced yet, a comprehensive citrus EST database has been devel-oped in the past few years [44]. Several groups have con-tributed to EST sequencing efforts using different species, includingC. sinensis(sweet orange),C. clemen-tina (Clementine mandarin),C. paradisi(grapefruit), Poncirus trifoliata, and other hybrids (C. sinensis × Pon-cirus trifoliata, Carrizo citrange). A wide range of libraries derived from multiple reproductive and vegeta-tive tissues at different developmental stages were used in addition to different treatments or stresses to create a relatively large database. To date, there are 582,334 citrus sequences in the National Center for Biotechnology Information (NCBI) EST database. With the advantage of comprehensive sequence dataset in hand, there were many challenges to be addressed before using the data-bases for proteomic research. Some of these challenges arose from the nature of EST databases, over-representa-tion of highly-expressed genes (and the underrepresenta-tion of weakly-expressed genes), redundancy, incomplete sequences, poor annotation etc. The challenge of using the EST database for proteomics came from the fact that a highly redundant database with many similar sequences would artificially decrease the significance of potential
proteins of interest. In a few cases where the accessions shared a high similarity, the redundancy resulted in the identification of two or more ESTs with only one peptide. If these ESTs belong to the same unigene, then two or more peptides could identify the same specific protein.
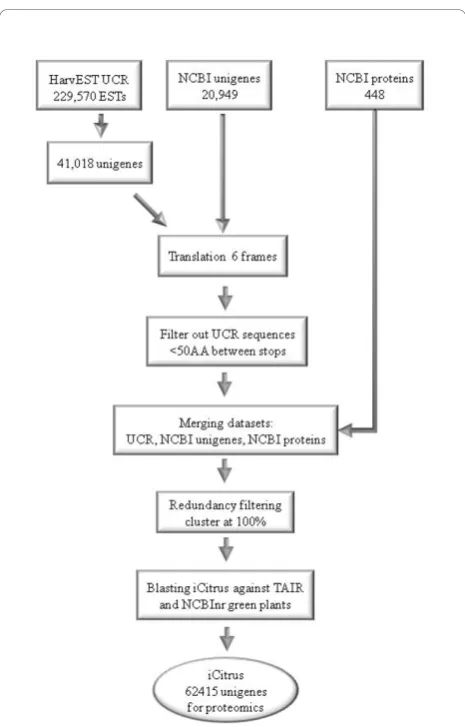
To date, there are 62,415 sequences in the iCitrus collected database; 41,018 from the HarvEST:Citrus assembly http://harvest.ucr.edu/, 20,949 from NCBI’s unigenes (C. sinensisand C. clementina), and 448 from NCBI’s proteins (C. sinensis and C.clementina) (Figure
1). iCitrus dataset in a FASTA file format and a description of the iCitrus interface structure can be found as Additional File 1 and a conversion table of HarvEST:Citrus, NCBI/Citrus/ESTs and NCBI/Citrus/ Proteins accessions into iCitrus accessions can be found in Additional File 2: Table S1.
Label-free LC-MS/MS based shotgun proteomics, differential Mass-Spec and Spectral Counting
To achieve a better identification of differentially expressed proteins during fruit development and to decrease sample complexity, the juice sac cells were fractionated into soluble and membrane-bound proteins (Figure 2). Two alternative strategies for label-free mass spectrometric analysis; peptide ion intensities measure-ments and spectral counting were used. The peptide ion intensities measurements, also referred as differential Mass Spec (dMS), integrate the peak area which is pro-portional to the concentration of the peptide in the sample (Additional File 3: Figure S1). Determining the area for each mass extracted peptide ion chromatogram
Figure 1iCitrus database. Three major sources were used in creating iCitrus dataset: UC Riverside HarvEST:citrus (C46 assembly), NCBI/citrus/unigenes and NCBI/citrus/proteins (see text). The first two datasets were translated into all 6 reading frames, split at stop codons, and sequences shorter than 50 amino acids were removed. These were combined with the NCBI protein sequences, and all three protein sequence sets were then clustered at 100% identity using CD-HIT http://bioinformatics.ljcrf.edu/cd-hi/, meaning that sequences that aligned with 100% identity to a longer sequence in the combined set were removed. All remaining sequences were then blasted to TAIR proteins, and separately to the subset of NCBI’s nr database belonging to taxa withinViridiplantae, to collect GO-term and descriptive annotation for the clustered sequences.
Figure 2 Experimental design. Soluble and membrane-bound proteins were extracted from juice sac cells from at least 20 fruits at three stages of Citrus fruit development (early Stage II, Stage II and Stage III) and pooled at each stage. Five technical repeats of each pooled sample (oldervsyounger fruit) were each analyzed by SIEVE using blanks (washes) between each sample run. Comparisons were conducted in pairs in the following: Stage II vs. early Stage II and stage III vs. Stage II. Methods as described in Experimental Procedures.
Katzet al.Proteome Science2010,8:68 http://www.proteomesci.com/content/8/1/68
retention time pair and comparing the areas between multiple LC-MS runs of different samples can provide a comprehensive quantification of thousands of peptides within samples. The alternative strategy, Spectral Count-ing (SC), calculates the number of MS/MS scans that are attributed to the same peptide ion. The frequency of these MS/MS scans correlates with the abundance of a given peptide in the sample. In this study we have used dMS strategy to analyze and identify differential proteins changes during fruit development in citrus juice sac cells (Figure 2) and SC as an alternative strategy to validate our finding. Identification of proteins was done by MS spectra search against the iCitrus database and annota-tions by using the iCitrus interface.
Label-free relative quantitative analysis detects, selects and compares spectra that are significantly different between samples (either by dMS or SC). However, many of the spectra that were selected as being different in their intensity or abundance were found to be not statis-tically different between the developmental stages com-pared and will be discussed later.
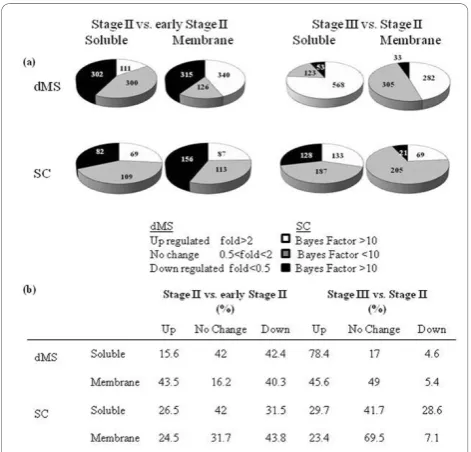
Using dMS, 1494 and 1364 proteins were identified by at least two peptides in the comparisons between Stage II (55 mm fruit diameter) versus early Stage II (35 mm fruit diameter) and Stage III (80 mm fruit diameter) versus Stage II, respectively (Figure 3). A high number of identified proteins were down- and up-regulated dur-ing the earlier and later stages of development, respec-tively (Figure 3a).
Accessions identified by SC and dMS were compared using both iCitrus and Arabidopsis homologs (Figure 4).
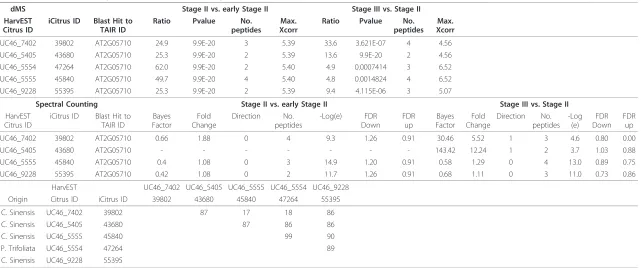
These comparisons were made to minimize possible redundancies of identified citrus ESTs and to conserved citrus protein accessions that might originate from dif-ferent unigenes but belonging to the same gene family. Once again, aconitase can provide a good example for database redundancy as the accessions 45840 and 47264, sharing 99% amino acid similarity, are essentially the same unigene originating from two different citrus spe-cies (Table 1). These accessions shared little similarity with 39802 and sequence alignment showed that their sequences did not overlap but shared high homology with the other members, i.e. 55395 and 43680. Notably, some proteins did not share homology to any Arabidop-sis proteins, providing support to the use of citrus acces-sions for comparisons. In some cases, these accesacces-sions could be assembled to one contig while in other cases these ESTs could not be assembled. Two possibilities arose, either these EST sequences originated from the same gene but did not overlap, therefore could not be assembled, or these ESTs were originated from different genes belonging to the same family.
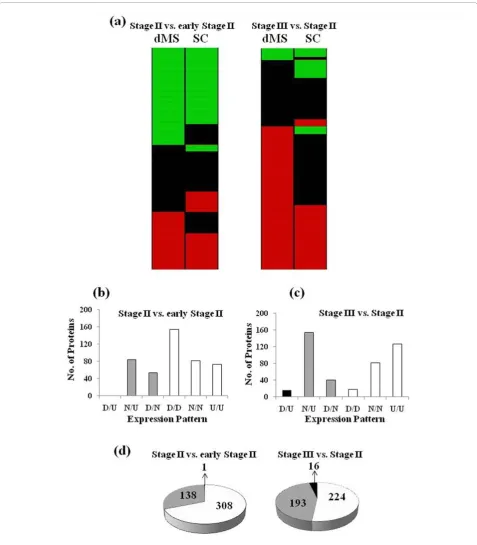
Most of the proteins identified by both dMS and SC also showed similar expression patterns (Figure 5). Out of 452 proteins identified by both methods in the com-parison between fruits at Stage II versus fruits at early Stage II, 308 proteins (69%) had the same expression pattern therefore referred as“matching”(Figure 5a). In the comparison between fruits at Stage III versus Stage II 51% of the shared proteins displayed similar expres-sion pattern and the rest fell under the“weak matching” category (Figure 5a).“Weak matching”refers to proteins showing significant expression changes with one method Figure 3Numbers of protein identified by dMS and SC.
Table 1 Identification and quantification of aconitase by dMS and SC.
dMS Stage II vs. early Stage II Stage III vs. Stage II HarvEST
Citrus ID
iCitrus ID Blast Hit to TAIR ID
Ratio Pvalue No. peptides
Max. Xcorr
Ratio Pvalue No. peptides
Max. Xcorr
UC46_7402 39802 AT2G05710 24.9 9.9E-20 3 5.39 33.6 3.621E-07 4 4.56
UC46_5405 43680 AT2G05710 25.3 9.9E-20 2 5.39 13.6 9.9E-20 2 4.56
UC46_5554 47264 AT2G05710 62.0 9.9E-20 2 5.40 4.9 0.0007414 3 6.52
UC46_5555 45840 AT2G05710 49.7 9.9E-20 4 5.40 4.8 0.0014824 4 6.52
UC46_9228 55395 AT2G05710 25.3 9.9E-20 2 5.39 9.4 4.115E-06 3 5.07
Spectral Counting Stage II vs. early Stage II Stage III vs. Stage II
HarvEST Citrus ID
iCitrus ID Blast Hit to TAIR ID
Bayes Factor
Fold Change
Direction No. peptides
-Log(e) FDR Down
FDR up
Bayes Factor
Fold Change
Direction No. peptides
-Log (e)
FDR Down
FDR up
UC46_7402 39802 AT2G05710 0.66 1.88 0 4 9.3 1.26 0.91 30.46 5.52 1 3 4.6 0.80 0.00
UC46_5405 43680 AT2G05710 - - - 143.42 12.24 1 2 3.7 1.03 0.88
UC46_5555 45840 AT2G05710 0.4 1.08 0 3 14.9 1.20 0.91 0.58 1.29 0 4 13.0 0.89 0.75
UC46_9228 55395 AT2G05710 0.42 1.08 0 2 11.7 1.26 0.91 0.68 1.11 0 3 11.0 0.73 0.86
HarvEST UC46_7402 UC46_5405 UC46_5555 UC46_5554 UC46_9228 Origin Citrus ID iCitrus ID 39802 43680 45840 47264 55395
C. Sinensis UC46_7402 39802 87 17 18 86
C. Sinensis UC46_5405 43680 87 86 86
C. Sinensis UC46_5555 45840 99 90
P. Trifoliata UC46_5554 47264 89
C. Sinensis UC46_9228 55395
All iCitrus accessions for aconitase that were identified by both methods were homolog to the Arabidopsis gene At2g05710. Identification of aconitase by dMS and SC. The column“direction”under SC represents up-regulated = 1, no change = 0, down-regulated = -1. Aconitase iCitrus accessions amino acids sequences similarities.
Katz
et
al
.
Proteome
Science
2010,
8
:68
http://ww
w.proteomesci
.com/cont
ent/8/1/68
Page
5
o
f
1
while showed no significant expression differences when analyzed with the other method (Figure 5b-d). Only few proteins, 1 and 16, showed contradicting expression pat-terns in the comparisons between Stage II versus early Stage II and between Stage III and Stage II, respectively. The high percentage of proteins shared by dMS and SC that show the same expression pattern serves also as a strong validation for protein expression.
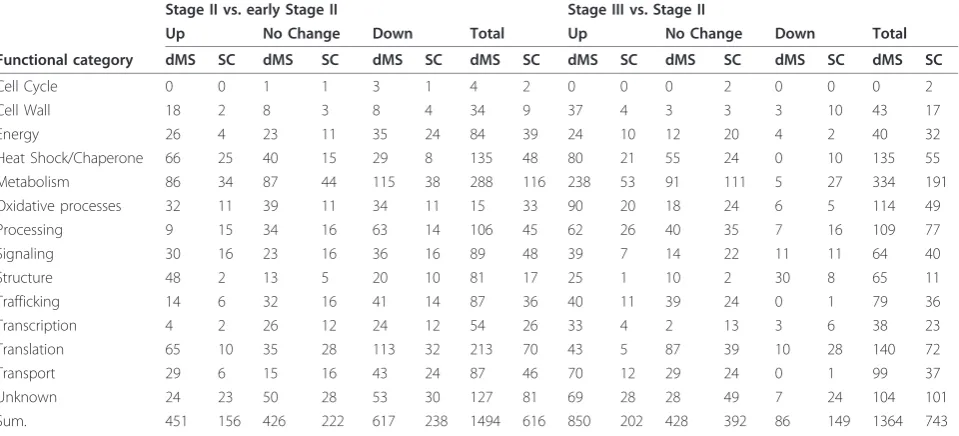
Changes in protein expression during fruit development Label-free LC-MS/MS analysis of juice sac cells indi-cated significant changes in protein synthesis during fruit development (Table 2). Changes in the expression of 1834 and 1004 iCitrus accessions during fruit devel-opment were identified by dMS and SC, respectively. These numbers consisted of accessions identified by the four types of comparisons conducted (Stage II vs. early Stage II, Stage III vs. Stage II, membrane-bound proteins and soluble), and proteins appearing at more than one stage of development were only counted once. In most cases, the discrepancies between the two methods were due to differences on the bioinformatics associated with dMS and SC workflows (see Discussion).
A significant number of proteins (772 and 560) were identified and classified as “not changed” by dMS and SC, respectively (Table 2). Although these proteins were found to match differentially expressed peptides, did not pass the statistical threshold. Although not differentially expressed, the identification of these proteins provides valuable information because: (i) they are proteins that
are active during fruit development; (ii) they strengthen the confidence in the identification of the same peptides in other comparisons [39]. Here, we have classified the fruit proteins into 14 major functional groups (Table 2). In general, the expression of a large number of proteins identified decreased during the transition from early Stage II to Stage II of development (617 were down-regulated and 451 were up-down-regulated). This trend reversed during the transition from Stage II to Stage III where 850 proteins were up-regulated and 86 were down-regulated (Table 2). Most of the up-regulated pro-teins belonged to Metabolism, Processing, Oxidative processes, Trafficking, Transcription and Transport.
Changes in protein associated with vesicular trafficking during fruit development
In order to illustrate similarities and disparities between dMS and SC for the quantitation of protein changes during fruit development, we analyzed changes in pro-teins associated with vesicular trafficking and protein movements. The global changes in protein profiles and the metabolic processes associated with the quantitative protein changes during fruit development will be pre-sented and discussed elsewhere (Katz et al., in preparation).
In this study, many small G-proteins and other teins associated with a large number of cellular pro-cesses such as vesicle formation; vesicular traffic and docking, etc. [45-47] were found to be differentially expressed during fruit development (Tables 2, 3).
Table 2 Functional classification of proteins identified by dMS and SC workflows (see Experimental Procedures) after search of the iCitrus database.
Stage II vs. early Stage II Stage III vs. Stage II
Up No Change Down Total Up No Change Down Total Functional category dMS SC dMS SC dMS SC dMS SC dMS SC dMS SC dMS SC dMS SC
Cell Cycle 0 0 1 1 3 1 4 2 0 0 0 2 0 0 0 2
Cell Wall 18 2 8 3 8 4 34 9 37 4 3 3 3 10 43 17
Energy 26 4 23 11 35 24 84 39 24 10 12 20 4 2 40 32
Heat Shock/Chaperone 66 25 40 15 29 8 135 48 80 21 55 24 0 10 135 55
Metabolism 86 34 87 44 115 38 288 116 238 53 91 111 5 27 334 191
Oxidative processes 32 11 39 11 34 11 15 33 90 20 18 24 6 5 114 49
Processing 9 15 34 16 63 14 106 45 62 26 40 35 7 16 109 77
Signaling 30 16 23 16 36 16 89 48 39 7 14 22 11 11 64 40
Structure 48 2 13 5 20 10 81 17 25 1 10 2 30 8 65 11
Trafficking 14 6 32 16 41 14 87 36 40 11 39 24 0 1 79 36
Transcription 4 2 26 12 24 12 54 26 33 4 2 13 3 6 38 23
Translation 65 10 35 28 113 32 213 70 43 5 87 39 10 28 140 72
Transport 29 6 15 16 43 24 87 46 70 12 29 24 0 1 99 37
Unknown 24 23 50 28 53 30 127 81 69 28 28 49 7 24 104 101
Sum. 451 156 426 222 617 238 1494 616 850 202 428 392 86 149 1364 743
Proteins were classified into 14 major groups and are represented according to fruit development stages comparisons according to the method used (dMS and SC).
Katzet al.Proteome Science2010,8:68 http://www.proteomesci.com/content/8/1/68
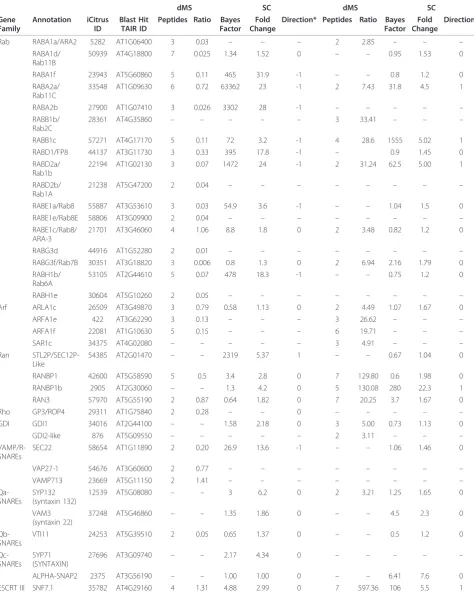
Table 3 Vesicular trafficking-related proteins identified by dMS and SC.
Stage II (55 mm) vs. early stage II (35 mm) Stage III (80 mm) vs. Stage II (55 mm)
dMS SC dMS SC
Gene Family
Annotation iCitrus ID
Blast Hit TAIR ID
Peptides Ratio Bayes Factor
Fold Change
Direction* Peptides Ratio Bayes Factor
Fold Change
Direction*
Rab RABA1a/ARA2 5282 AT1G06400 3 0.03 – – – 2 2.85 – – –
RABA1d/ Rab11B
50939 AT4G18800 7 0.025 1.34 1.52 0 – – 0.95 1.53 0
RABA1f 23943 AT5G60860 5 0.11 465 31.9 -1 – – 0.8 1.2 0
RABA2a/ Rab11C
33548 AT1G09630 6 0.72 63362 23 -1 2 7.43 31.8 4.5 1
RABA2b 27900 AT1G07410 3 0.026 3302 28 -1 – – – – –
RABB1b/ Rab2C
28361 AT4G35860 – – – – – 3 33.41 – – –
RABB1c 57271 AT4G17170 5 0.11 72 3.2 -1 4 28.6 1555 5.02 1
RABD1/FP8 44137 AT3G11730 3 0.33 395 17.8 -1 – 0.9 1.45 0
RABD2a/ Rab1b
22194 AT1G02130 3 0.07 1472 24 -1 2 31.24 62.5 5.00 1
RABD2b/ Rab1A
21238 AT5G47200 2 0.04 – – – – – – – –
RABE1a/Rab8 55887 AT3G53610 3 0.03 54.9 3.6 -1 – – 1.04 1.5 0
RABE1e/Rab8E 58806 AT3G09900 2 0.04 – – – – – – – –
RABE1c/Rab8/ ARA-3
21701 AT3G46060 4 1.06 8.8 1.8 0 2 3.48 0.82 1.2 0
RABG3d 44916 AT1G52280 2 0.01 – – – – – – – –
RABG3f/Rab7B 30351 AT3G18820 3 0.006 0.8 1.3 0 2 6.94 2.16 1.79 0
RABH1b/ Rab6A
53105 AT2G44610 5 0.07 478 18.3 -1 – – 0.75 1.2 0
RABH1e 30604 AT5G10260 2 0.05 – – – – – – – –
Arf ARLA1c 26509 AT3G49870 3 0.79 0.58 1.13 0 2 4.49 1.07 1.67 0
ARFA1e 422 AT3G62290 3 0.13 – – – 3 26.62 – – –
ARFA1f 22081 AT1G10630 5 0.15 – – – 6 19.71 – – –
SAR1c 34375 AT4G02080 – – – – – 3 4.91 – – –
Ran STL2P/SEC12P-Like
54385 AT2G01470 – – 2319 5.37 1 – – 0.67 1.04 0
RANBP1 42600 AT5G58590 5 0.5 3.4 2.8 0 7 129.80 0.6 1.98 0
RANBP1b 2905 AT2G30060 – – 1.3 4.2 0 5 130.08 280 22.3 1
RAN3 57970 AT5G55190 2 0.87 0.64 1.82 0 7 20.25 3.7 1.67 0
Rho GP3/ROP4 29311 AT1G75840 2 0.28 – – 0 – – – – –
GDI GDI1 34016 AT2G44100 – – 1.58 2.18 0 3 5.00 0.73 1.13 0
GDI2-like 876 AT5G09550 – – – – – 2 3.11 – – –
VAMP/R-SNAREs
SEC22 58654 AT1G11890 2 0.20 26.9 13.6 -1 – – 1.06 1.46 0
VAP27-1 54676 AT3G60600 2 0.77 – – – – – – – –
VAMP713 23669 AT5G11150 2 1.41 – – – – – – – –
Qa-SNAREs
SYP132 (syntaxin 132)
12539 AT5G08080 – – 3 6.2 0 2 3.21 1.25 1.65 0
VAM3 (syntaxin 22)
37248 AT5G46860 – – 1.35 1.86 0 – – 4.5 2.3 0
Qb-SNAREs
VTI11 24253 AT5G39510 2 0.05 0.65 1.37 0 – – 0.5 1.2 0
Qc-SNAREs
SYP71 (SYNTAXIN)
27696 AT3G09740 – – 2.17 4.34 0 – – – – –
ALPHA-SNAP2 2375 AT3G56190 – – 1.00 1.00 0 – – 6.41 7.6 0
Several small G-proteins belonging to the sub-families RAB, ARF, RHO and RAN were differentially expressed during fruit development. For example, proteins belong-ing to the RAB-like sub-family (nomenclature accordbelong-ing to Vernoudet al., [48]); RABA1a, RABA1 d, RABA1f, RABA2a, RABA2b, RABB1b, RABB1c, RABD1, RABD2a, RABD2b, RABE1a, RABE1c, RABE1e, RABG3 d, RABG3f, RABH1b and RABH1e were found to be differ-entially expressed (Table 3). During the transition between early Stage II to Stage II most of this group of proteins was down-regulated according to dMS, except for RABA2a and RABE1c. Similarly to dMS, SC showed that RABA1f, RABA2a, RABA2b, RABB1c, RABD1, RABD2a, RABE1a and RABH1b, were down-regulated while no changes were detected in RABA1 d, RABE1c and RABG3f. During the transition from Stage II to Stage III, RABA1a, RABA2a, RABB1b, RABB1c, RABD2a, RABE1c and RABG3f were shown to be up-regulated by dMS (Table 3). SC detected up-regulation only for RABA2a, RABB1c and RABD2a at these stages. Few members of the ADP-ribosylation factor (ARF) were also
found to be differentially expressed during fruit develop-ment. ARFA1e and ARFA1f were down-regulated during the transition from early Stage II to Stage II. On the other hand, ARLA1c remained unchanged (Table 3). ARFA1e, ARFA1f, ARLA1c and SAR1 provide another example of the difference in accuracy between dMS and SC. While dMS indicated that these four proteins were up-regulated during the later stages of fruit development (Table 3), SC indicated no change. Four members of the RAN family, SEC12p, RANBP1, RANBP1b and RAN3 were identified in this study. The expression of RAN3 remained unchanged during the early stages of fruit development (as shown by both dMS and SC) but was up-regulated during the later stages. Both dMS and SC indicated that the expression of RANBP1b was up-regu-lated during the later stages of fruit development while only dMS showed up-regulation of RANBP1. SEC12p was up-regulated during the early stages and remained unchanged during the later stages of fruit development.
Among the members of the RHO family, ROP4 was down-regulated at earlier stages of development (Table 4).
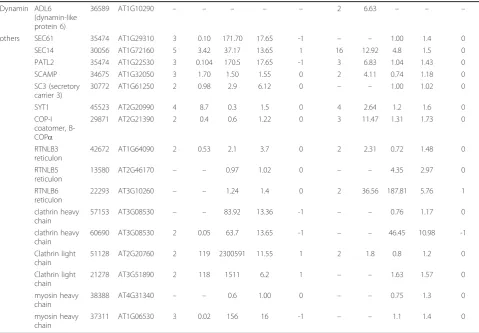
Table 3 Vesicular trafficking-related proteins identified by dMS and SC. (Continued)
Dynamin ADL6 (dynamin-like protein 6)
36589 AT1G10290 – – – – – 2 6.63 – – –
others SEC61 35474 AT1G29310 3 0.10 171.70 17.65 -1 – – 1.00 1.4 0
SEC14 30056 AT1G72160 5 3.42 37.17 13.65 1 16 12.92 4.8 1.5 0
PATL2 35474 AT1G22530 3 0.104 170.5 17.65 -1 3 6.83 1.04 1.43 0
SCAMP 34675 AT1G32050 3 1.70 1.50 1.55 0 2 4.11 0.74 1.18 0
SC3 (secretory carrier 3)
30772 AT1G61250 2 0.98 2.9 6.12 0 – – 1.00 1.02 0
SYT1 45523 AT2G20990 4 8.7 0.3 1.5 0 4 2.64 1.2 1.6 0
COP-I coatomer, B-COPa
29871 AT2G21390 2 0.4 0.6 1.22 0 3 11.47 1.31 1.73 0
RTNLB3 reticulon
42672 AT1G64090 2 0.53 2.1 3.7 0 2 2.31 0.72 1.48 0
RTNLB5 reticulon
13580 AT2G46170 – – 0.97 1.02 0 – – 4.35 2.97 0
RTNLB6 reticulon
22293 AT3G10260 – – 1.24 1.4 0 2 36.56 187.81 5.76 1
clathrin heavy chain
57153 AT3G08530 – – 83.92 13.36 -1 – – 0.76 1.17 0
clathrin heavy chain
60690 AT3G08530 2 0.05 63.7 13.65 -1 – – 46.45 10.98 -1
Clathrin light chain
51128 AT2G20760 2 119 2300591 11.55 1 2 1.8 0.8 1.2 0
Clathrin light chain
21278 AT3G51890 2 118 1511 6.2 1 – – 1.63 1.57 0
myosin heavy chain
38388 AT4G31340 – – 0.6 1.00 0 – – 0.75 1.3 0
myosin heavy chain
37311 AT1G06530 3 0.02 156 16 -1 – – 1.1 1.4 0
* The column“direction”under spectral counting measurement represent expression direction, 1 = up-regulated, 0 = no change, -1 = down-regulated. Proteins identified by dMS were considered to be upregulated when expression fold > 2, not changed when 0.5 < fold < 2 and down-regulated when fold change was < 2. For SC Bayes factor of > 10 was used for significance difference.
Katzet al.Proteome Science2010,8:68 http://www.proteomesci.com/content/8/1/68
Interestingly, dMS showed that two RAB GDI (GDP-RAB dissociation inhibitors), GDI1 and GDI2-like were up-regulated during the later stages of fruit development while only GDI1was identified by SC. Three R-SNAREs were identified; SEC22 that was down-regulated during the transition from early Stage II to Stage II, VAMP27-1 and VAMP713 were identified but were not found to be differentially expressed. Five Q-SNAREs were identified but only VTI11 (Qb-SNARE) was found to be down-regu-lated during early stages of development while SYP132 (Qa-SNARE, syntaxin) was found to be up-regulated dur-ing late stages of development. SNF7, a component of the endosomal ESCRT III complex that functions in cargo recognition and sorting [49], was up-regulated during the late stages of development. Additional proteins related to vesicular trafficking such as dynamin, COP-I coatomer, reticulon 3 and 6, and proteins related to secretory mem-brane carriers such as SEC14, PATL2 and SYT1 were up-regulated during the late stages of fruit development, while SEC 14, SYT1, and light chain of clathrin were up-regulated during the transition from early Stage II to Stage II. Heavy chain of clathrin was down-regulated throughout development (Table 3).
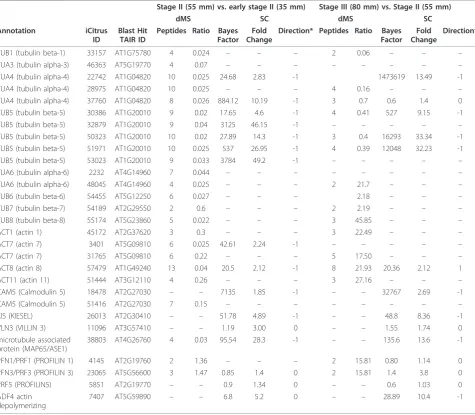
Differential protein expression was also found in other important groups of proteins, actins and tubulins, key factors in trafficking, cell division and enlargement [50]. TUB1, TUA3, TUA4, TUB5, TUA6, TUB6 and TUB8 were down-regulated in the transition from early Stage II to Stage II (Table 4). TUB1, TUA4, TUB5, TUA6 and TUB6 were down-regulated further during the transition from Stage II to Stage III while TUB7 and TUB8 were up-regulated during this transition. Actins, driving vesi-cular movement towards their destination, showed sig-nificant changes during fruit development (Table 4). ACT1, ACT7, ACT8 and ACT11 were down-regulated during the transition from early stage II to stage II and were up regulated during the transition from stage II to stage III (Table 4).
Down-regulation of other proteins related to the vesi-cle movements such as CaM5 (which binds to the motor protein kinesin [51,52] and myosin were detected (Table 4). Profilins, PFN1, PFN3 and PFN5, involved in actin polymerization and cytoskeleton organization did not change during the transition from early Stage II to Stage II, but PFN1 and PFN3 were up-regulated during the transition from Stage II to Stage III. Another pro-tein, ADF4, involved in actin de-polymerization was down regulated during the transition to Stage III. Microtubule Associated Protein 65 (MAP65) and KIS (Tubulin cofactor A) involved in tubulin complex assembly and cell division [53,54], were down-regulated throughout fruit development (Table 4).
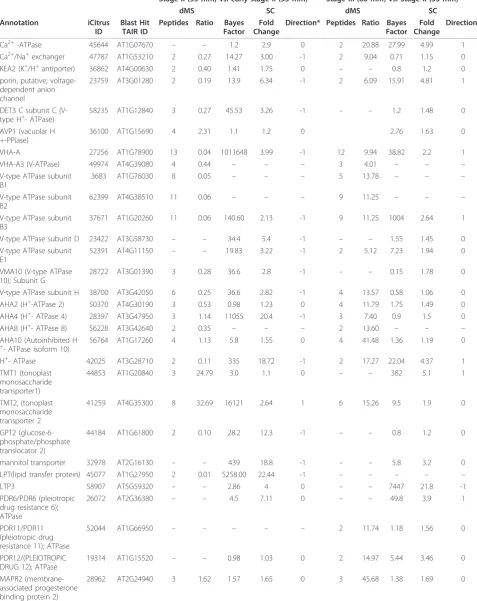
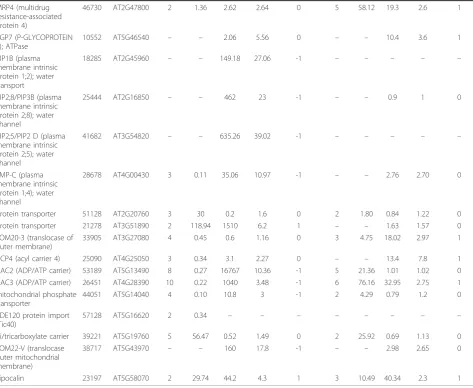
Transporters play a crucial role in cell growth and homeostasis, especially in specialized solute accumulating
cells such as citrus juice cells. As expected, many changes in transporters protein expression were noted during fruit development (Table 5). During the transition from early Stage II to Stage III, there was a significant down-regulation of subunits of lysosomal ATPases and cation transporters associated with K+- and Na+-coupled trans-port. On the other hand, only one plasma membrane-bound ATPase displayed down-regulation (similar to AHA8), while those similar to AHA2, AHA4 and AHA10 were not significantly changed. In general, these changes were noted using both dMS and SC. Most of the proteins that were down-regulated during the transition from early to Stage II, were up-regulated during the transition from Stage II to Stage III (Table 5), suggesting their role during fruit expansion. Similar results were seen with mitochondrial-bound proteins such as ACP4, ADP/ATP carriers and others. Two tonoplast monosaccharide transporters, TMT1and TMT2 were up-regulated during the transition from early to stage II and TMT2 was further up-regulated during the later stages of fruit devel-opment. A dicarboxylate/tricarboxylate carrier was up-regulated throughout development. Plasma membrane water channels PIP1B/PIP1;2, TMP-C/PIP1;4, PIP2;8/ PIP3B and PIP2;5/PIP2 D were down-regulated during the transition from early to Stage II according to SC (Table 5).
Discussion
In this study we describe a label-free shotgun approach to establish a proteomics workflow for the identification of the protein changes occurring during citrus fruit development. We analyzed and compared juice sac cells extracted from fruits at three stages of development. The end of Stage I (early Stage II), characterized by extensive cell division; Stage II, where cell division ceases and the juice cell sacs expand with the accumula-tion of large amounts of solutes and water; and Stage III, where the fruit matures and ripens [55,56]. It should be noted that it was practically impossible to extract juice sac cell proteins at Stage I (fruit diameter ≈10-15 mm) because at this stage the juice sac cells are not well developed.
Comparative proteomics studies in plants are still lag-ging behind studies done in mammalian cells and are predominantly performed by employing 2DE-gels [57]. Although differential proteomics studies employing label-free quantification have been published during the last few years [9,10,24], in plants these studies are scarce [26,43].
sequences from three different sources, HarvEST:Citrus http://harvest.ucr.edu/, NCBI’s Citrus unigenes and NCBI’s Citrus proteins http://www.ncbi.nlm.nih.gov/
Taxonomy/Browser/wwwtax.cgi?mode=In- fo&id=2711&lvl=3&lin=f&keep=1&srchmode=1&un-lock to create one unified database with reduced redundancy for mass spectra search. iCitrus was cre-ated to provide a compact database for the identifica-tion of citrus proteins and a more accurate quantitative expression measurements. The iCitrus interface enabled a fast identification of lists of acces-sions including Arabidopsis homologs, and the use of bioinformatics tools such as MapMan, AraCyc and Cytoscape (Katzet al. in preparation).
The iCitrus resource is essentially an interface that can be used to access pre-calculated Blast results. iCi-trus itself does not make or summarize GO assignments based on rules that weight GO terms from various hits; this is the (perfectly reasonable) philosophy behind Blas-t2GO and related tools. We chose to allow users, instead of iCitrus, to determine if they trust and adopt particular annotations or not. We took this approach to allow individual users to use specific knowledge of pro-tein families or taxonomical differences (i.e. Citrus ver-sus Arabidopsis) to influence their interpretation of the BLAST results. In addition, there may be cases in which GO annotation is absent in the BLAST results against Arabidopsis or Viridiplantae, but a consensus could
Table 4 Structure-related proteins identified by dMS and SC.
Stage II (55 mm) vs. early stage II (35 mm) Stage III (80 mm) vs. Stage II (55 mm)
dMS SC dMS SC
Annotation iCitrus ID
Blast Hit TAIR ID
Peptides Ratio Bayes Factor
Fold Change
Direction* Peptides Ratio Bayes Factor
Fold Change
Direction*
TUB1 (tubulin beta-1) 33157 AT1G75780 4 0.024 – – – 2 0.06 – – –
TUA3 (tubulin alpha-3) 46363 AT5G19770 4 0.07 – – – – – – – –
TUA4 (tubulin alpha-4) 22742 AT1G04820 10 0.025 24.68 2.83 -1 1473619 13.49 -1
TUA4 (tubulin alpha-4) 28975 AT1G04820 10 0.025 – – – 4 0.16 – – –
TUA4 (tubulin alpha-4) 37760 AT1G04820 8 0.026 884.12 10.19 -1 3 0.7 0.6 1.4 0 TUB5 (tubulin beta-5) 30386 AT1G20010 9 0.02 17.65 4.6 -1 4 0.41 527 9.15 -1
TUB5 (tubulin beta-5) 32879 AT1G20010 9 0.04 3125 46.15 -1 – – – – –
TUB5 (tubulin beta-5) 50323 AT1G20010 10 0.02 27.89 14.3 -1 3 0.4 16293 33.34 -1 TUB5 (tubulin beta-5) 51971 AT1G20010 10 0.025 537 26.95 -1 4 0.39 12048 32.23 -1
TUB5 (tubulin beta-5) 53023 AT1G20010 9 0.033 3784 49.2 -1 – – – – –
TUA6 (tubulin alpha-6) 2232 AT4G14960 7 0.044 – – – – – – – –
TUA6 (tubulin alpha-6) 48045 AT4G14960 4 0.025 – – – 2 21.7 – – –
TUB6 (tubulin beta-6) 54455 AT5G12250 6 0.027 – – – 2.18 – – –
TUB7 (tubulin beta-7) 54189 AT2G29550 2 0.6 – – – 2 2.19 – – –
TUB8 (tubulin beta-8) 55174 AT5G23860 5 0.022 – – – 3 45.85 – – –
ACT1 (actin 1) 45172 AT2G37620 3 0.3 – – – 3 22.49 – – –
ACT7 (actin 7) 3401 AT5G09810 6 0.025 42.61 2.24 -1 – – – – –
ACT7 (actin 7) 31765 AT5G09810 6 0.22 – – – 5 17.50 – – –
ACT8 (actin 8) 57479 AT1G49240 13 0.04 20.5 2.12 -1 8 21.93 20.36 2.12 1
ACT11 (actin 11) 51444 AT3G12110 4 0.26 – – – 3 27.16 – – –
CAM5 (Calmodulin 5) 18478 AT2G27030 – – 7135 1.85 -1 – – 32767 2.69 -1
CAM5 (Calmodulin 5) 51416 AT2G27030 7 0.15 – – – – – – – –
KIS (KIESEL) 26013 AT2G30410 – – 51.78 4.89 -1 – – 48.8 8.36 -1
VLN3 (VILLIN 3) 11096 AT3G57410 – – 1.19 3.00 0 – – 1.55 1.74 0
microtubule associated protein (MAP65/ASE1)
38803 AT4G26760 4 0.03 95.54 28.3 -1 – – 135.6 13.6 -1
PFN1/PRF1 (PROFILIN 1) 4145 AT2G19760 2 1.36 – – – 2 15.81 0.80 1.14 0
PFN3/PRF3 (PROFILIN 3) 23065 AT5G56600 3 1.47 0.85 1.4 0 2 15.81 1.4 3.8 0
PRF5 (PROFILIN5) 5851 AT2G19770 – – 0.9 1.34 0 – – 0.6 1.03 0
ADF4 actin depolymerizing
7407 AT5G59890 – – 6.8 5.2 0 – – 28.89 10.4 -1
* The column“direction”under spectral counting measurement represent expression direction, 1 = up-regulated, 0 = no change, -1 = down-regulated. Proteins identified by dMS were considered to be up-regulated when expression fold > 2, not changed when 0.5 < fold < 2 and down-regulated when fold change was < 2. For spectral counting Bayes factor of > 10 was used for significance difference.
Katzet al.Proteome Science2010,8:68 http://www.proteomesci.com/content/8/1/68
Table 5 Transport-related proteins identified by dMS and SC.
Stage II (55 mm) vs. early stage II (35 mm) Stage III (80 mm) vs. Stage II (55 mm)
dMS SC dMS SC
Annotation iCitrus ID
Blast Hit TAIR ID
Peptides Ratio Bayes Factor
Fold Change
Direction* Peptides Ratio Bayes Factor
Fold Change
Direction*
Ca2+-ATPase 45644 AT1G07670 – – 1.2 2.9 0 2 20.88 27.99 4.99 1
Ca2+/Na+exchanger 47787 AT1G53210 2 0.27 14.27 3.00 -1 2 9.04 0.71 1.15 0 KEA2 (K+/H+antiporter) 36862 AT4G00630 2 0.40 1.41 1.75 0
– – 0.8 1.2 0
porin, putative; voltage-dependent anion channel
23759 AT3G01280 2 0.19 13.9 6.34 -1 2 6.09 15.91 4.81 1
DET3 C subunit C (V-type H+- ATPase)
58235 AT1G12840 3 0.27 45.53 3.26 -1 – – 1.2 1.48 0
AVP1 (vacuolar H +-PPiase)
36100 AT1G15690 4 2.31 1.1 1.2 0 2.76 1.63 0
VHA-A 27256 AT1G78900 13 0.04 1011648 3.99 -1 12 9.94 38.82 2.2 1
VHA-A3 (V-ATPase) 49974 AT4G39080 4 0.44 – – – 3 4.01 – – –
V-type ATPase subunit B1
3683 AT1G76030 8 0.05 – – – 5 13.78 – – –
V-type ATPase subunit B2
62399 AT4G38510 11 0.06 – – – 9 11.25 – – –
V-type ATPase subunit B3
37671 AT1G20260 11 0.06 140.60 2.13 -1 9 11.25 1004 2.64 1
V-type ATPase subunit D 23422 AT3G58730 – – 34.4 5.4 -1 – – 1.55 1.45 0
V-type ATPase subunit E1
52391 AT4G11150 – – 19.83 3.22 -1 2 5.12 7.23 1.94 0
VMA10 (V-type ATPase 10); Subunit G
28722 AT3G01390 3 0.28 36.6 2.8 -1 – – 0.15 1.78 0
V-type ATPase subunit H 38700 AT3G42050 6 0.25 36.6 2.82 -1 4 13.57 0.58 1.06 0 AHA2 (H+-ATPase 2) 50370 AT4G30190 3 0.53 0.98 1.23 0 4 11.79 1.75 1.49 0 AHA4 (H+- ATPase 4) 28397 AT3G47950 3 1.14 11055 20.4 -1 3 7.40 0.9 1.5 0
AHA8 (H+- ATPase 8) 56228 AT3G42640 2 0.35 – – – 2 13.60 – – –
AHA10 (Autoinhibited H +
- ATPase isoform 10)
56764 AT1G17260 4 1.13 5.8 1.55 0 4 41.48 1.36 1.19 0
H+- ATPase 42025 AT3G28710 2 0.11 335 18.72 -1 2 17.27 22.04 4.37 1
TMT1 (tonoplast monosaccharide transporter1)
44853 AT1G20840 3 24.79 3.0 1.1 0 – – 382 5.1 1
TMT2, (tonoplast monosaccharide transporter 2
41259 AT4G35300 8 32.69 16121 2.64 1 6 15.26 9.5 1.9 0
GPT2 (glucose-6-phosphate/phosphate translocator 2)
44184 AT1G61800 2 0.10 28.2 12.3 -1 – – 0.8 1.2 0
mannitol transporter 32978 AT2G16130 – – 439 18.8 -1 – – 5.8 3.2 0
LPT(lipid transfer protein) 45077 AT1G27950 2 0.01 5258.00 22.44 -1 – – – – –
LTP3 58907 AT5G59320 – – 2.86 4 0 – – 7447 21.8 -1
PDR6/PDR6 (pleiotropic drug resistance 6); ATPase
26072 AT2G36380 – – 4.5 7.11 0 – – 49.8 3.9 1
PDR11/PDR11 (pleiotropic drug resistance 11); ATPase
52044 AT1G66950 – – – – – 2 11.74 1.18 1.56 0
PDR12/(PLEIOTROPIC DRUG 12); ATPase
19314 AT1G15520 – – 0.98 1.03 0 2 14.97 5.44 3.46 0
MAPR2 (membrane-associated progesterone binding protein 2)
emerge from the descriptive text accompanying a hit. We think this combined approach of manual annotation with the assistance of pre-computed BLAST results is more effective when predicting functional information for a not well-annotated organism like Citrus.
Two widely used, but fundamentally different, label-free methods for quantification were used in this study; peak integration (dMS) and spectral counting (SC). For dMS, we used a two-fold change as a threshold for dif-ferential expression of the identified proteins [25] and a Bayes factor of 10 for spectral counting [58]. Such a stringent threshold is needed because the protein ratios are calculated by averaging the intensity weight of pep-tide ratios, and because the number of peppep-tides identify-ing each protein is highly variable. In most cases, both methods identified similar proteins with some
discrepancies (Figure 4a). These discrepancies derived from the way SIEVE (for dMS) and Scaffold (for SC) handled the peptides information. Scaffold is able to identify peptides in similar proteins and group them together, thus identifying database redundancy, on the other hand, SIEVE does not group similar proteins. When we compare the number of identified proteins by the two methods using the corresponding Arabidopsis homologs of each iCitrus accession identified (Figure 4b) the differences decreased significantly, particularly for dMS (Figure 4). Yet, additional redundancy could arise from possible gene families in Citrus. The wide range of Citrus species used to create HarvEST:Citrus database including Citrus sinensis, Citrus paradise, Citrusunshiu, C.reticulata, C.jambhiri, C. aurantium, C. clementina, C. macrophylla and Poncirustrifoliate,
Table 5 Transport-related proteins identified by dMS and SC. (Continued)
MRP4 (multidrug resistance-associated protein 4)
46730 AT2G47800 2 1.36 2.62 2.64 0 5 58.12 19.3 2.6 1
PGP7 (P-GLYCOPROTEIN 7); ATPase
10552 AT5G46540 – – 2.06 5.56 0 – – 10.4 3.6 1
PIP1B (plasma membrane intrinsic protein 1;2); water transport
18285 AT2G45960 – – 149.18 27.06 -1 – – – – –
PIP2;8/PIP3B (plasma membrane intrinsic protein 2;8); water channel
25444 AT2G16850 – – 462 23 -1 – – 0.9 1 0
PIP2;5/PIP2 D (plasma membrane intrinsic protein 2;5); water channel
41682 AT3G54820 – – 635.26 39.02 -1 – – – – –
TMP-C (plasma membrane intrinsic protein 1;4); water channel
28678 AT4G00430 3 0.11 35.06 10.97 -1 – – 2.76 2.70 0
protein transporter 51128 AT2G20760 3 30 0.2 1.6 0 2 1.80 0.84 1.22 0
protein transporter 21278 AT3G51890 2 118.94 1510 6.2 1 – – 1.63 1.57 0
TOM20-3 (translocase of outer membrane)
33905 AT3G27080 4 0.45 0.6 1.16 0 3 4.75 18.02 2.97 1
ACP4 (acyl carrier 4) 25090 AT4G25050 3 0.34 3.1 2.27 0 – – 13.4 7.8 1
AAC2 (ADP/ATP carrier) 53189 AT5G13490 8 0.27 16767 10.36 -1 5 21.36 1.01 1.02 0 AAC3 (ADP/ATP carrier) 26451 AT4G28390 10 0.22 1040 3.48 -1 6 76.16 32.95 2.75 1 mitochondrial phosphate
transporter
44051 AT5G14040 4 0.10 10.8 3 -1 2 4.29 0.79 1.2 0
PDE120 protein import (Tic40)
57128 AT5G16620 2 0.34 – – – – – – – –
di/tricarboxylate carrier 39221 AT5G19760 5 56.47 0.52 1.49 0 2 25.92 0.69 1.13 0 TOM22-V (translocase
outer mitochondrial membrane)
38717 AT5G43970 – – 160 17.8 -1 – – 2.98 2.65 0
Lipocalin 23197 AT5G58070 2 29.74 44.2 4.3 1 3 10.49 40.34 2.3 1
* The column“direction”under spectral counting measurement represent expression direction, 1 = up-regulated, 0 = no change, -1 = down-regulated. Proteins identified by dMS were considered to be up-regulated when expression fold > 2, not changed when 0.5 < fold < 2 and down-regulated when fold change was < 2. For spectral counting Bayes factor of > 10 was used for significance difference.
Katzet al.Proteome Science2010,8:68 http://www.proteomesci.com/content/8/1/68
consists of sequences that are similar but not identical therefore were not screened out from the iCitrus data-set. In addition, some of the sequences in the database that might originate from the same unigene did not overlap therefore could not be assembled, contributing to the difference in number of proteins identified (Table 1).
Currently, non-overlapping sequences cannot be assembled until more ESTs can be produced to cover the missing gaps or until the Citrus genome is fully sequenced [59]. A significant number of proteins (144 in dMS and 118 in SC in the Stage II vs. early Stage II comparison, and 119 in dMS and 255 proteins in SC, in the Stage III vs. Stage II comparison) were identified by only one of the methods due to the inherent differences of dMS and SC workflows. SEQUEST and SIEVE (dMS workflow) use protein probability cut-off based on false discovery rate (FDR) according to the Decoy method [60]. X!Tandem, Scaffold and Qspec (SC workflow) use peptide identification probability criteria as specified by the Peptide Prophet algorithm [61]. The different work-flows affect some of the proteins identification. The per-formance of the SC method depends strongly on the depth of the MS/MS sampling because ratios by SC are most significant for proteins with large numbers of pro-duct ion spectra, while ratios by dMS are most signifi-cant for proteins with large numbers of overlapping peptide ions [25]. This also explains the higher percen-tage of proteins that were found to be significantly dif-ferent by dMS and not significant by SC (Figures 3, 5a). Therefore, dMS provides more accurate measurements of compared samples while SC is faster and easier to use. Our data show that dMS is more accurate in mea-suring differences in protein expression [25]. dMS pro-vide rich information of the LC-MS data but requires a massive computational effort to be spent on processing the data including background filtering, peak frame detection and alignment [62,63]. Spectral counting is conceptually simpler and can be as sensitive as dMS in terms of detection range while retaining linearity [25,30,64]. Nevertheless, SC is less accurate in detecting differences in protein expression, in particular for less abundant proteins. Our results clearly show that the integrated use of both methods for quantification increases the power for detecting changes in shotgun proteomics experiments, and that both methods should be use in combination to gain insight of the complex protein network and a complete identification of its components.
Changes in a large number of small GTPases were identified during citrus fruit development. The expres-sion of a relatively large number of members of the RAB, ARF, RHO and RAN families of small GTPases changed during the different stages. Although we cannot
assign specific roles to all of these proteins, they clearly indicate a different role(s) of these members during the stages of citrus juice sac cell development. Vesicular trafficking is essential for fruit development [65-67]. During the Stage I there is intensive cell division [56]. Cytoskeleton elements (actins, tubulins, etc.) together with small G-proteins and coatomer complexes are vital to cell division, cell plate formation, cell polarity, etc. [68]. The expression of many of these proteins decreased during the transition from early Stage II to Stage II. This correlated well with the attenuation of cell division in the growing fruit and the prevalence of cell expansion. This notion was reinforced by the notable increase in expression of other small GTPases, auxiliary proteins and cytoskeletal components. Similar to the small G-proteins, changes in the expression of proteins associated with vesicular movements, docking and fusion were seen. In addition to different SNAREs (Qa, Qb, Qc, syntaxins, etc.), there was changes in COPI coatomers, clathrin, dynamin, and others suggesting the occurrence of endocytosis, exocytosis and vesicular traf-ficking during fruit development. Notably, while the expression of plasma membrane-associated H+-ATPases did not change during the early stages of development, changes in endosomal-associated H+-ATPases (V-type) paralleled the changes seen in the secretory and vesicu-lar trafficking machinery. V-type ATPases and organelvesicu-lar acidification is essential for vesicular trafficking along exocytotic and endocytotic pathways [69,70].
Although significant changes in sugar contents and sugar homeostasis are expected during fruit develop-ment [71,72], changes in expression of only two putative vacuolar monosaccharide transporters (TMT1 and TMT2) were noted. A plausible explanation is that the expression of other sugar transporters did not change (although they could have been modified by post-trans-lational mechanisms). In support of this notion, Etxeber-ria et al. [73,74] demonstrated a mechanism of sugar transport into the juice sac cells and sucrose into the vacuoles that is mediated by endocytosis and intracellu-lar vesicuintracellu-lar trafficking. The protein inventory developed in this work, provides a preliminary glance at the func-tion(s) of these proteins during the different stages of fruit development and in particular during cell division (Stage I, early Stage II) and cell expansion (Stage II) and assimilate mobilization, sugar accumulation and pro-cesses regulating fruit maturation and ripening.
bioinformatics tool for the high throughput identification of citrus proteins. Two methods for label-free based shot-gun proteomics were used and compared; peak integra-tion (or differential mass-spec) and spectral counting. We have identified approximately 1500 citrus protein accessions expressed in fruits and quantified their expres-sion changes during fruit development. Our results showed that both methods can provide significant infor-mation on protein changes, with dMS providing higher accuracy. Our results clearly suggest that dMS and SC are matching, broadening the identification spectrum and providing complementary data on the change trends dur-ing the particular processes bedur-ing compared.
Methods
Plant material, protein extraction and precipitation Orange Navel fruits at three different developmental stages, early stage II (35 mm in fruit diameter), stage II (55 mm) and stage III (80 mm) [55] were obtained from the Lindcove Research Center, University of California, Exeter, CA. Juice sacs were collected from at least 20 fruits and pooled at each stage. Two independent biological repetitions from two consecutive years were used and teins were isolated as described before [18]. Soluble pro-teins were precipitated using a chloroform/methanol extraction method as described by Wessel and Flugge [75]. The samples were resuspended with 100μl of 1% Acetonitrile and sonicated for 10 min and centrifuged at 10,000gfor 3 min. The supernatant was spin-dialyzed into 50 mM ammonium-bicarbonate (AMBIC), then pre-pared for MS analysis using standard reduction, alkylation, and tryptic digest procedures [76]. Dichloromethane was added (50/50 v/v with aqueous digest) before vortexing for 1 min. Samples were centrifuged for 5 min at 10,000gin a microcentrifuge and the upper layer-containing peptides dried down and the peptides resolubilized in 2% acetoni-trile/0.1% trifluoroacetic acid for LC-MS/MS analysis.
Membrane-bound proteins were spin-dialyzed into 50 mM AMBIC. An endo-polygalacturonanase (Mega-zyme) was employed to degrade pectins overnight at room temperature and the suspensions centrifuged and the pellets retained. Membranes were resolubilized in 50 mM AMBIC and digested with trypsin. The suspen-sion was centrifuged 10 min at 10,000gand the super-natant containing tryptic peptides retained. Delipidation was performed with dichloromethane and the peptides resolubilized in 2% acetonitrile/0.1% trifluoroacetic acid for LC-MS/MS analysis.
Mass Spectrometry and Data Analysis
Digested peptides were separated by reversed-phase chromatography using a Waters nanoACQUITY-UPLC system (Milford, MA), with a Waters BEH C181.7 μm, 100μm × 10 cm column. A binary solvent gradient was
employed; buffer A was composed of 0.1% formic acid and buffer B composed of 100% acetonitrile (CAN). The 120 min gradient consisted of the steps 2-45% buffer B in 40 min, 45-80% buffer B in 65 min, hold for 1 min, 80-2% buffer B in 4 min, then hold for 10 min. Sepa-rated peptides were analyzed in a Thermo-Scientific LTQ-FT Ultram mass-spectrometer (San Jose, CA) with a Michrom captive spray nano-electrospray ionization source at a flow rate of 2μl/min. MS and MS/MS spec-tra were acquired using a top 4 method, where the 4 most abundant ions in the MS scan were selected for automated low energy Collision-induced Dissociation (CID) with a 30 s exclusion time and repeat count of 2. The FTMS scan was obtained for the m/z range 300-1400 Da at 50,000 resolution. An isolation width of 2.5 Da was used for ITMS, and a normalized collision energy of 35% was used for the fragmentation. Five technical repeats of each pooled sample (older vs younger fruit) were each analyzed by SIEVE using blanks (washes) between each sample run.
Protein Identification and Validation, dMS workflow Tandem mass spectra were extracted with Xcalibur ver-sion 2.0.7. All MS/MS samples were analyzed using SEQUEST (Protein Discoverer 1.1; Thermo-Scientific, San Jose, CA). SEQUEST was set up to search a FASTA file of the iCitrus Protein Database (see below), assum-ing the digestion enzyme trypsin. SEQUEST was searched with a peptide ion mass tolerance of 25 ppm and a fragment ion mass tolerance of 1.0 Da. Oxidation of methionine and iodoacetamide derivative of cysteine was specified in SEQUEST as possible modifications. DTASelect software was used to filter out low score matching. The filtering criteria consisted of Cross-correlation (xcorr) values larger than 1.5 for single-charged ions, 2.2 for double-single-charged ions, and 3.3 for triple-charged ions, for both half or fully tryptic pep-tides. This resulted in a false discovery rate of less than 5% using a decoy search strategy.
Differential Expression mass spectrometry, dMS workflow Samples were analyzed using a Thermo Scientific LTQ-FT mass-spectrometer and a Michrom-Paradigm HPLC. Peptides were separated using a 200 μm × 15 cm Michrom Magic C18 reverse-phase column over 45 min using an acetonitrile gradient of 2%-60%. The mass-spectrometer was set to acquire spectra in standard top 3 method where 1 high resolution scan (100 K resolu-tion) was acquired every sec with subsequent MS/MS spectra acquired in the LTQ simultaneously.
Samples were analyzed using SIEVE (Thermo Scientific, San Jose Ca). SIEVE is a label-free-differential expression package that aligns the MS spectra over time from differ-ent experimdiffer-ental conditions and then determines features Katzet al.Proteome Science2010,8:68
http://www.proteomesci.com/content/8/1/68
in the data (m/z and retention time pairs) that differ across the different conditions. These differences were assigned using various statistics methods such as a P-Value and stan-dard deviation and then sorted based on significance [10], based on the values obtained from the data of each biologi-cal replicate. Label free proteomic profiling was accom-plished using SIEVE 1.3 (Thermo Scientific, San Jose, CA). The following parameters were set to align the retion time and generate the frames needed for abundance calculations. Alignment Parameters; Alignment Bypass = False, Correla-tion Bin Width = 1, RT Limits For Alignment = True, Tile Increment = 150, Tile Maximum = 300, Tile Size = 300, Time Threshold = 0.6. Frame Parameters; AVGCharge Pro-cessor = False, MS2 Corr ProPro-cessor = False, M/Z Min = 300, M/Z Max = 1,400, Frame time Width (min) = 5.0 min-utes, Frame M/Z width = 0.02 da, Search Window % = 50%, Retention Time Start = 5.0 min, Retention Time Stop = 110 min, Peak Intensity threshold = 50,000, Processor Modules = Isotagger V1.1, PCA V1.0. Significance was calculated within SIEVE using a standard T-test and results were fil-tered for a minimum of two peptides identified per protein (using the identification criteria stated in this method sec-tion) with frames having a p value of less than 0.05.
Tandem mass-spectra from peptide features that are considered differentially expressed across conditions are then searched using SEQUEST against iCitrus (see below). Search results were filtered for a False Discovery rate of 5% employing a decoy search strategy utilizing a reverse database [60].
Protein Identification and Validation for Spectral counting Tandem mass-spectra were extracted by Bioworks-3.3. Charge state de-convolution and de-isotoping were not performed. All MS/MS samples were analyzed using X! Tandem http://www.thegpm.org; version TORNADO (2008.02.01.2)). X! Tandem was set up to search the 62,415 entries of iCitrus (see below) assuming the diges-tion enzyme trypsin. X! Tandem was searched with a fragment ion mass tolerance of 0.40 Da and a parent ion tolerance of 25 ppm. Iodoacetamide derivative of cysteine was specified in X! Tandem as a fixed modifica-tion. Deamidation of asparagine, oxidation of methio-nine, sulphone of methiomethio-nine, tryptophan oxidation to formylkynurenin of tryptophan and acetylation of the N-terminus were specified in X! Tandem as variable modifications. Different tandem MS programs were used (SEQUEST for dMS and X!Tandem for Spectral Counting) because of licensing restriction and limited access to SEQUEST that would have generated signifi-cant time delays in the data analysis. Nonetheless, the use of SEQUEST or X!Tandem would have make little or no difference. In addition, in this report we aim at comparing overall methodology (i.e. dMS versus SC) and not their individual components.
Criteria for protein identification for Spectral Counting Scaffold 2.06.00 (Proteome Software Inc., Portland, OR) was used to validate MS/MS-based peptide and protein identifications. Peptide identifications were accepted if they could be established at greater than 80.0% probabil-ity as specified by the Peptide Prophet algorithm [61]. Protein identifications were accepted if they could be established at greater than 95.0% probability and con-tained at least 2 identified peptides. Protein probabilities were assigned by the Protein Prophet algorithm [77]. Proteins that contained similar peptides and could not be differentiated based on MS/MS analysis alone were grouped to satisfy the principles of parsimony.
Statistical Analysis for Spectral Counting
Unweighted Spectral counts for the identified proteins obtained from the samples corresponding to two conse-cutive growth seasons were exported from Scaffold and analyzed using QSpec [58] for significance analysis. Pro-teins were considered significantly different across sam-ple conditions if QSpec reported a Bayes factor of > 10. This corresponds to a false discovery rate (FDR) of approximately 5%.
Proteomics Data Set
The data associated with this manuscript may be down-loaded from ProteomeCommons.org Tranche using the following hash:
Cf3G8KatEeCbDv2kV1Gnw4njaSYARJgmtyzYl +5764Gsbb/M3LX+/oo1zcHnHK1Gs0ukuBM5Rk +Q1t5hpia109pVPXkAAAAAAAAoLg==The hash may be used to prove exactly what files were published as part of this manuscript’s data set, and the hash may also be used to check that the data has not changed since publication.
Additional material
Arabidopsis orViridiplantaeprotein similar to the citrus sequence are shown next, including links to TAIR and NCBI. Finally, GO annotations are listed when available. The final column“Annotation”contains TAIR-specific annotations that do not use the same terms as the Gene Ontology, but are available for the TAIR proteins. The data can be downloaded to any spreadsheet.
Additional file 2: Table S1. Conversion table into iCitrus. Conversion table of HarvEST:Citrus, NCBI/Citrus/ESTs and NCBI/Citrus/Proteins accessions into iCitrus accessions. A complete list of all iCitrus accessions can be found in columns A (62,415 accessions). Column A consists of accessions from three databases: (1) NCBI/Citrus/Unigenes (accessions are numbered S#####) (2) HarvEST:Citrus ESTs (UC46_#####) (3) NCBI/Citrus/ Proteins (#####) and column B consist of the corresponding iCitrus ID’s. iCitrus ID’s organized in ascending order. A list of accessions, originated from the three databases that were found to be clustered together is shown in columns D-F. Column D consists of accessions that were found to be clustered with other accessions and column E consists of accessions that clustered with accessions in column D. Column F consists of the corresponding iCitrus accessions of the clustered accessions appeared in columns D and E. A list of accessions that are found in the databases (NCBI and HarvEST:Citrus) but are shorter than 50 AA between stop codons, are shown in column H. These sequences were taken out of iCitrus database and cannot be found in the FASTA file (Additional File 1). Fast conversion table between the different sources of sequences can be found in columns L-O.
Additional file 3: Figure S1. Alignment and analysis of LC-MS/MS runs. 10 replicate LC-MS/MS runs (5 per condition) aligned and analyzed using SIEVE. Several examples for high accuracy RT-XIC pairs are shown. (a) RT-XIC pair for early stage II in blue and stage II, in red. (b) A peptide significantly up-regulated in Blue, (c) a peptide that does not show a significant expression difference, and (d) a peptide significantly up-regulated in red.
Acknowledgements
This work was supported by a research grant No. US-4010-07C from BARD, the United States-Israel Binational Agricultural Research and Development Fund, grant #5200-117 from the California Citrus Research Board, and by the Will W. Lester Endowment, University of California.
Author details
1Department of Plant Sciences, University of California, Davis, CA, 95616, USA.2Genome Center, Proteomics Core Facility, University of California, Davis, CA, 95616, USA.3Genome Center, Bioinformatics Core Facility, University of California, Davis, CA 95616, USA.4Department of Fruit Tree Species, ARO, The Volcani Center, 50250 Bet Dagan, Israel.
Authors’contributions
EK, MGF, AS and EB conceived and designed the experiments. EK, MGF, RAE, and BSP performed the experiments. JNF and DL contributed to the design of iCitrus. EK, MGF, RAE, BSP, AS and EB analyzed the data. EK and EB drafted the manuscript. All authors read and approved the final manuscript.
Competing interests
The authors declare that they have no competing interests.
Received: 20 October 2010 Accepted: 16 December 2010 Published: 16 December 2010
References
1. Sarry JE, Sommerer N, Sauvage FX, Bergoin A, Rossignol M, Albagnac G, Romieu C:Grape berry biochemistry revisited upon proteomic analysis of the mesocarp.Proteomics2004,4:201-215.
2. Carrari F, Baxter C, Usadel B, Urbanczyk-Wochniak E, Zanor M-I, Nunes-Nesi A, Nikiforova V, Centero D, Ratzka A, Pauly M,et al:Integrated analysis of metabolite and transcript levels reveals the metabolic shifts that underlie tomato fruit development and highlight regulatory aspects of metabolic network behavior.Plant Physiology2006,142:1380-1396.
3. Rocco M, D’Ambrosio C, Arena S, Faurobert M, Scaloni A, Marra M: Proteomic analysis of tomato fruits from two ecotypes during ripening. Proteomics2006,6:3781-3791.
4. Deluc L, Grimplet J, Wheatley M, Tillett R, Quilici D, Osborne C, Schooley D, Schlauch K, Cushman J, Cramer G:Transcriptomic and metabolite analyses of Cabernet Sauvignon grape berry development.BMC Genomics2007,8:429.
5. Faurobert M, Mihr C, Bertin N, Pawlowski T, Negroni L, Sommerer N, Causse M:Major proteome variations associated with cherry tomato pericarp development and ripening.Plant Physiology2007,143:1327-1346. 6. Mounet F, Lemaire-Chamley M, Maucourt M, Cabasson C, Giraudel JL,
Deborde C, Lessire R, Gallusci P, Bertrand A, Gaudillere M,et al: Quantitative metabolic profiles of tomato flesh and seeds during fruit development: complementary analysis with ANN and PCA.Metabolomics 2007,3:273-288.
7. Fait A, Hanhineva K, Beleggia R, Dai N, Rogachev I, Nikiforova VJ, Fernie AR, Aharoni A:Reconfiguration of the achene and receptacle metabolic networks during strawberry fruit development.Plant Physiology2008, 148:730-750.
8. Zanor MI, Rambla J-L, Chaib J, Steppa A, Medina A, Granell A, Fernie AR, Causse M:Metabolic characterization of loci affecting sensory attributes in tomato allows an assessment of the influence of the levels of primary metabolites and volatile organic contents.Journal of Experimental Botany 2009,60:2139-2154.
9. Bantscheff M, Schirle M, Sweetman G, Rick J, Kuster B:Quantitative mass spectrometry in proteomics: a critical review.Analytical Biochemistry2007, 389:1017-1031.
10. America AHP, Cordewener JHG:Comparative LC-MS: A landscape of peaks and valleys.Proteomics2008,8:731-749.
11. Schulze WX, Usadel B:Quantitation in mass-spectrometry-based proteomics.Annual Review of Plant Biology2010,61:491-516. 12. Panchaud A, Affolter M, Moreillon P, Kussmann M:Experimental and
computational approaches to quantitative proteomics: Status quo and outlook.Journal of Proteomics2008,71:19-33.
13. Ünlü M, Morgan ME, Minden JS:Difference gel electrophoresis. A single gel method for detecting changes in protein extracts.Electrophoresis 1997,18:2071-2077.
14. Tonge R, Shaw J, Middleton B, Rowlinson R, Rayner S, Young J, Pognan F, Hawkins E, Currie I, Davison M:Validation and development of
fluorescence two-dimensional differential gel electrophoresis proteomics technology.Proteomics2001,1:377-396.
15. Washburn MP, Wolters D, Yates JR:Large-scale analysis of the yeast proteome by multidimensional protein identification technology.Nature Biotechnology2001,19:242-247.
16. Washburn MP, Ulaszek R, Deciu C, Schieltz DM, Yates JR:Analysis of quantitative proteomic data generated via multidimensional protein identification technology.Analytical Chemistry2002,74:1650-1657. 17. Wu CC, MacCoss MJ, Howell KE, Yates JR:A method for the
comprehensive proteomic analysis of membrane proteins.Nature Biotechnology2003,21:532-538.
18. Katz E, Fon M, Lee Y, Phinney B, Sadka A, Blumwald E:The citrus fruit proteome: insights into citrus fruit metabolism.Planta2007, 226:989-1005.
19. Ong S-E, Blagoev B, Kratchmarova I, Kristensen DB, Steen H, Pandey A, Mann M:Stable isotope labeling by amino acids in cell culture, SILAC, as a simple and accurate approach to expression proteomics.Molecular and Cellular Proteomics2002,1:376-386.
20. Hansen KC, Schmitt-Ulms G, Chalkley RJ, Hirsch J, Baldwin MA, Burlingame AL:Mass spectrometric analysis of protein mixtures at low levels using cleavable13C-isotope-coded affinity tag and
multidimensional chromatography.Molecular and Cellular Proteomics2003, 2:299-314.
21. Li J, Steen H, Gygi SP:Protein profiling with cleavable isotope-coded affinity tag (cICAT) reagents: The yeast salinity stress response.Molecular and Cellular Proteomics2003,2:1198-1204.
22. Ross PL, Huang YN, Marchese JN, Williamson B, Parker K, Hattan S, Khainovski N, Pillai S, Dey S, Daniels S,et al:Multiplexed protein quantitation in saccharomyces cerevisiae using amine-reactive isobaric tagging reagents.Molecular and Cellular Proteomics2004,3:1154-1169. 23. Miyagi M, Rao KC:Proteolytic18O-labeling strategies for quantitative
proteomics.Mass Spectrometry Reviews2007,26:121-136. Katzet al.Proteome Science2010,8:68
http://www.proteomesci.com/content/8/1/68