R E S E A R C H
Open Access
The effects of short-term high-fat feeding
on exercise capacity: multi-tissue
transcriptome changes by RNA sequencing
analysis
Ya Xiao
1,2†, Wanshan Wang
3†, Liguo Chen
1†, Jieyu Chen
2, Pingping Jiang
2, Xiuqiong Fu
4, Xiaoli Nie
2, Hiuyee Kwan
4,
Yanyan Liu
2*and Xiaoshan Zhao
2*Abstract
Background:The effects of short-term high fat diets on physiology are elusive and the molecular changes following fat overconsumption remain largely unknown. In this study, we aimed to evaluate exercise capacity in mice fed with a high fat diet (HFD) for 3 days and investigate the molecular mechanisms in the early response to high-fat feeding. Methods:Exercise capacity was assessed by weight-loaded swimming test in mice fed a control diet (10 kcal% fat) or a HFD (60 kcal% fat) for 3 days. Global gene expression of ten important tissues (brain, heart, liver, spleen, lung, kidney, stomach, duodenum, skeletal muscle and blood) was analyzed using RNA Sequencing.
Results:A HFD for just 3 days can induce 71% decrease of exercise performance prior to substantial weight gain (P<0. 01). Principle component analysis revealed that differential gene expression patterns existed in the ten tissues. Out of which, the brain, spleen and lung were demonstrated to have more pronounced transcriptional changes than other tissues. Biological process analysis for differentially expressed genes in the brain, spleen and lung showed that dysregulation of peripheral and central immune response had been implicated in the early stage of HFD exposure. Neurotransmission related genes and circulatory system process related genes were significantly down-regulated in the brain and lung, respectively.
Conclusions:Our findings provide new insights for the deleterious effects of high-fat feeding, especially revealing that the lung maybe as a new important target attacked by short-term high-fat feeding.
Keywords:RNA Sequencing, High-fat feeding, Exercise capacity, Multi-tissue, Short-term
Background
High-fat and high-calorie diets along with a low physical activity lifestyle have contributed to the onset or devel-opment of type 2 diabetes, metabolic syndrome and car-diovascular disease [1]. There has been conflicting results on whether consumption of a high fat diet (HFD) is detrimental or beneficial for endurance performance. Studies in rats have demonstrated a beneficial effect of a fat-rich diet on exercise capacity via increasing the
ability to oxidize fat and concomitantly sparing glycogen content [2–4]. In contrast, Murray et al. [5] reported that 9 days of high-fat feeding impaired energy production and physical performance associated with respiratory un-coupling in skeletal muscle mitochondria. In the present study, we aimed to evaluate exercise capacity in mice fed with a HFD for 3 days and investigate the molecular mechanisms in the early response to high-fat feeding.
Advances in genomic technologies may help to reveal the early molecular changes by enabling simultaneous analysis of thousands of genes in response to a HFD. The serial analysis of gene expression strategy identified 12 transcripts of hypothalamus which regulated by food intake in mice at 3 h after high-fat meal ingestion [6]. * Correspondence:[email protected];[email protected]
†Equal contributors
2School of Traditional Chinese Medicine, Southern Medical University,
Guangzhou, China
Full list of author information is available at the end of the article
The transcriptomic analysis of duodenum mucosa after high-fat meal ingestion in C57BL/6 J mice found sub-stantial changes of genes related to lipid metabolism [7]. Microarray analysis showed markedly changes of numer-ous genes involved in varinumer-ous biological processes in-cluding morphogenesis, fatty acid catabolism and amino acid metabolism following 3 days of high-fat feeding in the skeletal muscle of C57BL/6 J mice [8]. cDNA micro-arrays analysis of mRNA expression showed down-regulation of genes related to fatty acid biosynthesis in the liver of one week HFD-fed BALB/c mice [9].
However, no study to date has simultaneously analyzed the systemic gene expression profile of multi-tissues in re-sponse to short-term HFD and it remains unknown that which tissue has the most pronounced changes of gene expression profile in the early stage after high-fat feeding. Recently, RNA sequencing (RNA-seq), as an attractive al-ternative to microarrays for transcriptome analysis, pro-vides major advances in robustness, comparability and richness of expression profiling data [10]. Thus we utilized RNA-seq to investigate gene expression profile of ten tis-sues (brain, heart, liver, spleen, lung, kidney, stomach, duodenum, skeletal muscle and blood) in C57BL/6 J mice with 3 days of high-fat feeding, which may contribute to the understanding of molecular mechanisms of changes in exercise performance induced by short-term HFD.
Methods
Animals and study protocol
Animal experiments were approved by the Animal Care and Use Committee of Southern Medical University (Approval No.2013027). The methods were carried out in accordance with the approved guidelines. Forty male C57BL/6 J mice at the age of 8 weeks were obtained from Laboratory Animal Center of Southern Medical University (Approval No. SCXK (Yue) 2011–0015). All the animals were maintained in a temperature-controlled room (22–25 °C; 35–55% humidity) with a twelve-hour light/dark cycle. Mice were randomly di-vided into two groups, where 20 mice were fed a control diet (CD, D12450B, 10 kcal% fat) and 20 mice were fed a high fat diet (HFD, D12492, 60 kcal% fat) for 3 days. Mice were allowed free access to food and water. The changes of body weight were observed after 3 days.
Assessment of exercise capacity
A weight-loaded swimming test has been commonly used for assessment of exercise capacity in murine [11, 12]. After 3 days, 10 mice were taken out from each group for swimming exercise performance test which was con-ducted as previously described with some modifications [13]. The mice were not fasted and were loaded the con-stant weight (1.5 g tin wire, attached to the tail). The mice were dropped individually into a swimming pool (30 cm
high, 25 cm in diameter) filled with water at 25 ± 1 °C. It was considered that the mice were exhausted when they failed to return to the surface of water within a 10 s period. The swimming time to exhaustion was used as the index of exercise capacity.
Biochemical assays
After 3 days of feeding, the remaining 10 mice in each group were anesthetized with sodium pentobarbital (75 mg/kg, ip) following a 6 h fasting period. The blood samples were collected by removing the left eyeball of the mice and rapidly centrifuged at 1000g at 4 °C for 10 min. Plasma levels of glucose, triglycerides, total chol-esterol, low-density lipoprotein-cholesterol (LDL-C), high-density lipoprotein-cholesterol (HDL-C), free fatty acids (FFAs), apolipoprotein E (ApoE), C-reactive pro-tein (CRP), superoxide dismutase (SOD), homocyspro-teine (HCY), alanine aminotransferase (ALT), aspartate ami-notransferase (AST), alkaline phosphatase (ALP), total protein (TP), albumin (ALB), globulin (GLB), ALB/GLB, total bilirubin (TBIL), direct bilirubin (DBIL), indirect bilirubin (IBIL), total bile acid (TBA), uric acid (UA), Creatinine (Cr), urea, Cystatin C (CysC), creatine kinase (CK), lactate dehydrogenase (LDH), A-hydroxybutyric acid dehydrogenase (HBDH), potassium (K), sodium (Na), chlorine (Cl) and calcium (Ca) were measured using a multifunctional biochemistry analyzer (Olympus AU2700, Tokyo, Japan). Statistical analyses for biochem-ical assays and assessment of exercise capacity were con-ducted using SPSS (version 19.0) for Windows. The data are reported as mean ± standard error of the mean (SEM). Differences between the compared groups were analyzed by Student’sttest. APvalue less than 0.05 was considered to be statistically significant.
Tissue Processing and RNA Isolation
Five mice of each group were selected randomly from the mice which did not perform weight-loaded swim-ming test for RNA sequencing. Tissue samples included the whole brain and heart, liver, spleen, lung, kidney, stomach, duodenum, skeletal muscle and blood. The samples were dissected and immediately immersed in RNA later solution (Ambion, California, USA). All sam-ples were stored at – 80 °C before processing. Total RNA was extracted from all samples using Trizol re-agent (Invitrogen, Carlsbad, CA). The RNA concentra-tion was quantified using a spectrophotometer (NanoDrop echnologies, Wilmington, DE) and the integ-rity was evaluated by the Agilent Bioanalyzer 2100 (Agilent, Santa Clara, CA).
RNA sequencing and gene expression analysis
combined into a single sample. The cDNA library was conducted by Illumina Tru-Seq RNA Sample Prep Kits (Illumina, San Diego, CA) with Ribosomal RNA deple-tion following manufacturer’s instrucdeple-tions. Samples were sequenced for 50 bp single read using the HiSeq2000 platform. Before alignment, reads with a low quality and adapters were screened by FastQC and removed. The remaining reads were mapped to the mice reference genome (UCSC mm10) with TopHat v2.0.9. The max-imum number allowed for mismatch mapping was 2. Reads Per Kilobase of exon model per Million mapped reads (RPKM) was calculated to express the mRNA abundances. Analysis of differential expression was per-formed using edgeR, which could be used even with the most minimal levels of replication [14]. The read counts per gene were normalized to counts per million (CPM). CPM values were utilized for differential expression ana-lysis, whereas RPKM values were used for principle component analysis (PCA) with the GeneSpring Gx 12.0 software (Agilent Technologies, Palo Alto, CA).
Biological process analysis
Molecule annotation system (MAS) is a set of web tools for function annotation based on integration of various public resources such as Gene Ontology, KEGG, Carta, GenMapp, UniGene, OMIM and more [15]. Bio-logical process analysis for differentially expressed genes (DEGs) was performed using the CapitalBio MAS 3.0 software (CapitalBio Corporation, Beijing, China). Abso-lute fold change >2 withP< 0.05 was considered statisti-cally significant in the RNA-seq analysis.
Real-time quantitative RT-PCR verification of RNA-seq data
To further confirm the findings from the RNA-seq ana-lysis, we selectively examined 22 genes expression (8 genes in the brain, 9 genes in the spleen and 5 genes in the lung) using real-time quantitative RT-PCR (qRT-PCR) method. Five samples from the same kind of tissue of purified RNA in each group were used for qRT-PCR. Total RNA from the samples was first reverse- tran-scribed into cDNA templates with the PrimeScriptTM RT reagent Kit (TaKaRa, Otsu, Japan) according to the manufacturer’s instruction. PCR was run on a ABI 7500 Real-Time PCR System (Applied Biosystems, Inc., Foster City, CA, USA) using the SYBR Premix Ex TaqTM II (Otsu-Shi, Shiga, Japan). The reaction volume was 20μL and the PCR conditions were as follows: 30 s. at 95 °C, 40 cycles of 5 s. at 95 °C and 34 s. at 60 °C, followed by a melting curve analysis step. Every sample was mea-sured in duplicate, and relative quantification was deter-mined by the comparative Ct method (2-ΔΔCT).β-actin was used as a housekeeping gene to normalize the
expression data. The primers used for gene validation are listed in Additional file 1: Table S1.
Results
Body weight and blood plasma metabolites
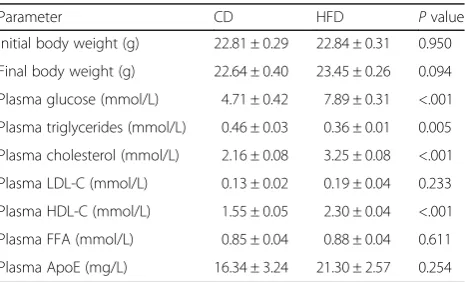
As shown in Table 1, initial and final body weights showed no significantly differences among the groups. HFD feed-ing tended to increase weight gain, but this effect failed to reach statistical significance (P= 0.094). Plasma glucose levels were 67% higher in HFD-fed mice than CD-fed mice (P <0.001). Although no differences were seen in plasma LDL-C, FFA and ApoE, the cholesterol level was significantly greater in the HFD-fed mice (P< 0.001). The increase in HDL-C (P< 0.001) and decrease in plasma tri-glycerides (P= 0.005) were also observed in HFD-fed mice. Plasma levels of CRP, SOD, HCY, ALT, AST, ALP, TP, ALB, GLB, ALB/GLB, TBIL, DBIL, IBIL, TBA, UA, Cr, Urea, CysC, LDH, HBDH, K and Ca were unchanged be-tween the CD and HFD groups except for the CK, Na and Cl (Additional file 2: Table S2).
Exercise capacity in a weight-loaded swimming test The swimming time indicated the exercise capacity. Both groups of mice swam the same mean time at baseline (CD = 687.3 ± 93.9 s, HFD = 669.0 ± 87.8 s). After 3 days of feeding, CD-fed mice maintained a similar swimming time of 748.9 ± 77.4 s, whereas HFD-fed mice swam 213.7 ± 44.4 s on average, 71% less far than the CD-fed mice (P<0.001) (Fig. 1).
Summary of sequencing data and global gene expression profiles
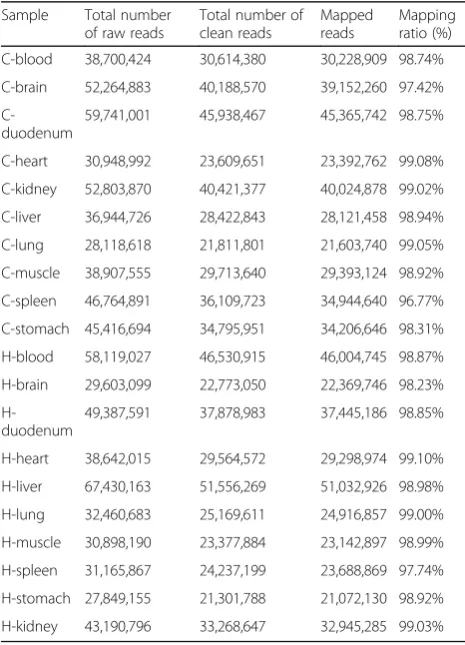
A range of 28.1 to 67.4 million raw reads were generated among samples. After removing reads with a low quality, an average of 32.3 million clean reads per sample was obtained (range, 21.3 to 51.5 million reads). Approxi-mately 98.64% of clean reads per sample were mapped to the mice reference genome among samples (Table 2).
Table 1Body weight and plasma biochemical parameters of CD-fed and HFD-fed mice
Parameter CD HFD Pvalue
Initial body weight (g) 22.81 ± 0.29 22.84 ± 0.31 0.950
Final body weight (g) 22.64 ± 0.40 23.45 ± 0.26 0.094
Plasma glucose (mmol/L) 4.71 ± 0.42 7.89 ± 0.31 <.001
Plasma triglycerides (mmol/L) 0.46 ± 0.03 0.36 ± 0.01 0.005
Plasma cholesterol (mmol/L) 2.16 ± 0.08 3.25 ± 0.08 <.001
Plasma LDL-C (mmol/L) 0.13 ± 0.02 0.19 ± 0.04 0.233
Plasma HDL-C (mmol/L) 1.55 ± 0.05 2.30 ± 0.04 <.001
Plasma FFA (mmol/L) 0.85 ± 0.04 0.88 ± 0.04 0.611
Plasma ApoE (mg/L) 16.34 ± 3.24 21.30 ± 2.57 0.254
Totally 33151 unique genes among all samples was de-tected. To assess the effect of sequencing depth on RNA-seq data, we conducted sequencing saturation ana-lysis. In the beginning of the RNA-seq, with increase of the counts of reads, the number of identified genes in
each tissue was increasing. However, when the counts of reads rose to approximately 30 million, the growth rate of identified genes flattened which indicated that the number of identified genes tended to saturation.
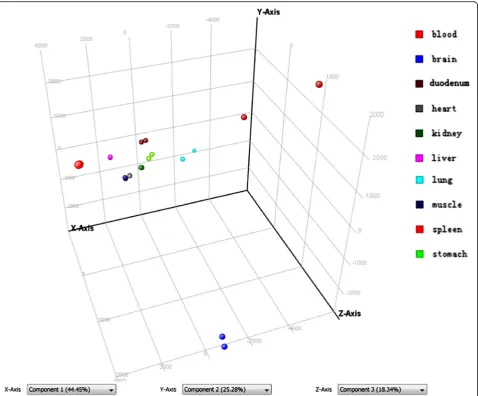
To investigate the global gene expression profiles of ten tissues and identify the tissue with the most pro-nounced transcriptional changes after short-term high-fat feeding, we performed PCA on all samples (Fig. 2). The results showed differential gene expression patterns in the ten tissues. Each sphere represented an individual sample. The sphere representing liver, heart, kidney, skeletal muscle and blood in CD and HFD group over-lapped, indicating that gene expression patterns of HFD-fed mice in the five tissues were almost not changed. The sphere representing stomach and duodenum in CD and HFD group were closely to each other, indi-cating that gene expression patterns of CD-fed and HFD-fed mice in the two tissues were nearly similar. Gene expression patterns of brain, spleen and lung in HFD group showed substantial differences as com-pared with CD group.
Genes and the related biological processes altered in the brain of HFD-fed mice
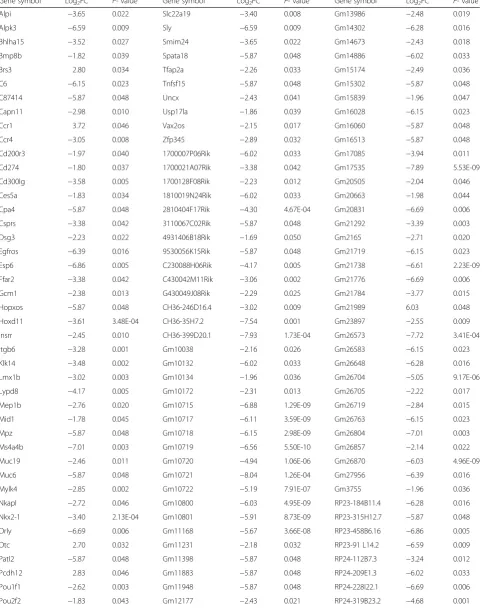
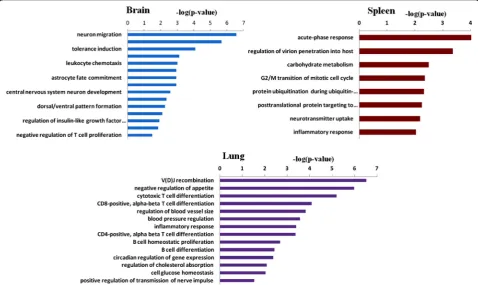
According to the results of PCA, we found that the brain, spleen and lung had more pronounced transcrip-tional changes than other tissues following 3 days of HFD intervention. Consequently, we focused on the ana-lysis of the genes and related biological processes altered in the brain, spleen and lung of HFD-fed mice. We found 145 DEGs in the brain, of which less than half of the genes were annotated with known function from the Ensembl database (Table 3). To gain insight into the possible biologic functions of the genes affected by high-fat feeding, enrichment analysis of Gene Ontology for the DEGs was conducted. After 3 days of HFD exposure, the overrepresented biological processes in the brain were mainly enriched in neurological system process and immune response (Fig. 3). In the neurological sys-tem process related group, LIM homeobox transcription factor 1 beta (Lmx1b), and NK2 homeobox 1(Nkx2-1), which involved in neuron migration and development, were down-regulated to 8.11-fold and 10.56-fold respect-ively in the HFD-fed mice. Genes related to central nervous system morphogenesis were significantly down-regulated, such as homeobox D11 (Hoxd11) (12.21-fold) and UNC homeobox (Uncx) (5.39-fold). Inflammatory/ immune related processes were altered as well. The mRNA levels of chemokine (C-C motif ) receptor 1(Ccr1) was up-regulated to 13.18-fold. The rest immune-related genes including chemokine (C-C motif ) receptor 4 (Ccr4), CD200 receptor 3 (Cd200r3), CD274 molecule (Cd274), CD300 antigen like family member G (Cd300lg) and transcription factor AP-2, alpha (Tfap2a)
Fig. 1Effects of high-fat diet feeding on exercise capacity in C57BL/ 6 J mice (CD, control diet; HFD, high fat diet; *P <0.01 vs. CD-fed mice). Values are expressed as means ± SEM
Table 2Summary of sequence statistics
Sample Total number of raw reads
Total number of clean reads
Mapped reads
Mapping ratio (%)
C-blood 38,700,424 30,614,380 30,228,909 98.74%
C-brain 52,264,883 40,188,570 39,152,260 97.42%
C-duodenum
59,741,001 45,938,467 45,365,742 98.75%
C-heart 30,948,992 23,609,651 23,392,762 99.08%
C-kidney 52,803,870 40,421,377 40,024,878 99.02%
C-liver 36,944,726 28,422,843 28,121,458 98.94%
C-lung 28,118,618 21,811,801 21,603,740 99.05%
C-muscle 38,907,555 29,713,640 29,393,124 98.92%
C-spleen 46,764,891 36,109,723 34,944,640 96.77%
C-stomach 45,416,694 34,795,951 34,206,646 98.31%
H-blood 58,119,027 46,530,915 46,004,745 98.87%
H-brain 29,603,099 22,773,050 22,369,746 98.23%
H-duodenum
49,387,591 37,878,983 37,445,186 98.85%
H-heart 38,642,015 29,564,572 29,298,974 99.10%
H-liver 67,430,163 51,556,269 51,032,926 98.98%
H-lung 32,460,683 25,169,611 24,916,857 99.00%
H-muscle 30,898,190 23,377,884 23,142,897 98.99%
H-spleen 31,165,867 24,237,199 23,688,869 97.74%
H-stomach 27,849,155 21,301,788 21,072,130 98.92%
H-kidney 43,190,796 33,268,647 32,945,285 99.03%
were down-regulated to 8.28-,3.92-, 3.48-, 11.96- and 4.79-fold respectively.
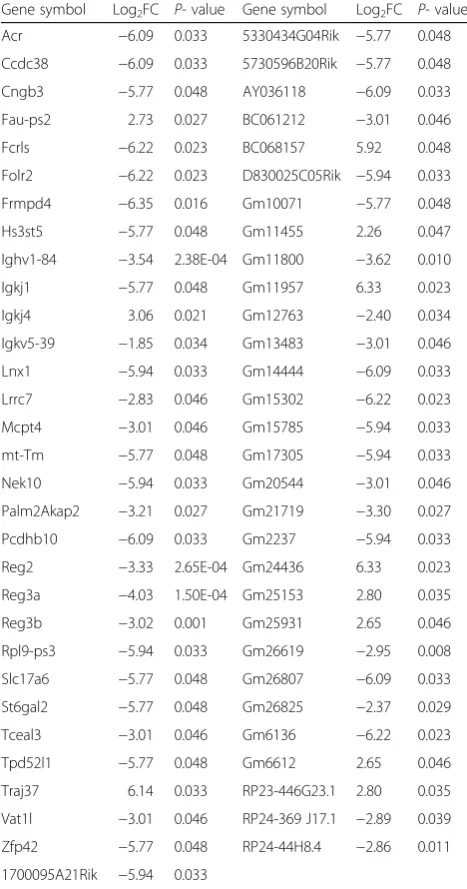
Genes and the related biological processes altered in the spleen of HFD-fed mice
61 genes were markedly changed in the spleen, however, half of which were largely unknown. The overrepsented biological processes in the spleen were mainly re-lated to acute-phase response and immune system, with a significant change in the expression of immune-related genes (Fig. 3). As shown in Table 4, immunoglobulin kappa joining 4 (Igkj4) and T cell receptor alpha joining 37(Traj37) were increased to 8.34- and 70.52-fold re-spectively, while Fc receptor-like S, scavenger receptor (Fcrls), immunoglobulin heavy variable 1–84 (Ighv1-84), immunoglobulin kappa joining 1(Igkj1), immunoglobulin
kappa variable 5–39 (Igkv5-39), regenerating islet-derived 3 alpha (Reg3a) and regenerating islet-islet-derived 3 beta (Reg3b) in various immunological pathways were decreased to 74.54-, 11.63-, 54.57-, 3.60-, 16.34- and 8.11- fold respectively. Other overrepresented biological processes included carbohydrate metabolism, ubiquitin-dependent protein catabolism, G2/M transition of mi-totic cell cycle and neurotransmitter uptake.
Genes and the related biological processes altered in the lung of HFD-fed mice
In the lung, 83 genes were significantly altered. The overrepresented biological processes were mainly enriched in immune-related processes, including T cell and B cell mediated immune response (Fig. 3). As shown in Table 5, Immunoglobulin heavy constant epsilon
Table 3Differentially expressed genes in the brain of HFD-fed mice
Gene symbol Log2FC P- value Gene symbol Log2FC P- value Gene symbol Log2FC P- value
Alpi −3.65 0.022 Slc22a19 −3.40 0.008 Gm13986 −2.48 0.019
Alpk3 −6.59 0.009 Sly −6.59 0.009 Gm14302 −6.28 0.016
Bhlha15 −3.52 0.027 Smim24 −3.65 0.022 Gm14673 −2.43 0.018
Bmp8b −1.82 0.039 Spata18 −5.87 0.048 Gm14886 −6.02 0.033
Brs3 2.80 0.034 Tfap2a −2.26 0.033 Gm15174 −2.49 0.036
C6 −6.15 0.023 Tnfsf15 −5.87 0.048 Gm15302 −5.87 0.048
C87414 −5.87 0.048 Uncx −2.43 0.041 Gm15839 −1.96 0.047
Capn11 −2.98 0.010 Usp17la −1.86 0.039 Gm16028 −6.15 0.023
Ccr1 3.72 0.046 Vax2os −2.15 0.017 Gm16060 −5.87 0.048
Ccr4 −3.05 0.008 Zfp345 −2.89 0.032 Gm16513 −5.87 0.048
Cd200r3 −1.97 0.040 1700007P06Rik −6.02 0.033 Gm17085 −3.94 0.011
Cd274 −1.80 0.037 1700021A07Rik −3.38 0.042 Gm17535 −7.89 5.53E-09
Cd300lg −3.58 0.005 1700128F08Rik −2.23 0.012 Gm20505 −2.04 0.046
Ces5a −1.83 0.034 1810019N24Rik −6.02 0.033 Gm20663 −1.98 0.044
Cpa4 −5.87 0.048 2810404F17Rik −4.30 4.67E-04 Gm20831 −6.69 0.006
Csprs −3.38 0.042 3110067C02Rik −5.87 0.048 Gm21292 −3.39 0.003
Dsg3 −2.23 0.022 4931406B18Rik −1.69 0.050 Gm2165 −2.71 0.020
Egfros −6.39 0.016 9530056K15Rik −5.87 0.048 Gm21719 −6.15 0.023
Esp6 −6.86 0.005 C230088H06Rik −4.17 0.005 Gm21738 −6.61 2.23E-09
Ffar2 −3.38 0.042 C430042M11Rik −3.06 0.002 Gm21776 −6.69 0.006
Gcm1 −2.38 0.013 G430049J08Rik −2.29 0.025 Gm21784 −3.77 0.015
Hopxos −5.87 0.048 CH36-246D16.4 −3.02 0.009 Gm21989 6.03 0.048
Hoxd11 −3.61 3.48E-04 CH36-35H7.2 −7.54 0.001 Gm23897 −2.55 0.009
Insrr −2.45 0.010 CH36-399D20.1 −7.93 1.73E-04 Gm26573 −7.72 3.41E-04
Itgb6 −3.28 0.001 Gm10038 −2.16 0.026 Gm26583 −6.15 0.023
Klk14 −3.48 0.002 Gm10132 −6.02 0.033 Gm26648 −6.28 0.016
Lmx1b −3.02 0.003 Gm10134 −1.96 0.036 Gm26704 −5.05 9.17E-06
Lypd8 −4.17 0.005 Gm10172 −2.31 0.013 Gm26705 −2.22 0.017
Mep1b −2.76 0.020 Gm10715 −6.88 1.29E-09 Gm26719 −2.84 0.015
Mid1 −1.78 0.045 Gm10717 −6.11 3.59E-09 Gm26763 −6.15 0.023
Mpz −5.87 0.048 Gm10718 −6.15 2.98E-09 Gm26804 −7.01 0.003
Ms4a4b −7.01 0.003 Gm10719 −6.56 5.50E-10 Gm26857 −2.14 0.022
Muc19 −2.46 0.011 Gm10720 −4.94 1.06E-06 Gm26870 −6.03 4.96E-09
Muc6 −5.87 0.048 Gm10721 −8.04 1.26E-04 Gm27956 −6.39 0.016
Mylk4 −2.85 0.002 Gm10722 −5.19 7.91E-07 Gm3755 −1.96 0.036
Nkapl −2.72 0.046 Gm10800 −6.03 4.95E-09 RP23-184B11.4 −6.28 0.016
Nkx2-1 −3.40 2.13E-04 Gm10801 −5.91 8.73E-09 RP23-315H12.7 −5.87 0.048
Orly −6.69 0.006 Gm11168 −5.67 3.66E-08 RP23-458B6.16 −6.86 0.005
Otc 2.70 0.032 Gm11231 −2.18 0.032 RP23-91 L14.2 −6.59 0.009
Patl2 −5.87 0.048 Gm11398 −5.87 0.048 RP24-112B7.3 −3.24 0.012
Pcdh12 2.83 0.046 Gm11883 −5.87 0.048 RP24-209E1.3 −6.02 0.033
Pou1f1 −2.62 0.003 Gm11948 −5.87 0.048 RP24-228I22.1 −6.69 0.006
(Ighe) and immunoglobulin heavy constant gamma 1 (G1m marker) (Ighg1) were increased to 52.71- and 6.02-fold respectively, while the mRNA levels of chemo-kine (C-C motif ) receptor 9 (Ccr9), CD8 antigen, alpha chain (Cd8a), recombination activating gene 1(Rag1), re-combination activating gene 2 (Rag2) and suppression inducing transmembrane adaptor 1 (Sit1) were de-creased to 6.32-, 3.94-, 512-, 19.70- and 5.10- fold re-spectively. Circulatory system process was also significantly changed in the lung of HFD-fed mice, with the down-regulation of natriuretic peptide precursor A (Nppa) (7.78-fold) and natriuretic peptide precursor B (Nppb) (21.26-fold). Leptin (Lep) involved in the regula-tion of cholesterol absorpregula-tion were increased to 5.70-fold and CART prepropeptide (Cartpt) related to cell glucose homeostasis were decreased to 62.25-fold. Other
overrepresented biological processes included circadian regulation of gene expression and positive regulation of transmission of nerve impulse.
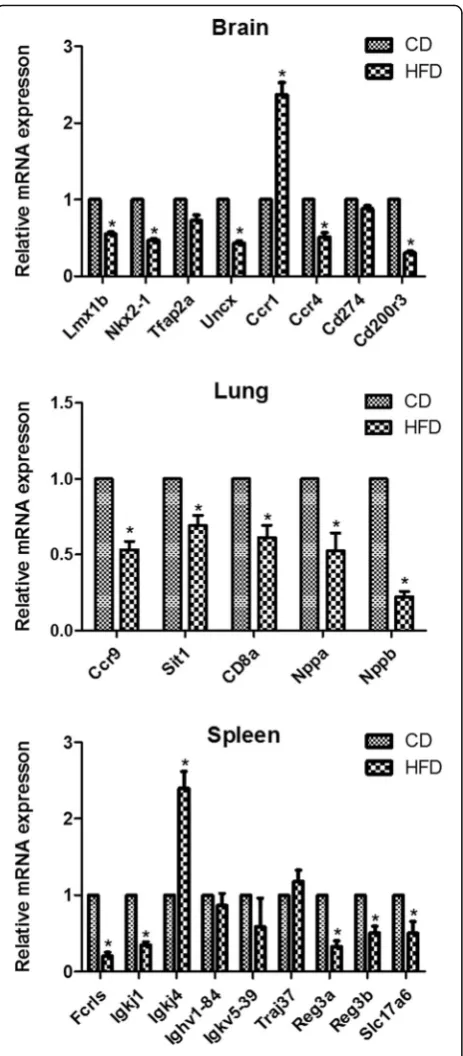
Verification of RNA-seq data
qRT-PCR was used to validate the expression levels measured by RNA-seq for 22 selected genes (8 genes in the brain, 9 genes in the spleen and 5 genes in the lung) from the list of differently expressed genes. As demon-strated in Fig. 4, qRT-PCR showed significant alterations in the expression of the 17 genes in correspondence with the findings from the RNA-sequencing analysis, while no obvious differential expression was detected for the 5 genes of Trap2a, Cd274, Ighv1-84, Igkv5-39 and Traj37 by qRT-PCR.
Table 3Differentially expressed genes in the brain of HFD-fed mice(Continued)
Pou2f3-rs1 −6.02 0.033 Gm12496 −2.91 0.013 RP24-369 J17.1 −6.39 0.016
Psg28 −1.83 0.042 Gm12652 −6.28 0.016 RP24-446E18.2 −6.02 0.033
Rbp2 −3.72 0.018 Gm13086 −2.34 0.023 RP24-482E11.1 −5.87 0.048
Rdh19 −6.28 0.016 Gm13465 −2.54 0.033 RP24-72B9.10 −6.02 0.033
Rhox8 −6.15 0.023 Gm13691 −6.28 0.016
Serpina10 −4.52 0.002 Gm13961 −5.87 0.048
FCfold change
Discussion
Consistent with previous reports [6, 16], our results showed that the consumption of a high-fat diet for 3 days significantly increased plasma glucose level. The high-fat diet also increased plasma cholesterol and HDL choles-terol concentrations. Plasma triglycerides concentration decreased significantly after short-term high-fat feeding. Indeed, decreased triglycerides level was previously re-ported as early as 3 days after beginning a high-fat diet in a study that involved mice fed a chronic high-fat diet [17]. A randomized, double-blind, crossover study in 12 healthy subjects reported that plasma triglycerides con-centration was significantly lower after a 3-d high-fat Table 4Differentially expressed genes in the spleen of HFD-fed mice
Gene symbol Log2FC P- value Gene symbol Log2FC P- value
Acr −6.09 0.033 5330434G04Rik −5.77 0.048
Ccdc38 −6.09 0.033 5730596B20Rik −5.77 0.048
Cngb3 −5.77 0.048 AY036118 −6.09 0.033
Fau-ps2 2.73 0.027 BC061212 −3.01 0.046
Fcrls −6.22 0.023 BC068157 5.92 0.048
Folr2 −6.22 0.023 D830025C05Rik −5.94 0.033
Frmpd4 −6.35 0.016 Gm10071 −5.77 0.048
Hs3st5 −5.77 0.048 Gm11455 2.26 0.047
Ighv1-84 −3.54 2.38E-04 Gm11800 −3.62 0.010
Igkj1 −5.77 0.048 Gm11957 6.33 0.023
Igkj4 3.06 0.021 Gm12763 −2.40 0.034
Igkv5-39 −1.85 0.034 Gm13483 −3.01 0.046
Lnx1 −5.94 0.033 Gm14444 −6.09 0.033
Lrrc7 −2.83 0.046 Gm15302 −6.22 0.023
Mcpt4 −3.01 0.046 Gm15785 −5.94 0.033
mt-Tm −5.77 0.048 Gm17305 −5.94 0.033
Nek10 −5.94 0.033 Gm20544 −3.01 0.046
Palm2Akap2 −3.21 0.027 Gm21719 −3.30 0.027
Pcdhb10 −6.09 0.033 Gm2237 −5.94 0.033
Reg2 −3.33 2.65E-04 Gm24436 6.33 0.023
Reg3a −4.03 1.50E-04 Gm25153 2.80 0.035
Reg3b −3.02 0.001 Gm25931 2.65 0.046
Rpl9-ps3 −5.94 0.033 Gm26619 −2.95 0.008
Slc17a6 −5.77 0.048 Gm26807 −6.09 0.033
St6gal2 −5.77 0.048 Gm26825 −2.37 0.029
Tceal3 −3.01 0.046 Gm6136 −6.22 0.023
Tpd52l1 −5.77 0.048 Gm6612 2.65 0.046
Traj37 6.14 0.033 RP23-446G23.1 2.80 0.035
Vat1l −3.01 0.046 RP24-369 J17.1 −2.89 0.039
Zfp42 −5.77 0.048 RP24-44H8.4 −2.86 0.011
1700095A21Rik −5.94 0.033
FCfold change
Table 5Differentially expressed genes in the lung of HFD-fed mice
Gene symbol Log2FC P- value Gene symbol Log2FC P- value
Abcc6 5.72 0.048 Satb1 −1.99 0.022
Arpp21 −5.29 7.83E-07 Scn1a −2.97 0.042
Arsi −2.28 0.034 Sit1 −2.35 0.023
Bmp10 −4.72 4.94E-06 Skint10 −5.96 0.033
Cartpt −5.96 0.033 Spo11 −3.46 0.001
Casp14 −5.96 0.033 St18 5.72 0.048
Ccr9 −2.66 0.004 Syt13 −2.12 0.039
Cd8a −1.98 0.025 Syt2 −3.54 0.035
Cdca5 −2.28 0.036 Tdrd5 −2.93 0.006
Chrna9 −4.53 0.003 Tgm5 −2.78 0.039
Crisp1 −1.87 0.040 Themis −2.26 0.010
Dntt −7.36 2.18E-09 Tnni1 6.36 0.016
Elovl3 −1.96 0.036 Trbc1 −1.97 0.025
Epyc −6.15 0.023 Trbv17 −6.32 0.016
Gucy2g 5.91 0.048 Trbv4 −3.66 0.027
Hist1h1a −1.88 0.034 Trim10 1.90 0.040
Ighe 5.72 0.048 Tube1 −1.96 0.050
Ighg1 2.59 0.011 Ubd −3.06 0.017
Ighv11-1 −2.90 0.002 Vmn2r96 −3.54 0.035
Ighv11-2 −3.20 0.001 Xkrx −2.35 0.008
Ighv12-3 −3.46 0.001 Xlr5a 5.72 0.048
Ighv1-53 1.92 0.046 Zan 3.20 0.046
Ighv1-54 2.42 0.031 1600029O15Rik 5.91 0.048
Ighv1-84 −2.28 0.036 4930455G09Rik −3.66 0.027
Ighv7-3 −2.04 0.041 9330132A10Rik 6.07 0.033
Ighv7-4 −6.47 0.012 BB031773 −7.46 0.001
Igkv14-126 −2.80 0.002 BC028471 −2.85 0.027
Igkv1-99 6.89 0.004 BC065403 −5.96 0.033
Igkv3-2 1.95 0.039 Gm10489 5.72 0.048
Igkv4-91 −2.95 0.002 Gm10715 5.91 0.048
Insc 5.91 0.048 Gm10717 1.74 0.045
Lctl 2.40 0.031 Gm10785 5.91 0.048
Lep 2.51 0.008 Gm13855 5.72 0.048
Lin28a 5.72 0.048 Gm15340 −6.47 0.012
Ltb4r1 2.93 0.022 Gm15405 −2.16 0.045
mt-Tt 6.22 0.023 Gm15576 −5.96 0.033
Nppa −2.96 0.001 Gm20438 5.91 0.048
Nppb −4.41 4.38E-05 Gm26202 6.07 0.033
Prom2 −2.66 0.031 Gm26316 5.72 0.048
Prss16 −9.54 4.44E-07 Gm26870 2.00 0.021
Rag1 −9.00 2.01E-12 RP23-230A14.1 5.72 0.048
Rag2 −4.30 3.9E-04
diet [18]. The low plasma triglycerides could be due to increased liver triglyceride content, possibly resulting in triglycerides being stored in the liver [19].
To our knowledge, we first reported that 3 days of high-fat feeding can induce exercise performance
decrease in mice prior to substantial weight gain. In con-trast to previous studies which conducted microarray analysis in a single tissue [6–9], we used RNA-seq to in-vestigate the global gene expression profiles of ten tis-sues in the early response to fat intake. Interestingly, our study showed that differential gene expression patterns existed in the ten tissues. Previous researches on the ef-fect of HFD mainly focused on the liver, skeletal muscle, intestine and heart, which were thought to have signifi-cant responses to consumption of high fat diets. How-ever, in our results, the brain, spleen and lung were demonstrated to have more pronounced transcriptional changes than other tissues following 3 days of high-fat feeding. The simultaneous analysis of multi-tissues by RNA sequencing yielded information which had not been revealed by previous analyses of a single tissue.
In the brain of HFD-fed mice, dopamine neurons dif-ferentiation related genes including Lmx1b, Nkx2-1 and Uncx were found to be significantly down-regulated. Lmx1b, a key transcription factor for the specification of dopaminergic cell fate, has been reported to increase midbrain size and allocation of dopamine progenitors by promoting Wnt1/Wnt signaling [20]. Deficiency of
Nkx2-1 in mice would lead to a remarkable abnormality in the trajectory of the ascending dopamine pathway [21]. Uncx, also known as Uncx4.1, is involved in the de-velopment of midbrain dopaminergic neurons [22]. Therefore, the down-regulation of these genes may con-tribute to impaired exercise capacity, which is supported by the observation of a link between dopamine and levels of physical exercise [23]. Moreover, Lmx1b and Nkx2-1 were demonstrated to regulate the migration of the superficial dorsal horn neurons and interneurons to the striatum or cortex, respectively [24, 25]. The de-creased expression of the two genes suggested disturbed neuronal migration in HFD-fed mice, which may result in abnormal development of the nervous system. Inflam-mation is considered to be one of the important factors for deterioration of physical performance [26]. Similarly, our results also suggested that many immune-related genes were significantly altered in the brain of HFD-fed mice. Ccr1, which involved in the host response to path-ogens and several inflammatory conditions [27], were significantly up-regulated. On the other hand, Ccr4 and Cd200r3 showed decreased expression in HFD-fed mice. Ccr4 were found to be functionally expressed on periph-eral blood CD4+CD25+ regulatory T (Treg) cells [28]. CD200 imparts an immunoregulatory signal through the receptor for CD200, leading to the suppression of T-cell–mediated immune responses [29]. The up-regulation of Ccr1, coupled with the down-up-regulation of Ccr4 and Cd200r3, suggested the up-regulation of an in-flammatory response toward the high fat diet in the brain. Consistently, it was reported that consumption of
a HFD with 1 to 3 days induced hypothalamic inflamma-tory in both rats and mice [30]. However, the genes re-lated to hypothalamic inflammatory signaling in the above study were not found to be significantly altered in our results. This discrepancy may reflect a difference be-tween specific brain region and the whole brain.
The immune system has been considered to be af-fected by HFD exposure over a period of several weeks [31]. However, in the present study, we found that 3 days of HFD feeding had induced disturbed immune response in spleen, which is a major organ involved in B-cell mat-uration. Fcrls, which belongs to Fc receptor-like family possessing inhibitory and/or activating signaling motifs in B cell differentiation [32], were significantly down-regulated in response to HFD feeding. Similarly, micro-array profiling carried out by Cui et al. in the spleen of C57BL/6 mice fed on a HFD also showed a decreased expression of Fc receptor [33]. Meanwhile, we observed abnormal expression of a few genes involved in im-munoglobulin/B cell receptor signaling. Igkj4 showed significant up-regulation in HFD-fed mice, whereas the expression of Igkj1 were significantly decreased. Add-itionally, Reg3a and Reg3b, which play critical roles in acute-phase response [34, 35], were significantly down-regulated. The findings suggested that immune dysfunc-tion was implicated in the spleen in response to 3 days of HFD feeding. Interestingly, neurotransmitter uptake related genes were significantly changed, such as solute carrier family 17 (sodium-dependent inorganic phos-phate cotransporter), member 6(Slc17a6) which plays a key role in the transport of glutamate into synaptic vesi-cles before exocytotic release and the regulation of glu-tamate signaling [36].
Evidence has increasingly shown that a HFD regarded as a primary cause for numerous diseases including dia-betes, hypertension, and steatohepatitis. However, few studies have been carried out to examine the effect of a HFD on the lung. To our surprise, the PCA results showed pronounced transcriptional changes in the lung and this is the first report to investigate the lung transcrip-tome profile after 3 days of HFD feeding. As the lung is a major site of immune regulation, our results revealed that many immune-related genes were significantly altered. Chemokine receptor Ccr9, which have proved to be im-portant in the Treg cells mediated self-tolerance [37], was markedly down-regulated in HFD-fed mice. Sit1, a critical negative regulator of TCR-mediated signaling [38], showed significant down-regulation as well. The decreased expression of Ccr9 and Sit1 suggested an activated inflam-matory response affected by HFD in the lung, which was in agreement with the previous study of the involvement of a HFD on lung inflammation [39]. In addition, we dis-covered decreased expression of CD8a in HFD-fed mice, which is important in cell-mediated immune defense and
T-cell development [40]. Moreover, genes involved in T cell receptor signaling and immunoglobulin/ B cell recep-tor signaling were found to be significant altered. This study also revealed that circulatory system related genes were down-regulated by HFD in the lung. Nppa and Nppb are the precursor of atrial natriuretic peptide (ANP) and b-type natriuretic peptide (BNP), which have important physiological functions in the regulation of vascular tone and plasma volume [41]. ANP exhibits a protective role in the lung function in acute lung injury apart from its vaso-dilatory and natriuretic effects [42]. Intake of a HFD had been proved to make a slower pulmonary O2uptake kin-etics and attenuate microvascular blood flow and O2 deliv-ery during the transition to moderate intensity exercise [43]. Therefore, we speculated that the decreased expres-sion of Nppa and Nppb may contribute to the impaired exercise capacity in HFD-fed mice.
Conclusions
The simultaneous analysis of ten tissues following 3 days of high-fat feeding by RNA-seq technology revealed that the brain, spleen and lung had more pronounced tran-scriptional changes than other tissues. Dysregulation of peripheral and central immune response had been impli-cated in the early stage of the response to HFD expos-ure. Neurotransmission-related genes and circulatory system process related genes were markedly down-regulated in the brain and lung, respectively. These find-ings provide new insights for the deleterious effects of a HFD and contribute to the understanding of molecular mechanisms of exercise performance decrease induced by short-term high-fat feeding.
Additional files
Additional file 1: Table S1.List of Primer sequences used for qRT-PCR. (DOC 57 kb)
Additional file 2: Table S2.Plasma biochemical parameters of CD-fed and HFD-fed mice. (DOCX 21 kb)
Abbreviations
ALB:Albumin; ALP: Alkaline phosphatase; ALT: Alanine aminotransferase; ANP: Atrial natriuretic peptide; ApoE: Apolipoprotein E; AST: Aspartate aminotransferase; BNP: b-type natriuretic peptide; Ca: Calcium; CD: Control diet; CK: Creatine kinase; Cl: Chlorine; CPM: Counts per million; Cr: Creatinine; CRP: C-reactive protein; CysC: Cystatin C; DBIL: Direct bilirubin;
DEGs: Differentially expressed genes; HBDH: A-hydroxybutyric acid dehydrogenase; HCY: Homocysteine; HDL-C: High-density lipoprotein-cholesterol; HFD: High fat diet; IBIL: Indirect bilirubin; K: Potassium; LDH: Lactate dehydrogenas; LDL-C: Low-density lipoprotein-cholesterol; MAS: Molecule annotation system; Na: Sodium; PCA: Principle component analysis; RNA-seq: RNA sequencing; RPKM: Reads Per Kilobase of exon model per Million mapped reads; SOD: Superoxide dismutase; TBA: Total bile acid; TBIL: Total bilirubin; TP: Total protein; Treg: Regulatory T; UA: Uric acid
Acknowledgements
Funding
This work was supported by the National Science Foundation of China (Nos. 81373707, 81403447 and 81603520), the Natural Science Foundation of Guangdong Province, China (Nos. 2014A030313292, 2014A030310072 and 2016A030310084), the Science & Technical Plan of Guangzhou, Guangdong, China (No. 2014Y2-00504), the Administration of Traditional Medicine of Guangdong province (No. 20161063), the Fundamental Research Funds for the Central Universities (No. 21616315) and the Special Funds for the Cultiva-tion of Guangdong College Students Scientific and Technological InnovaCultiva-tion (No. pdjh2016b0093).
Availability of data and materials
All data generated or analysed during this study are included in this published article and its Additional file 1: Table S1 and Additional file 2: Table S2.
Authors’contributions
XZ and YL conceived and designed the experiments. YX, WW, JC and PJ acquired the data. XF, XN and LC analyzed and interpreted the data. YX, WW and LC drafted the manuscript. XZ and HK revised the manuscript for important intellectual content. XZ and YL supervised the study. All authors were involved in the formulation of the research questions. All authors read and approved the final manuscript.
Competing interests
The authors declare that they have no competing interests.
Consent for publication
Not applicable.
Ethics approval
Animal experiments were approved by the Animal Care and Use Committee of Southern Medical University (Approval No.2013027).
Author details
1Department of Traditional Chinese Medicine, School of Medicine, Jinan
University, Guangzhou, China.2School of Traditional Chinese Medicine,
Southern Medical University, Guangzhou, China.3Experimental Animal Center, Southern Medical University, Guangzhou, China.4School of Chinese
Medicine, Hong Kong Baptist University, Hong Kong, China.
Received: 14 July 2016 Accepted: 25 January 2017
References
1. Riccardi G, Giacco R, Rivellese AA. Dietary fat, insulin sensitivity and the metabolic syndrome. Clin Nutr. 2004;23:447–56.
2. Miller WC, Bryce GR, Conlee RK. Adaptations to a high-fat diet that increase exercise endurance in male rats. J Appl Physiol Respir Environ Exerc Physiol. 1984;56:78–83.
3. Simi B, Sempore B, Mayet MH, Favier RJ. Additive effects of training and high-fat diet on energy metabolism during exercise. J Appl Physiol. 1991;71:197–203. 4. Lapachet RA, Miller WC, Arnall DA. Body fat and exercise endurance in
trained rats adapted to a high-fat and/or high-carbohydrate diet. J Appl Physiol. 1996;80:1173–9.
5. Murray AJ, Knight NS, Cochlin LE, McAleese S, Deacon RM, Rawlins JN, et al. Deterioration of physical performance and cognitive function in rats with short-term high-fat feeding. FASEB J. 2009;23:4353–60.
6. De Giorgio MR, Yoshioka M, St-Amand J. Feeding induced changes in the hypothalamic transcriptome. Clin Chim Acta. 2009;406:103–7.
7. Yoshioka M, Bolduc C, Raymond V, St-Amand J. High-fat meal-induced changes in the duodenum mucosa transcriptome. Obesity (Silver Spring). 2008;16:2302–7.
8. de Wilde J, Mohren R, van den Berg S, Boekschoten M, Dijk KW, de Groot P, et al. Short-term high fat-feeding results in morphological and metabolic adaptations in the skeletal muscle of C57BL/6 J mice. Physiol Genomics. 2008;32:360–9.
9. Nishikawa S, Sugimoto J, Okada M, Sakairi T, Takagi S. Gene expression in livers of BALB/C and C57BL/6 J mice fed a high-fat diet. Toxicol Pathol. 2012;40:71–82.
10. HP T, Ariyurek Y, Thygesen HH, Vreugdenhil E, Vossen RH, de Menezes RX, et al. Deep sequencing-based expression analysis shows major advances in
robustness, resolution and inter-lab portability over five microarray platforms. Nucleic Acids Res. 2008;36:e141.
11. Wang SY, Huang WC, Liu CC, Wang MF, Ho CS, Huang WP, et al. Pumpkin (Cucurbita moschata) fruit extract improves physical fatigue and exercise performance in mice. Molecules. 2012;17:11864–76.
12. Wu RM, Sun YY, Zhou TT, Zhu ZY, Zhuang JJ, Tang X, et al. Arctigenin enhances swimming endurance of sedentary rats partially by regulation of antioxidant pathways. Acta Pharmacol Sin. 2014;35:1274–84.
13. Tan W, Yu KQ, Liu YY, Ouyang MZ, Yan MH, Luo R, et al. Anti-fatigue activity of polysaccharides extract from Radix Rehmanniae Preparata. Int J Biol Macromol. 2012;50:59–62.
14. Robinson MD, McCarthy DJ, Smyth GK. edger: a Bioconductor package for differential expression analysis of digital gene expression data.
Bioinformatics. 2010;26:139–40.
15. Wang L, Sun L, Huang J, Jiang M. Cyclin-dependent kinase inhibitor 3 (CDKN3) novel cell cycle computational network between human non-malignancy associated hepatitis/cirrhosis and hepatocellular carcinoma (HCC) transformation. Cell Prolif. 2011;44:291–9.
16. Lee YS, Li P, Huh JY, Hwang IJ, Lu M, Kim JI, et al. Inflammation is necessary for long-term but not short-term high-fat diet-induced insulin resistance. Diabetes. 2011;60:2474–83.
17. Petit V, Arnould L, Martin P, Monnot MC, Pineau T, Besnard P, et al. Chronic high-fat diet affects intestinal fat absorption and postprandial triglyceride levels in the mouse. J Lipid Res. 2007;48:278–87.
18. Tremblay AJ, Lamarche B, Guay V, Charest A, Lemelin V, Couture P. Short-term, high-fat diet increases the expression of key intestinal genes involved in lipoprotein metabolism in healthy men. Am J Clin Nutr. 2013;98:32–41.
19. Jin ES, Beddow SA, Malloy CR, Samuel VT. Hepatic glucose production pathways after three days of a high-fat diet. Metabolism. 2013;62:152–62. 20. Anderegg A, Lin HP, Chen JA, Caronia-Brown G, Cherepanova N, Yun B,
et al. An Lmx1b-miR135a2 regulatory circuit modulates Wnt1/Wnt signaling and determines the size of the midbrain dopaminergic progenitor pool. PLoS Genet. 2013;9:e1003973.
21. Kawano H, Horie M, Honma S, Kawamura K, Takeuchi K, Kimura S. Aberrant trajectory of ascending dopaminergic pathway in mice lacking Nkx2.1. Exp Neurol. 2003;182:103–12.
22. Rabe TI, Griesel G, Blanke S, Kispert A, Leitges M, van der Zwaag B, et al. The transcription factor Uncx4.1 acts in a short window of midbrain
dopaminergic neuron differentiation. Neural Dev. 2012;7:39.
23. Mathes WF, Nehrenberg DL, Gordon R, Hua K, Garland TJ, Pomp D, et al. Dopaminergic dysregulation in mice selectively bred for excessive exercise or obesity. Behav Brain Res. 2010;210:155–63.
24. Ding YQ, Yin J, Kania A, Zhao ZQ, Johnson RL, Chen ZF, et al. Lmx1b controls the differentiation and migration of the superficial dorsal horn neurons of the spinal cord. Development. 2004;131:3693–703. 25. Elias LA, Potter GB, Kriegstein AR. A time and a place for nkx2-1 in
interneuron specification and migration. Neuron. 2008;59:679–82. 26. Katafuchi T, Kondo T, Take S, Yoshimura M. Enhanced expression of brain
interferon-alpha and serotonin transporter in immunologically induced fatigue in rats. Eur J Neurosci. 2005;22:2817–26.
27. Rossi D, Zlotnik A. The biology of chemokines and their receptors. Annu Rev Immunol. 2000;18:217–42.
28. Iellem A, Mariani M, Lang R, Recalde H, Panina-Bordignon P, Sinigaglia F, et al. Unique chemotactic response profile and specific expression of chemokine receptors CCR4 and CCR8 by CD4(+)CD25(+) regulatory T cells. J Exp Med. 2001;194:847–53.
29. Rosenblum MD, Olasz E, Woodliff JE, Johnson BD, Konkol MC, Gerber KA, et al. CD200 is a novel p53-target gene involved in apoptosis-associated immune tolerance. Blood. 2004;103:2691–8.
30. Thaler JP, Yi CX, Schur EA, Guyenet SJ, Hwang BH, Dietrich MO, et al. Obesity is associated with hypothalamic injury in rodents and humans. J Clin Invest. 2012;122:153–62.
31. Miyazaki Y, Iwabuchi K, Iwata D, Miyazaki A, Kon Y, Niino M, et al. Effect of high fat diet on NKT cell function and NKT cell-mediated regulation of Th1 responses. Scand J Immunol. 2008;67:230–7.
32. Davis RS, Stephan RP, Chen CC, Dennis GJ, Cooper MD. Differential B cell expression of mouse Fc receptor homologs. Int Immunol. 2004;16:1343–53. 33. Cui J, Xiao Y, Shi YH, Wang B, Le GW. Lipoic acid attenuates
34. Wang L, Huang J, Jiang M, Lin H. Tissue-specific transplantation antigen P35B (TSTA3) immune response-mediated metabolism coupling cell cycle to postreplication repair network in no-tumor hepatitis/cirrhotic tissues (HBV or HCV infection) by biocomputation. Immunol Res. 2012;52:258–68. 35. van Ampting MT, Loonen LM, Schonewille AJ, Konings I, Vink C, Iovanna J,
Chamaillard M, et al. Intestinally secreted C-type lectin Reg3b attenuates salmonellosis but not listeriosis in mice. Infect Immun. 2012;80:1115–20. 36. Brumovsky P, Watanabe M, Hokfelt T. Expression of the vesicular glutamate
transporters-1 and−2 in adult mouse dorsal root ganglia and spinal cord and their regulation by nerve injury. Neuroscience. 2007;147:469–90. 37. Wermers JD, McNamee EN, Wurbel MA. The chemokine receptor CCR9 is
required for the T-cell-mediated regulation of chronic ileitis in mice. Gastroenterology. 2011;140:1526–35.
38. Arndt B, Krieger T, Kalinski T, Thielitz A, Reinhold D, Roessner A, et al. The transmembrane adaptor protein SIT inhibits TCR-mediated signaling. PLoS One. 2011;6:e23761.
39. Naura AS, Hans CP, Zerfaoui M, Errami Y, Ju J, Kim H, et al. High-fat diet induces lung remodeling in ApoE-deficient mice: an association with an increase in circulatory and lung inflammatory factors. Lab Invest. 2009;89:1243–51. 40. Xu SW, Wu JY, Hu KS, Ping HL, Duan ZG, Zhang HF. Molecular cloning and
expression of orange-spotted grouper (Epinephelus coioides) CD8alpha and CD8 beta genes. Fish Shellfish Immunol. 2011;30:600–8.
41. Baxter GF. Natriuretic peptides and myocardial ischaemia. Basic Res Cardiol. 2004;99:90–3.
42. Mitaka C, Hirata Y, Nagura T, Tsunoda Y, Amaha K. Beneficial effect of atrial natriuretic peptide on pulmonary gas exchange in patients with acute lung injury. Chest. 1998;114:223–8.
43. Raper JA, Love LK, Paterson DH, Peters SJ, Heigenhauser GJ, Kowalchuk JM. Effect of high-fat and high-carbohydrate diets on pulmonary O2 uptake kinetics during the transition to moderate-intensity exercise. J Appl Physiol. 2014;117:1371–9.
• We accept pre-submission inquiries
• Our selector tool helps you to find the most relevant journal
• We provide round the clock customer support
• Convenient online submission
• Thorough peer review
• Inclusion in PubMed and all major indexing services
• Maximum visibility for your research
Submit your manuscript at www.biomedcentral.com/submit