An Exploratory Study
Of Student Satisfaction
With University Web Page Design
David E. Gundersen, Ph.D., Stephen F. Austin State University, USAJoe K. Ballenger, Ph.D., Stephen F. Austin State University, USA Robert M. Crocker, Ph.D., Stephen F. Austin State University, USA
Elton L. Scifres, Ph.D., Stephen F. Austin State University, USA Robert Strader, Ph.D., Stephen F. Austin State University, USA
ABSTRACT
This exploratory study evaluates the satisfaction of students with a web-based information system at a medium-sized regional university. The analysis provides a process for simplifying data interpretation in captured student user feedback. Findings indicate that student classifications, as measured by demographic and other factors, determine satisfaction levels towards various web sources of information. Differences in satisfaction levels across student groups based on gender, age, minority status, employment, and current course load were found. Implications for university web designers and university administrators are considered and discussed.
Keywords: Web Design; University Web Design; Web Design Satisfaction
INTRODUCTION
roviding web-based information to students, prospective students, alumni, and other interested parties is standard practice for universities. These institutions create web-based content designed to facilitate the goals pursued by their constituents where their purposes can vary significantly. Simultaneously, universities should be designing web-based content that projects an enhanced image, creates attraction from potential students, and helps maintain the relationships with those already attached to the institution. Despite the importance of designing effective web-based content in an appealing sophisticated user interface, measuring the effectiveness of the web-based effort in terms of user perceptions are infrequently conducted. Notwithstanding this lack of user assessment, most universities revamp their web-based systems on an ongoing basis based on some organizational review that determines that a more effective approach is needed or as institutional information changes.
This study investigates the perceptions of student users to a university web-based informational system. Using student perceptions as data sources provides a realistic basis for assessing the satisfaction these users have with the web-based informational dissemination system. Using the format of this investigation, actual users are given the opportunity to rate their satisfaction level to a variety of university web pages and the links that provide the information. Student perceptions of the web system they use provide web designers and administrators with the opportunity to refine, modify, and adjust their system based upon the characteristics of the students who use it. The primary benefit of using this approach to analyzing a specific web-based system is that it provides universities with an introspective look at how satisfied student users are with the web system that is currently in place. An additional benefit is to be able to generalize the satisfaction levels prospective students have if they share characteristics with the current student population. In fact this generalization could be used beyond students and prospective students including other stakeholders which share similar student. Finally, the analysis used in this study provides for a simplified process for condensing captured questionnaire data from factors derived from this study. This process allows university web-designers and administrators the ability to collect information from student satisfaction ratings and to adjust their web offerings as they deem appropriate.
The structure of this paper is as follows. First a review of the literature will be conducted. The review will include investigating higher educational institution writings that focus on assessing or analyzing user perceptions of web-based content offered by universities. With so little research investigating user feedback of higher educational web-based content, a review of corporate user web-based content analysis will also be considered. Providing a review from the corporate perspective gives readers a comparative view regarding user perceptions of web-based content between higher educational institutions and the corporate sector. This allows readers to discard the simplified notion that universities should do what corporations do. As you will soon see, user perceptions of web-based content are largely ignored in the literature. Consequently, a theoretical framework for analyzing educational web-based content will be presented identifying key constituents that should allow for feedback from users. The method for this study will then be presented followed by the results and discussion.
LITERATURE
Academic Institution Web-System Analysis
In academia, interactive web-based technology provides students access to university information. Key functions available to students or prospective students include the application process, financial aid, course scheduling, course registration, links to academic departments and other university information. Other stakeholders also access university web systems for purposes such as athletic information, university sponsored events for the larger public, and foundation endowment and charitable giving. This information needs to be easily accessible and presented in an intuitive way. Unfortunately, many of these web-based functions have not been carefully considered or constructed from a user’s perspective nor is there any guidance from a theoretical perspective which assists in the development of these web-based systems (Schwandt-Arbogast. 2005).
The migration of university functions to the internet has frequently been based on a review of what other universities have done and to copy those institutions after minor modifications (M. Turnage, personal communication. October 2, 2010). More thorough analysis is mostly absent in academia and little is based on user data. A study done at a Korean university found that the student user expects (the overall information system) of a university to provide information that is accurate, timely, in a useful format, and of up-to-date content. The students also want the system to be friendly enough to cause little stress when using it (Lee and Kim, 2010). In the library domain, Welch (2005) surveyed 106 academic institutions for marketing and public relations considerations finding that more than 80% had home-page links to the university library. These direct links were shown to enhance the library as an integral function of the university underscoring the academic purpose of the institution. Other studies have also focused on web-based library access and usability (Dewey, 1999; Tolppanen, Miller, Wooden, & Tolppanen, 2005; Harpel-Burke, 2006). These studies showed that web links to library sources had positive reputational effects for both the library and the institution. A more general university evaluation of web-based technology by Poock & Bishop (2006) established the importance of the internet in college and university marketing. They showed that using web pages has become a common way of providing information to students where a variety of services can be promoted. Despite these investigations, student perceptions and reactions to web-based content has largely been ignored.
Corporate Web-System Analysis
The corporate sector assessment of web communications is not just a United States phenomenon. Alwahaishi, Snášel and Nehari-Talet (2009) investigated an airline attempting to stimulate customers as they shift from traditional ticket distribution channels to online channels in the airline industry. Again, the results are to influence customers rather than to assess their reaction to the web page content provided. Cho and Cheon (2005) analyzed web-based communications comparing interactivity between Japanese and American corporate websites. Results indicated that U. S. sites emphasized customer messages and customer advertising while Japanese sites promoted customer to customer communications. No user data was used in the analysis. Content analysis was the focus of another study on Chinese corporate web offerings where publicity was found to be the major goal of the system (XI, Zhuang, Huang & Zhang, 2007). The basis of data collection and analysis was a review of the corporate websites where information was categorized into classes of content. Website users were not incorporated into their investigation.
THEORY DEVELOPMENT
Surprisingly, the literature investigating university web-page development is essentially void regarding the use of student feedback and student satisfaction. As presented above, corporate web-page development cannot be used to fill the gap. So, the question has to become a theory development exercise. Why measure user satisfaction?
One goal of any higher educational institution has to be to create student or potential student satisfaction or satisfaction among other interested stakeholders. The number or percentage of students who report favorable experiences with the institution should exceed specified satisfaction goals assuming the university has conducted such analysis. Much of the information influencing satisfaction from these populations is presented through the institution’s web-based system. Educational institutions that have not garnered user feedback miss out on establishing such goals. This has the potential of leading to lower enrollments and lost student loyalty. Conversely, if a university gains loyalty, it gains positive word-of-mouth marketing which is both free and highly effective (Farris, Bendle, Pfeifer, & Reibstein, 2010).
From an interactive marketing perspective, the user web experience is defined as the sum total of the interactions that a user has with the website from the initial look at a home page through the entire process of purchase decision elements and other informational uses (Kim, 2010). In short, student satisfaction has a rather direct relationship impacting the institution where interactive communication is facilitated through the web-based university system. Sometimes the web-based information is the only outward sign of the organization. If these first impressions are not good, the user may not see any of the rest of what the organization has to offer due to leaving the system (Chen and Xie, 2008).
It must be understood that the university web-site is part of the institution’s promotion mix that attempts to communicate with the relevant consumer or market segment. The organization is attempting to “tell its story”, and in doing this, feedback from users is needed so as to determine what was communicated and was the information viewed as favorable or not so favorable. It also allows the organization to alter the message and make improvements if need be.
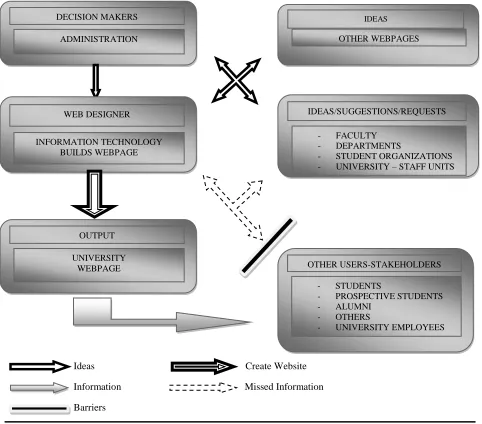
Figure 1 provides a graphic view of the paradigm on how web-based information systems are created and shows shortcomings in most current systems. The administration of the university makes decisions regarding how the web-based system should look and what information should be presented. Administrators receive ideas from various sources including academic units where colleges, departments and faculty have the opportunity to influence content. Student organizations also have the opportunity to provide ideas that they hope will be included in the web-based system. Additionally, other units providing ideas likely include staff units such as admissions, financial aid, housing, parking, endowment, and athletics. In terms of informational content, all ideas are filtered through administration and the resulting web-based interface of the university should include the necessary information that interested constituencies require.
UNIVERSITY WEBPAGE
OUTPUT
Features introduced at one institution frequently become standard at other universities in a relatively short period of time (Turnage, 2010). The resulting web-based system should ideally include all needed informational resources in a design that is user friendly. In short, it should meet user wants and needs where users have satisfaction with the system.
In reviewing the web-page development paradigm, it quickly becomes obvious that feedback from a most important source is neglected. As pointed out in the literature, user feedback, those stakeholders whom the system is primarily designed for, are typically not consulted in terms of how they feel about the system. Informational content and design considerations that are created specifically for them are represented without any input from them. Some stakeholders have no choice (i.e. university employees) and must simply muddle through to complete what needs to be done. For others, however, frustration with the system may result in terminated sessions where prospective students or financial contributions are lost. Most of us who have used a web-based university system have experienced frustration in finding content efficiently and we view some web-based systems as simply painful to use. Without this feedback from users, administration will not know whether their web-based system is viewed favorably or not.
Ideas Create Website Information Missed Information Barriers
Figure 1
Web-Page Development Paradigm
ADMINISTRATION DECISION MAKERS
OTHER WEBPAGES
IDEAS
- FACULTY - DEPARTMENTS
- STUDENT ORGANIZATIONS - UNIVERSITY – STAFF UNITS IDEAS/SUGGESTIONS/REQUESTS
INFORMATION TECHNOLOGY BUILDS WEBPAGE
WEB DESIGNER
- STUDENTS
- PROSPECTIVE STUDENTS - ALUMNI
- OTHERS
This research is designed to capture student user feedback regarding one university’s web-based information system and to show how it can be used to tailor web-based offerings. Satisfaction responses from current students were analyzed and differences in satisfaction levels based on student characteristics were determined. It is understood that current students are but only one set of users and that data from others will be needed for future research. It is necessary to include user perceptions for web-system development, and using current students provides an example of how student satisfaction responses might influence what educational institutions offer. It is hoped that this example establishes how imperative it is to have user data used as an idea source if educational institutions are to enhance their web presence.
METHOD
Purpose
As stated previously, the purpose of the study is to capture information from student users of a particular university web-based information system. This information will measure satisfaction levels of users and to discern whether differences exist between user groups across items. Data reduction using factor analysis is employed to help simplify the investigation and improve the analysis and discussion. It is hoped that this exploratory study will initiate the use of feedback from users by university administrators and web designers as they change and modify university web-based information systems.
Participants
Participants in this study were 56 undergraduate students enrolled in a midsize regional university. The participants were selected from a convenience sample based on enrollments in business and computer science undergraduate classes. All students were either juniors or seniors as required for enrollment in the participating classes. Self-reported demographic and grade information was gathered on the 56 participants. Gender classifications indicate that 30 were male and 26 were female. Their mean age was 23.7 years where the oldest was 46 and the youngest was 19. The mean grade point average was 2.72 ranging from a low of 1.80 to a perfect 4.00. Ethnicity classifications identified 16 as minority and 40 as not-minority. Of the total respondent group, 37 were working while 19 were not. Degree major designations indicated that 40 were business related while 16 were in disciplines other than business. Students ranged from first semester juniors to graduating seniors.
Questionnaire and Data Collection
The instrument used to collect the data included two distinct sections. The first section asked respondents personal information including demographic classifications (as identified above), employment status, semester hours earned to date, semester hours currently being taken, grade point average, and major. The second section included items regarding reactions to web pages. These items were selected after a review of pertinent literature on analyzing and rating web pages. Following a review of the literature, items were constructed and oriented to users who would access university web sites for varied academic-related purposes. The instrument was further reviewed by experts in the fields of computer science and management where items were deleted and refined to establish content validity. The final instrument contained a total of 39 items with 13 items in first section and 26 items in the second section. The questionnaire can be viewed in Appendix A.
Procedure
Measures
Dependent Measures. As discussed in the procedure section, respondents rated 26 items regarding specific content found on web pages within the university web system. These items were analyzed using factor analysis for data reduction purposes and to help simplify further analyses (Hair, Black, Babin, Anderson & Tatham, 2006). The factor analysis procedure is discussed in the following section.
Factor Analysis. A principle components analysis was conducted to identify underlying dimensions of the items to capture satisfaction accessing university functions via the web-based information system. To assess the appropriateness of the data for factor analysis, several key statistics were examined according to the procedure recommended by Hair, et al, (2006). First, a review of the commonalities derived from the factor analysis was conducted. These were all relatively large, with none less than the .6 level, suggesting the data set is appropriate (Stewart, 1981). Next, the Kaiser-Meyer-Olkin (KMO) measure of sampling adequacy was computed. Based on Kaiser and Rice’s (1974) evaluative criteria, the result of .763 is considered acceptable. Finally, the statistic for Bartlett’s (1950) sphericity test was 400.726 (p<.000) indicating further that the population of variables are independent and appropriate for factor analysis. From the above procedures, the data set is appropriate for factor analysis.
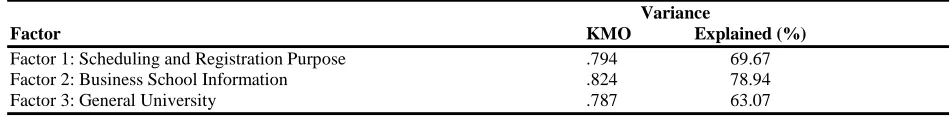
The factor structure extracted three distinct dimensions representing the questionnaire items that are presented under the factor labels provided in Table 1. As seen in the table, the factor labels were 1) Scheduling and Registration Purpose, 2) Business School Information, and 3) General University Information. The reliability of the factors reflecting consistency of measurement was established using several procedures recommended by Hair, et al, (2006). First, the scree plot technique was used to identify three separate and distinct factors. These factors were further supported in that eigenvalues for each were greater than one. Several items had low loadings across all factors indicating a lack of fit with the factor structure. These items were systematically removed following a procedure prescribed by Comrey (1973). The loadings of the included items were all above 0.60 with an average loading of 0.80. Twelve of the 13 included items had more than 50% of their variance explained by their respective factor (loadings of .71 or more).
Table 1
Factor Analysis of Web-Page Access
Cronbach Items Loadings alpha
Factor 1: Scheduling and Registration Purpose .8911
Usability of course schedule for course planning. .873
Organization of course schedule. .842
Link to course schedule. .835
Link to registration of classes. .803
Registration information quality and ease to use. .797
Factor 2: Business School Information .9109
Information coverage on Business School. .869
Ease of finding information on the Business School. .867
Department information in the Business School. .856
Ease finding department information in the Business School. .856
Factor 3: General University Information .8046
Organization of information about the university. .817
General coverage of university information. .722
Overall satisfaction with university-web system. .717
Overall quality with university-web system. .609
Finally, several assessments were conducted to determine the construct validity of the satisfaction of the web-page access factors. An individual principle components analysis was conducted on individual factors to determine if its set of variables would form a single factor independent of other variables (Nunnally, 1978). The three factors were shown to be unifactorial offering support that each was a valid construct. Also used to provide support was the KMO measure of sampling adequacy providing evidence that the data for each unifactorial determination was appropriate. The KMO values were acceptable according to the evaluative criteria provided by Kaiser and Rice (1974). Table 2 shows the unifactorial test results supporting the construct validation of the web-page access factors. Also included is the proportion of variance explained by the factor out of the total variance from the items comprising the factor.
Table 2
Unifactorial Tests for Web-Page Access
Variance
Factor KMO Explained (%)
Factor 1: Scheduling and Registration Purpose .794 69.67 Factor 2: Business School Information .824 78.94
Factor 3: General University .787 63.07
Results indicate that established factors explain more than 60% of the total amount of variance from their respective data sets. A relatively small amount of variance is associated with other causes. The unifactorial tests provide adequate support for the construct validity of each factor (Black & Porter, 1996). Establishing construct validity beyond this would require new data to confirm the existing factors (Cattell, 1978). As mentioned earlier, 13 items are reduced to 3 for data reduction and simplification purposes allowing summarization of the data captured by the questionnaire for use in further analyses.
Categorical Predictor Variables. An investigation of the web-page access satisfaction items influenced by categorical predictor variables were analyzed using Analysis of Variance (ANOVA). The variables included demographic items such as gender, minority status and employment status. Respondent major was also considered here as either business related or not.
Metric Level Predictor Variables. Correlations were used to determine whether associations existed between web-page satisfaction variables and metric level predictor variables. The predictor variables included semester hours in the current semester, semester hours earned to date, grade point average, hours worked per week if working, and age.
The predictor metric level variables used in the correlation analysis described earlier were further analyzed where significant associations with web-page satisfaction variables were determined. Using regression provides a more robust analysis where a dependence condition can be identified (Hair, et al, 2006). In this analysis, a determination was made on which variables with significant associations using the correlation coefficient actually are predictors of the association.
RESULTS AND DISCUSSIONS
Categorical Predictors
Table 3
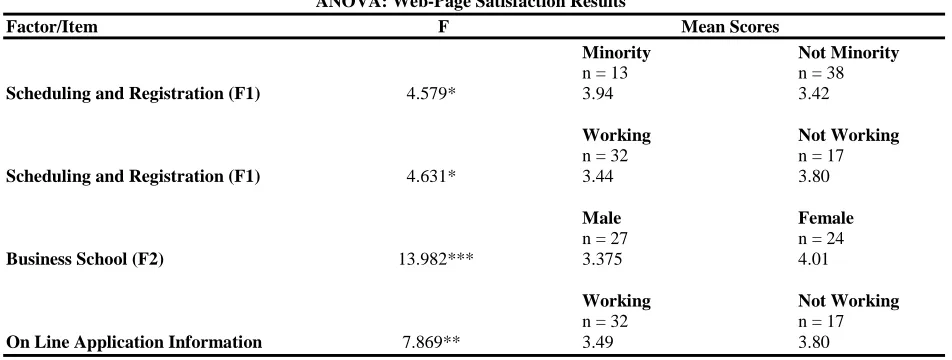
ANOVA: Web-Page Satisfaction Resultsa
Factor/Item F Mean Scores
Minority Not Minority
n = 13 n = 38
Scheduling and Registration (F1) 4.579* 3.94 3.42
Working Not Working
n = 32 n = 17
Scheduling and Registration (F1) 4.631* 3.44 3.80
Male Female
n = 27 n = 24
Business School (F2) 13.982*** 3.375 4.01
Working Not Working
n = 32 n = 17
On Line Application Information 7.869** 3.49 3.80
* p ≤ .05; ** p ≤ .01; *** p ≤ .001
a
Scale: 1 = Extreme Dissatisfaction; 5 = Extreme Satisfaction
As seen in the Table 3, minority students were more satisfied with their web-page access for Factor 1 (Scheduling and Registration Purposes) compared to students that were not classified as minority (F=4.579, p ≤ .05). Interpretation of results is speculative due to the exploratory nature of the investigation. Individual items that make up the factor might trigger satisfaction due to ethnic and cultural sensitivity. Another explanation might be that these groups vary historically on their general access to web content (Attawell, 2001). Much has been made about the digital divide where minorities lack the broadband access relative to their non-minority counterparts. Minorities might be more satisfied just to have it where non-minorities may have become more discriminating. These web-item cues require more investigation to add to the literature on what influences web satisfaction across racial and ethnic groups.
Factor 1 (Scheduling and Registration Purposes) was also influenced by whether respondents were working or not (F=4.631, p ≤ .05). Those individuals who were working were less satisfied compared to their non-working counterparts. This finding may be a result of the time available for using information captured in this factor. Content providers should take note that web pages and interfaces that are less efficient or less intuitive for finding critical information for scheduling and registration make it harder for working students who have less time to address these tasks. Conversely, students not working may have more time to investigate and explore where a busier interface enhances their satisfaction levels.
Gender was also shown to be a predictor of one of the identified factors. Factor 2 (Business School Information) showed that females were more satisfied than males (F=13.982, p ≤ .001) when accessing information on the Business School. Historically, males dominated enrollments in majors such as management, marketing, accounting and finance and in graduate programs in the same fields. Data suggests that female interest as measured by enrollments in these majors increased in 2004 and continue to surge (U. S. Department of Education, 2004; U. S. Census Bureau, 2010). Perhaps this enthusiasm has a spillover effect in the satisfaction levels females have as they access web information related to business degrees including course availability and degree concentrations. Males have always viewed this as their domain and may be less satisfied as they peruse the same information.
Metric Predictors
The satisfaction of web-page items was also investigated by variables measured on a metric or numeric scale. Grade point average, age, hours of work if working, total semester hours earned to date, and semester hours currently being taken were analyzed as to their influence on the web- page access satisfaction. Correlation analysis was first used to target associations for further analysis. Where associations were found, further investigation using multiple regression analyses were used to better understand the relationships. These relationships are presented in Table 4 and will be presented next.
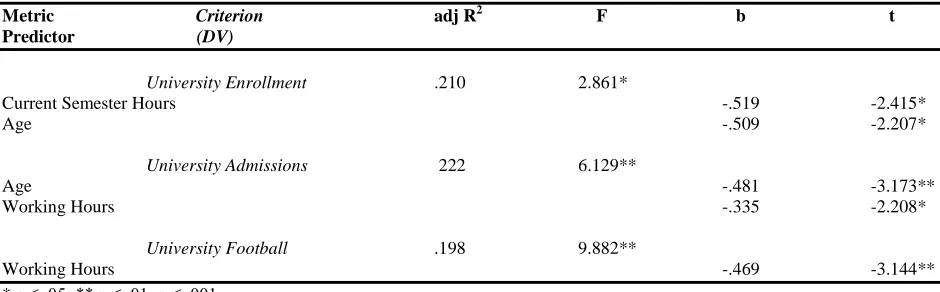
Two items, current semester hours and age influenced the satisfaction level of reviewing web-pages regarding university enrollment (F = 2.861, p ≤ .05) which is item 2 in Appendix A. Both current semester hours and age had inverse relationships with the satisfaction level of finding and reviewing information regarding university enrollment. First it must be noted that students were directed to investigate enrollment information. Results here could be generalized for students who are transferring between schools or going from two-year to four-year institutions. Consequently, an argument can be made that when students are taking more hours they are less satisfied with finding and using enrollment information. Simply put, they have less time due to heavier course loads which in turn reduces their level of satisfaction in accessing and using enrollment information sources. This should be an important point for university administrators who admit large numbers of transfer students.
Table 4
Regression Results for Metric Level Predictors Measuring Satisfaction of Web-Page Information Access
Metric Criterion adj R2 F b t
Predictor (DV)
University Enrollment .210 2.861*
Current Semester Hours -.519 -2.415* Age -.509 -2.207*
University Admissions 222 6.129**
Age -.481 -3.173**
Working Hours -.335 -2.208*
University Football .198 9.882**
Working Hours -.469 -3.144**
* p ≤ .05; ** p ≤ .01; p ≤ .001
Likewise, an inverse relationship exists where age influences satisfaction with enrollment web-page access and interpretation. Older respondents were less satisfied in fulfilling this task. Perhaps older students don’t like the thought of enrolling and are less satisfied in accessing this information. With some respondents in their 40’s, this might be a task they feel should have been completed years ago. Having to undertake this activity as a non-traditional older student might reduce their satisfaction compared to younger university students. Another explanation might be that older students have more difficulty finding and accessing this information due to being “Technology Challenged.” Are older students less web savvy? One would think this would show up in the results regularly if the web-savvy issue was true.
The criterion variable measuring the satisfaction of respondents finding information on university admissions (item 3 in Appendix A) was also influenced by two metric-level predictors, age and work hours (F = 6.129, p ≤ .01). These items, similar to results found for university enrollment, also had inverse relationships. Age was discussed in the previous paragraph and likewise, the “Technology Challenged” argument could be made here. So could the proposition that older respondents feel finding admission information is a younger age appropriate task and consequently feel less satisfied in pursuing this information.
university admissions web-based offerings. This might also be used to explain the final metric result showing more work hours reduces satisfaction in finding information regarding the university football program (F = 9.882, p ≤ .01) which is item 7 in Appendix A. Easy intuitive interfaces might well be worth developing if the target user is someone working large numbers of hours and has limited time to find tickets or review other information on athletics such as season schedules. This may also be true for alumni who are more likely to be working. If you count on ticket sales to alumni, take heed.
IMPLICATIONS AND CONCLUSIONS
University administrators and web designers are responsible for web-based informational communications and yet literature shows that feedback from users generally and student users specifically are neglected in the design of these systems. With student populations that differ widely across universities, no single web system fits the universal student. For universities with large numbers of working students, simple interfaces with concise informational presentations are preferred. Other student populations may prefer intricate web designs where more detail is incorporated into functions and processes requiring more concentrated efforts on behalf of the user. If potential target student populations have a preponderance of demographic characteristics, certain web-design qualities can improve their satisfaction. Understanding characteristics of the user may influence whether they apply, purchase athletic event tickets, or just go away.
Assessing students’ satisfaction with the current web-based system seems obvious. Yet, questionnaire design and analysis creates significant barriers to those who are most responsible for content and design. Consequently, the barriers hamper getting user feedback that provides results needed to improve a particular university web-based informational system. This undertaking can now be conducted and simplified for user satisfaction analysis. It seems apparent that feedback from users should be one basis for web-system design where the goals of a university web-based system have a better chance of being fulfilled.
AUTHOR INFORMATION
David E. Gundersen, Ph.D. is a Professor of Management at Stephen F. Austin State University in the Department of Management, Marketing, and International Business. He teaches a variety of management courses in human resource and his research focuses on technology influences in management. E-mail: [email protected] (Corresponding author)
Joe Ballenger, Ph.D. is an Associate Professor of Marketing at Stephen F. Austin State University in the Department of Management, Marketing, and International Business. He teaches a variety of marketing courses including principles, retailing, and marketing research. His research interests include retailing and technology influences on purchases and product dissonance.
Robert Mitchell Crocker, Ph.D. is the Management, Marketing, and International Business Department Chair in the Rusche College of Business at Stephen F. Austin State University in Nacogdoches, Texas. Employee relations and labor relations are both his teaching and research areas of interest.
Elton Scifres, Ph.D. is a professor of management at Stephen F. Austin State University. He received his Ph.D. in Strategic Management from Louisiana State University. His research interests include Strategic Planning in academic environments and Dynamic Capabilities.
Robert George Strader, Ph.D. is a professor of Computer Science at Stephen F. Austin State University. His research interests are in parallel and distributed processing, artificial intelligence, computer architecture, simulation, robotics, geographic information systems, networking, security, and computer science education.
REFERENCES
2. Attawell, P. (2001). First and second digital divides. Sociology of Education, 74 (3), 252-259.
3. Bartlett, M. S. (1950). Tests of significance in factor analysis. British Journal of Statistical Psychology, 3,
7-85.
4. Black, S. A., & Porter, L. J. (1996). Identification of critical factors in TQM. Decision Sciences, 27(1), 1-21.
5. Cattell, R. B. (1978). The scientific use of factor analysis in behavioral and life sciences. New York: Plenum.
6. Chen, Y. & Xie, J. (2008). Online consumer review: Word-of-mouth as a new element of marketing communication mix. Management Science, March, 477-491.
7. Cho, C. H., & Cheon, H. J. (2005). Interactivity on Japanese versus American corporate websites. Journal of International Consumer Marketing, 17(4), 41-63.
8. Comrey, A. L. (1973). A first course in factor analysis. New York: Academic Press.
9. Dewey, B. (1999). In search of services: Analyzing the findability of links on CIC University Libraries’ web pages. Information Technology and Libraries, 18(4), 210-213.
10. Ellinger, A. E., Lynch, D. F., Andzulis, J. K., & Smith, R. J. (2003). B to b e-commerce: A content analytical assessment of motor carrier websites. Journal of Business Logistics, 24(1), 199-220.
11. Farris, P. W., Bendle, N. T., Pfeifer, P. E., and Reibstein, D. J. (2010). Marketing metrics: The definitive guide to measuring marketing performance. Upper Saddle River, NJ: Pearson.
12. Hair, J. F., Black, W. C., Babib, B.J., Anderson, R. E., & Tatham, R. L. (2006). Multivariate data analysis. New York: Macmillan.
13. Kaiser, H. F., & Rice, J. (1974). Little jiffy mark IV. Educational and PsychologicalMeasurement, 34,
111-117.
14. Lee, S. L., & Kim, J.W. (2010). Student user satisfaction with web-based information systems in Korean universities. International Journal of Business and Management, 5(1), 62-68.
15. Nunnally, J. C. (1978). Psychometric theory. New York: McGraw Hill.
16. Poock, M. C., & Bishop, A. V. (2006). Characteristics of an effective community college web site.
Community College Journal, 30, 687-695.
17. Schwandt-Arbogast, A. (2005, February). Why most university web sites suck. Interllectual. Retrieved from http://interllectual.com/article/84/part-1
18. Stewart, D. W. (1981). The application and misapplication of factor analysis in marketing research. Journal of Marketing Research, 18, 51-62.
19. Tolppanen, B. P., Miller, J., Wooden, M. H., & Tolppanen, L. M. (2005). An examination of Library world wide web sites at medium-sized universities: A re-examination. InternetReference Services Quarterly, 10(2), 9 – 20.
20. Turnage, M. (2010). Personal communication. Stephen F. Austin State University, Ralph W. Steen Library, October 2, 2010.
21. U. S. Department of Education, National Center for Education Statistics. (2004). The condition of education 2004. Retrieved from http://nces.ed.gov/programs/coe.
22. U. S. Census Bureau. (2010). American fact finder. S1501. Educational attainment. Data set 2006-2008 American community survey 3-year estimates. Retrieved from
http://factfinder.census.gov/servlet/STTable?_bm=y&-geo_id=01000US.html
23. Welch, J. M. (2005). The electronic welcome mat: The academic library web site as a marketing and public relations tool. Journal of Academic Librarianship, 32(3), 225-228.
24. Xi, Y., Zhuang, Y., Huang, W., She, C., & Zhang, Z. (2007). The quality assessment and content analysis of corporate websites in China: An empirical study. International Journal of Information Technology & Decision Making, 6(2), 389-405.
APPENDIX A
WEB PAGE EVALUATION SURVEY
Section I: About You
Please complete the following survey instrument by filling in the blanks or checking the appropriate box. Remember, ONLY the researchers will see your responses and they will be kept STRICTLY CONFIDENTIAL: 1. What is your Major? ________________________________
2. What is your Minor if you have one? _________________________ 3. Are you working this semester? G Yes G No
3a. If yes, how many hours per week? __________
3b. If you are working do you have the same weekly schedule? G Yes G No 3c. Do you consider yourself a racial or national origin minority? G Yes G No 4. How many semester hours are you taking this semester? __________
5. How many semester hours have you earned not counting this semester? __________ 6. What is your age? __________
7. What is your gender? G Female G Male 8. What is your Grade Point Average at SFA? __________
9. What City and State are you answering from? ______________________________ 10. What type of Web Browser are you using?
G Internet Explorer G Mozilla Firefox G other ____________________ 11. What type of device are you using?
G Desktop PC G Laptop G Phone G other ____________________ 12. How would you classify your internet connection speed?
G Very Slow G Slow G Average G Fast G Very Fast
Web Page Assessment
Go to the assigned University web site and find information regarding admissions, the application process, scholarships, major requirements for the Management Major (College of Business), and the football team. Look for a schedule of classes and review the information as if you wanted to enroll and schedule classes as a management major. Following a review of the information, rate these items as they relate to the web pages you reviewed. Please rate the following items on the scale provided below. The items relate to your perceptions regarding the University web pages that you have been assigned to review. Put an X over your selection.
1
Extremely Dissatisfied
2
Dissatisfied
3
Neutral
4
Satisfied
5
Extremely Satisfied
1.Links to Academic Units. 1 2 3 4 5
2.Links to enrollment information at the University. 1 2 3 4 5
3.Links to admissions at the University. 1 2 3 4 5
4.On line application information. 1 2 3 4 5
5.Links to financial aid at the University. 1 2 3 4 5
6.On line application to financial aid. 1 2 3 4 5
7.Information about the football team. 1 2 3 4 5
8.Link to course schedule. 1 2 3 4 5
9.Organization of course schedule. 1 2 3 4 5
10. Usability of course schedule for course planning. 1 2 3 4 5
11. Link to registration for classes. 1 2 3 4 5
12. Quality of information for registration/ease. 1 2 3 4 5
14. Information coverage on the College of Business. 1 2 3 4 5
15. Ease of finding information on the College of Business. 1 2 3 4 5
16. Information on the Departments in the College of Business. 1 2 3 4 5
17. Ease of finding information on Departments in the College of Business. 1 2 3 4 5
After you have completed the above assignment, answer the following items regarding your overall web experience:
18. General Information coverage regarding the University. 1 2 3 4 5
19. Visual attractiveness of the web page. 1 2 3 4 5
20. Organization of the information about the University. 1 2 3 4 5
21. Overall satisfaction with University-level Web page system. 1 2 3 4 5
22. Did you experience any web-pages unavailable? YES NO
23. Did you feel the web pages appeared quickly? YES NO
24. Was there search help available? YES NO Did Not Look
25. Did your browser ever have to exit or close? YES NO