http://ijeas.truescholar.org
77
THE EFFECT OF ORGANIC MATTER ON RUNOFF, SOIL LOSS AND CROP
YIELD AT ANJENI, ETHIOPIA
1
Mohammed Seid Muhidin, and
2Gete ZelekeEshetu
Wollo University, College of Agriculture,
Department of Soil and Water Resources Management
Water and Land resources Center
Corresponding Author:
Mohammed Seid Muhidin
__________________________________________________________________________________________
ABSTRACT
Specifically, the study attempted to estimate the extent of the various components of price. The study was conducted in North-eastern Nigeria. Purposive sampling technique was used to select two states, of Adamawa and Taraba, from the six states that made up the North-east geopolitical zone. Only secondary data were used in the study. Secondary data on monthly bases for the prices of 100kg of three cereal grains, maize, rice and sorghum in both rural and urban markets in the study area were obtained from Adamawa and Taraba States Agricultural Development Programme offices for a period of 10 years (2001-2010). Data were analyzed using price decomposition technique. The results revealed that, the trend component showed an upward movement for all the three commodities. The seasonal variation had indexes ranged from 198.15 to 52.61, 142.83 to 61.88, and 141.44 to 66.25 for maize, rice and sorghum, respectively. The random and cyclical variations had negligible and insignificant indexes with the former having 0.01 all through and the later ranging from 0.93 to 1.26. This study would add to the volume of literatures on price analysis and also be an invaluable source of information to all stakeholders in the field of agricultural marketing and price.
© Ideal True Scholar
KEYWORDS:Seasonal, Cyclical, Irregular, Trend, Fluctuations, Cereal Grains
__________________________________________________________________________________
INTRODUCTION
Following the devastating drought in the 1980s, Ethiopia started a massive programme of soil and water conservation in the highlands, but the result was far below expectation that could be attributed to different reasons. One of the reasons is that, due to scarcity of level lands, steep slope are increasingly being cultivated, which will only exacerbate the problems. Abandoning the degraded lands and shifting to new land for cultivation will be increasingly difficult as the limits of the land that can be taken into production will soon be reached. This expansion is due to high population pressure, which in turn leads to extreme condition of land degradation. The productive topsoil in the highlands has been degraded, resulting in chronic food shortage and persistent poverty.
Serious erosion is estimated to have affected 25% of the highland area and some estimates found that 4% of the highlands of Ethiopia are now so seriously eroded that they will not be economically productive again in the foreseeable future. The capacity of the highland farming community to sustain production is therefore under serious threat (Kruger et al., 1996).
Even though there is a serious problem of accelerated erosion on the highlands, adoption of soil conservation technologies is very slow due to
different factors. The most important factors, besides socio-political and environmental factors, are land lost by physical soil conservation structures and low return from soil and water conservation measures. Therefore, suitable soil and water conservation measures are needed to increase the sustainability of farming on slope lands (Kiepe, 1995).
Water erosion is the major cause for land degradation on the Ethiopian highlands and it is found that it depends on two principal factors, rainfall and soil. Erosivity (the potential ability of rainfall to detach soil) is a rainfall factor and erodibility (the vulnerability of the soil to erosion) is a soil factor.
The soil phyysico-chmemical properties are well secured in the virgin lands with vulnerability of the soil to erosion while they are very poor in frequently cultivated sloppy lands. This is because of long term cultivation without any treatment to keep the fertility of the soil. Hence, there must be some treatment to bring about the original soil fertility though it is not as good as it was.
78
Increased erosion resistance is a central feature of soil conservation to create well-aggregated soils for they have suitable physical properties such as permeability, available water content for plants, aeration, and good soil tilth and erosion resistance According to Morgan (1986), one way of achieving and maintaining these soil properties is to apply organic matter. Organic matter content is an important soil property, which is depleted continuously with the use of soil for agriculture. Degradation of organic matter in turn affects the nutrient status and structural stability of the soil as well as physico-chemical properties and susceptibility to erosion. Mochoge and Mochoge et al. (1992) stated that soils with low aggregate stability, when subjected to tillage and the impact of heavy rainstorms, detached easily giving way to soil erosion.
Gbadegesin (1992) concluded that maintaining a high level of soil organic matter is very crucial to soil conservation. It is equally important to note that total organic matter content and soil porosity also contribute significantly to the variation in the water holding capacity. Thus, the benefits derived from increasing residual soil organic matter are substantial. Morgan (1986) added that the continual use of mineral fertilizer without organic manures leads to structural deterioration of soil and increased erodibility. Application of organic matter is one of the cost effective methods in soil and water conservation for it has a capacity of improving soil physical and chemical properties.
Having a very high livestock population on the Ethiopian highlands, the benefit from farmyard manure is very low; even absent on some part of the highlands, though many scientists from different parts of the world reported the importance of organic matter content in reducing soil erosion. With the above points in view, the study was taken up with the following specific objectives:
1. To study the effect of organic matter on runoff, soil loss and crop yield
2. To determine the optimum level of organic matter application for both soil conservation and crop production.
MATERIALS AND METHODS Description of the Study Area
This research was conducted at Anjeni Agricultural Research station, West Gojjam Zone of Amhara Region, Ethiopia. Anjeni is found at about 67 km from Debremarkos (Zonal Capital) in the Northwest direction and it is about 17 km from Denbecha district (District capital) in the Northeast direction. Geographically it is located at 10040’ N Latitude and 37o31’E Longitude with an altitude range of 2405-2500 m.a.s.l. Agro-climatically it is classified as wet
mid-altitude (Weynadega) and its rainfall regime is extended uni-modal (Gete, 2000). The research was conducted within the bound of this station. The station was established in 1982 as one of the Soil Conservation Research Projects and has served as a main data source for highland soil conservation planning for it has generated data for about 12 years. Anjeni catchment receives mean annual rainfall of 1616 mm (ten years average, 1983-1993).
According to Gete (2000), the land management practices in the area are very traditional and their effects on the physical properties of the soil have not yet been properly quantified. The soil of Anjeni is well discussed in Gete (2000). They are generally classified as acidic and poor in their fertility. This research was conducted on the plot cultivated for more than 50 years.
EXPERIMENTAL SET UP
Fifteen experimental plots of size 2 x 8 m were established on 20% west-facing slope at Anjeni soil conservation research station, just near to the meteorological station. This size is selected as it is considered to be large enough to represent the actual field condition for sheet and inter-rill erosion, and small enough to avoid the formation of gullies. Erosion process under a given soil type, slope and traditional farming conditions was monitored using these plots.
All plots were plowed across the slope following the local agronomical practice of the farmers. It is mostly twice before sowing and was done accordingly. This experiment has five-treatment levels of organic matter (0, 20, 40, 60, and 80 ton/ha) with three replicates arranged in Randomized Complete Block Design (RCBD). Field layout is shown as under.
T1 = 0 (control), T2 = 20, T3 = 40, T4 = 60 & T5 = 80 tone/ha.
# =Plot numbers Rep=replication Fig.1 Experimental field lay out (not to scale)
79
first time and the research was done for one more year with identical treatment and crop in similar time. Mean values of two years data were used for all these analyses. Plot borders were installed in all the plots, immediately after Barley was planted to contain surface runoff within plots and keep outside contamination to a minimum. Plot borders were about 33.3cm high pearlin iron sheet that provided lightweight, flexible and reusable border. The borders were inserted about 13.3 cm deep leaving the rest 20 cm above the ground surface. Each runoff plot has a collecting trough at extreme down slope position to guide the entire runoff from each plot towards the collecting tanks. The collecting trough and the plot borders were fixed by mortar to make the junction water-tight. A ditch above each replication protected the over land flow from running on to the next lower replication.
Below the collecting trough, there were two Tanks, Tank A and Tank B. Tank A, which received surface runoff directly from experimental plots, was half of a 200 liter oil drum. But Tank B, which received the over flow of Tank A, was a full 200 liter oil drum. A simple iron sheet was used as a cover for each tank to protect the direct rainfall and evaporation from the tanks.
A slot-divisor was fitted to Tank A to covey 1/10 of the overflow to tank B. However, the over flow volume was so small that it was difficult to measure the water volume in Tank B. Thus, the total over flow was led to Tank B. The total sediment and runoff from each experimental plot were, therefore, accumulated in two tanks
Fig 2 A mortar joint at the down steam end of the plot makes the collecting through water tight
Manure Application
Cattle, Equines and small ruminant manures collected from the local farmers, almost in equal proportion, were air-dried and mixed before application on the plots. Larger cow-dung cakes were crushed to smaller size so as to have uniform grain size. Manure was weighed and surface applied based on the specified rates (0, 20, 40, 60, and 80 ton/ha) two
months before sowing. During manure application, it was tried to keep uniform distribution over the surface, and further mixing to an approximate soil depth of 20 cm at the time of sowing.
METHOD OF DATA COLLECTION Runoff
Runoff data was collected on daily basis (every day at 8:00 A.M local time). After each runoff event, sediments settled in Tank A (called bed load). Finer particles (called suspended sediment or suspended load), however, remained suspended for they need, probably, more than a day for settling. When the water in Tank A was clearer, it was siphoned out, measured and recorded as pure water; otherwise, one liter water sample was taken for suspended sediment analysis if it was assumed to be sediment loaded.
But in Tank B, the water was stirred vigorously to have uniform distribution of suspended sediment. Immediately after stirring, one-liter water sample was taken for analysis and the content was let to empty after measuring. The water samples were filtered through pre-weighed filter paper so that the concentration in gram per liter could be found. This concentration was multiplied by the total water volume to get the suspended sediments in tank B. After siphoning out the water in Tank A, 300gm wet sediment sample was taken for bed load analysis and the total sediment was weighed wet and thrown away. Finally, the sediment samples and filter papers were air-dried at the station and brought to laboratory for oven drying to determine dry sediment weight and water content in the sediments.
Sediment
Sediment data was collected at the same time as the runoff. As explained above, suspended sediment was calculated based on concentration in gram per liter from tank B. The total suspended sediment was found by multiplying this concentration (gm/l) by total water volume in liter, whereas the bed load from tank A was calculated based on the dry weight of 300 gm wet sediment sample dried at 600 C for 48 hrs. For moisture content determination, oven was mostly set at 1050C but plant and soil samples are dried from 60 to 700C for further chemical analysis to avoid organic decomposition (Foth and Ellis, 1997). After oven drying the samples, the percentage of moisture content was used to determine dry sediment weight. Dry sediment weight is equal to the wet sediment weight multiplied by the percentage of dry sediment weight. The total sediment weight was, therefore, found to be the sum of dry weight of suspended sediments and bed loads.
Biomass, Straw and Grain Yield
80
significant reduction of yield). It was air-dried and weighted whole to determine the total biomass. The head of the barley was cut and threshed to separate the grain yield. The weight of the straw was calculated by subtracting the grain yield from the total biomass.
STATISTICAL DATA ANALYSIS
Statistical analyses were carried out on run-off, soil loss, crop yield, biomass, soil nutrients and organic matter content using SPSSVER.17 computer program to determine the existence of any statistical difference due to application of different levels of organic matter. Separations of significant differences between and among treatment means were made by Duncan’s Multiple Range Test (Gomez and Gomez, 1984).
RESULT AND DISCUSSION Runoff
Out of 103 rainfall events in the research period of the first year, 80 of them could generate runoff on control plots whereas 25 runoff events were recorded for the heavily manured (80ton/ha) plots. Because of the general low rainfall condition in the second year, out of the 104 rainfall events, only 63 rainfall events were recorded from the control while 10 events were seen from the last two heavily treated plots. These high reductions from 80 in the first year and 63 in the second year on the control to 25 and 10 respectively on heavily treated plots were due to an increased manure rates from zero to eight ton per hectare. The decrease is not only in the runoff events but also associated with the volume of runoff. These two conditions resulted in varied total runoff volume. The rainfall amounts that could generate runoff were dependant on many different factors, including vegetation cover, soil type, slope, surface roughness and antecedent moisture content. In this study, antecedent moisture content and surface roughness conditions were the most important factors in runoff yield. At saturation, a small rainfall of 2.8 mm could give runoff on all plots while 33.3 mm rainfall in the first week (before saturation) did not give runoff on any of the experimental plots. However, generally, in the summer season when soils were wet, those rainfall amounts above 10 mm gave considerable runoff on all agricultural lands. Antecedent moisture content also has an influence on overland flow and soil losses. This could be explained by the heavy rainfall events of June 14 (75.2 mm) and July11 (64 mm), 2003. The runoff in the first case was lower while the soil loss was much higher. The runoff was attributed to higher infiltration (due to less antecedent moisture) whereas the soil loss was due to different factors including vegetation cover. Initially all experimental plots were bare and uniform. This uniformity continued until the beginning of the third week since shoot emergence. The cover changes afterwards due to varied plant growth. It could be
observed that the cover condition and surface infiltration governed the runoff pattern from experimental plots. Total runoff (liter) responses from similarly treated plots were nearly identical which agreed with the result of Dilshad et al. (1997). There was, however, a significant difference in runoff responses under different organic matter levels. The runoff was also critically dependant on selective erosive storms. This might be explained from the two heaviest (June14 and July11, 2003) rainfall events where the runoff is opposite of their rainfall amount. This indicated that the runoff volume was highly correlated with storm intensity and moisture
conditions, not with that of total amount of rainfall.
y = 2784.4e-0.0305x
R2= 0.98
0 500 1000 1500 2000 2500 3000 3500
0 20 40 60 80 100
M
ea
n
ru
no
ff
v
ol
u
m
e
(m
3/h
a)
…
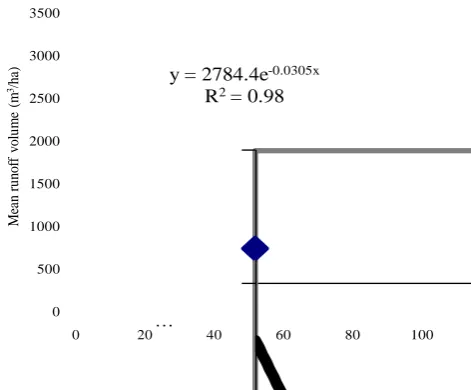
Fig. 3 The relation of runoff volume and applied rate of organic manure
Generally, runoff decreased as the rate of organic matter increased which agrees with the result of Douglas et al. (1998). Cumulative mean runoff from experimental plots is shown in Fig. 3. The runoff from each experimental plot follows clearly defined opposite trend of treatment levels. But this trend was slightly disturbed when the antecedent moisture content changed. Soils when bare and initially dry have higher infiltration rates but it is reduced to a minimum after saturation. In a sunny and bright day, plots with less cover were drier and fine cracks were observed. When this case was followed by shallow rainfall (less intensity), plots with less cover and cracks responded less runoff while plots relatively wet because of better coverage generated more runoff.
81
infiltration. Less runoff generation from heavily treated plots during heavy storms is not only due to surface infiltration and cover factors but also due to the obstacles created along the fine-net work runoff ways, resulted from higher biomass production on plots receiving higher rate of manure. Higher conductivity of water to the ground was observed during the rainfall on heavily manured plots. The data (Fig. 3) confirmed that runoff decreased from 3130.16 m3/ha in the control plots (0 ton/ha) to 240.12 m3 /ha in the heavily manured plots (80 ton/ha). The relation is well fitted to exponential equation of the following form:
y = a ebx (1) Using the original data and selected model, the best regression equation for runoff volume was worked out to be: y = 2784.4e-0.0305x (2) (With R2 = 0.98).
Where, y = Runoff volume (m3/ha), e = natural logarithm (2.71828)
x =applied organic matter level (ton/ha)
2784.4 = constant for runoff volume (m3/ha) at zero applied organic matter level or y-intercept.
The statistical analysis indicated that highly significant difference (p<0.01) existed in runoff due to the application of different rate of organic matter but there is no significant difference in runoff between treatment means for the last three heavily treated plots. Application of animal manure affects not only runoff but also soil loss.
Soil loss
Sediment losses at the bottom of each experimental plot were analyzed based on the data collected through out the research period. Manure influenced soil surface condition, which in turn strongly influenced eroding potential of rainfall splash and overland flow. The annual soil loss is mainly dependant on two or three selective extreme erosive storms that agrees with the result of Douglas et al. (1998). This could be well explained by the two largest erosive storms occurred on June 14 (75.2 mm) and July 11 (64 mm)2003, which caused a soil loss of 34.22 ton/ha (52.3% of the annual soil loss) in the control (non-manured) plots, more than 9 times that is lost from heavily treated experimental plots. Soil loss is more critically governed, besides cover factors, by rainfall intensity than the total amount. A single heavy storm of June 14, 2003 (75.2mm or 150mm/hr, which was the maximum intensity in the research period) could justify the statement. This rainfall (75.2 mm) alone could cause a soil loss of 23.64 ton/ha from the control plots that accounted 36.13% of the annual soil loss (65.43 ton/ha) while it is 5.7% of the annual rainfall.
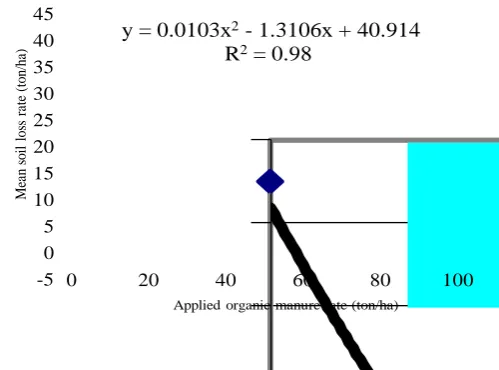
Generally the amount of sediment decreased from 42.49 ton/ha on the control plots to 0.199 ton/ha on
the heavily manured plots as the rate of applied manure increased from zero to eighty ton per hectare.
y = 0.0103x2- 1.3106x + 40.914
R2= 0.98
-5 0 5 10 15 20 25 30 35 40 45
0 20 40 60 80 100
M
ea
n
so
il
l
os
s
ra
te
(to
n/
ha
)
Applied organic manure rate (ton/ha)
Fig. 4 The relation of soil loss rate and applied organic manure.
The rate of reduction between treatment means was observed to be more than half. It was also worked out to select the best model for soil loss of the form: y= ax2 +bx+c (3) Using the data and the selected model, the best regression equation for soil loss is found to be:
y = 0.0103x2 - 1.3106x + 40.914, (4)
(With R2 = 0.98), Where, y = soil loss rate (ton /ha), x = Rate of applied organic matter (ton/ha) 40.914 = y-intercept
Very high variations were observed in sediment losses among manured and non-manured plots, higher value being from the control and the least one being from the heavily treated plots. Statistically, the difference was highly significant (p < 0.01) but there is no significant difference in soil loss above 40 ton/ha manure rates.
82
Fig 6 Soil loss rates for the two heaviest storms at different antecedent moisture contents (14June and 11July, 2003 after 16 and 43 rain fall events respectively)
It was also observed that applied animal manure influenced crop yield such as total biomass, grain , and straw yields.
Crop
Biomass Production
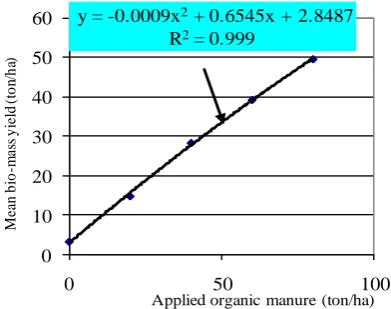
Total biomass production increased as the applied organic manure rate increased. The biomass difference due to applied manure was observed in crop height, height of barley head and number of seeds per head (data not shown). The total biomass increased from 3.2 on the control to 49.39 ton per on the heavily treated plots. The total biomass varied significantly (p<0.01) but there was no significant difference in biomass between the first two, the middle three and the last three treatment means. The increment in biomass was well fitted to the equation of the form equation (3).
Based on the data and selected model, the best regression line which fitted the biomass yield could be given by: y = -0.0009x2 + 0.6545x + 2.8487 (5) (With R2 = 0.999), Where, y = Biomass yield (ton /ha), x= Rate of applied organic matter (ton/ha) 2.8487 = y- intercept
y = -0.0009x2+ 0.6545x + 2.8487
R2= 0.999
0 10 20 30 40 50 60
0 50 100
M
ea
n
b
io
-m
as
s
y
ie
ld
(
to
n/
h
a)
Applied organic manure (ton/ha)
Fig. 7 Total biomass versus applied manure rates
Fig. 8 A full view of the three replications at crop maturity
Straw Yield
Straw yield is mostly governed by crop density and vegetative growth. Straw yield increased from 4.12 to 15.06 ton/ha as the applied manure rates increased from 0 to 80 ton / ha. Generally applied manure influenced measured straw yield highly significantly (p<0.01).
The trend line for straw yield is also well fitted to the quadratic model of the form equation (3). After regression the straw yield could be given by the equation:
y = -0.0013x2 + 0.2417x + 4.0131. (6) (With R2 = 0.98), Where, y = Straw yield (ton/ha), x = Applied manure rates (ton/ha).
4.0131 = y-intercept
y = -0.0013x2+ 0.2417x + 4.0131
R2= 0.98
0 2 4 6 8 10 12 14 16
0 50 100
M
ea
n
st
raw
y
ie
ld
(t
o
n/
ha)
Applied organic manure rate(ton/ha)
Fig. 9 The relation of straw yields and applied manure rates
Grain Yield
83
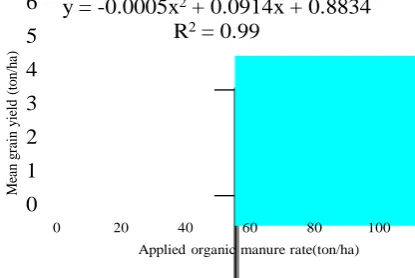
The trend line for grain yield was also well fitted to the quadratic model of the form equation (3). Using the selected model, the grain yield could be given by equation:
y = -0.0005x2 + 0.0914x + 0.8834 (7) (With R2 = 0.99), Where, y = grain yield (kg/ha), x = applied manure (ton/ha).
0.8834 =constant for grain yield at zero applied organic matter level(Y-intercept)
Grain yield is almost leveled off after 40 ton/ha manure rates, which is similar to the result reported by Larney and Janzen (1997).
y = -0.0005x2+ 0.0914x + 0.8834 R2= 0.99
0 1 2 3 4 5 6
0 20 40 60 80 100
M
ea
n
g
ra
in
y
ie
ld
(t
o
n
/h
a)
Applied organic manure rate(ton/ha)
Fig. 10 The relation of grain yields and applied manure rates
SUMMARY AND CONCLUSION
Land degradation is most noticeable on Ethiopian highlands where human and livestock population densities are relatively high. Soil erosion by water is believed to be the major limiting factor for land degradation and low agricultural production on the highlands. Application of organic manures on the soil is very crucial in mitigating soil erosion problems and facilitating adoption of physical soil conservation measures. Manure is effective to improve soil properties and crop production because it contains soil nutrients and organic matter. It is generally accepted that the improved soil properties associated with manure application lead to changes in runoff, soil loss and crop yield.
The reduced runoff and soil loss agrees with the result of Dilshad et al. (1997) but contradicts with the laboratory result of Gilley et al. (1999) on measurement of runoff and erosion, which states no significant difference in runoff and erosion between manured and non-manured treatments.
The runoff and soil loss were reduced from 3130.16 m3/ha in the control plots (0 ton/ha) to 240.12 m3 /ha in the heavily manured plots (80 ton/ha) and 42.49 to 0.199 ton/ha respectively while the biomass, straw and grain yields were increased from 3.2 to 49.39, 4.12 to 15.06 and 0.432 to 1.934 ton /ha respectively. Though the reductions of runoff and soil loss, and increment of biomass, straw and grain yields were so
high, there were no significant differences between treatment means for the last three heavily manured plots. Generally it could be observed that the quantity of applied manure strongly influenced measured runoff, soil loss, total biomass, straw and crop yield. But there is no significant difference in all the treatment means above 40 ton/ ha manure rates.
REFERENCES
Dilshad M, J.A.Motha,and L.J.peel,1997. Surface Runoff, Soil and Nutrient losses from farming system in the Australian semi-arid tropics. Australian journal of experimental Agriculture .36:1003-1012.
Douglas,C.L,K.A.King,and J.F.Zuzel,1998. Nitrogen and Phosphorus in the surface runoff and sediment from a wheat-pea Rotation in northern Oregon. Journal of Enviromntalquality.27: 1170-1177.
Foth,D..H, and G.B. Ellis, 1997. Soil fertility. New York.
Gbadegesin, A. 1992. Soil M and Moisture Conservation in the Savanna soils of southern Nigeria In: H. Hurni and Kebede .T. (editors). Erosion, Conservation and Small Scale Farming Walswoth Inc. 306 N.Kansas.ave, Switzerland.
Gete Zeleke, 2000. Landscape dynamics and Soil Erosion process Modelling in the northwestern Ethiopia highlands. Geographica Bernensia, Switzerland.
Gilley,J.E, J.W.Doran ,T.H.doa,1997. Runoff ,Erosion and Soil quality Characteristics of a former conservation reserve program site in south western Oklahoma. American Society of Agricultural Engineers.13 (5): 617-622
Gilley,J.E.and L.M.Risse,2000. Runoff and Soil Loss as affected by the application of manure. Transaction of ASAE.43(6):1583-1588.
Gomez, K.A and Gomez A.A 1984. Statistical procedures for agricultural research, 2nd. edition.
Kapkiyai,J.J., N.K.Karanja, P.Woomer, and J.n.Qureshi,1998. Soil Organic Carbon fraction in a long term experiment and the potential for their use as a diagnostic assay in high land farming systems of central Kenya. Africa Crop Science Journal .6(1):19-28.
84
Kiepe, P. 1995. No runoff, no soil loss: soil and water conservation in hedgerow barrier systems. Tropical Resource management paper10. Wageningen Agricultural University. The Netherlands.
Kruger, H.J., Berehanu, F., Yohannes, G/M. and Kefeni, K. 1996. Creating an inventory of indigenous soil and water conservation in Ethiopia. In: In:C.Reij.,I.Scoones and C.Toulimin (eds) sustaining the soil: indigenous soil &water conservationin Africa. Earthcan pub.Ltd.,London..
Larney, F.J.,and H.H.Janzen,1997. A simulated erosion approach to assess rates of cattle manure and phosphorus fertilizer for restoring productivity to eroded soils. Agriculture, Ecosystem and Environment.65: 113-126.
Mochoge, B.O.and S.M. Mwonga, 1992. The Effect of continuous land use on aggregate stability and organic carbon for three-soil type in Kenya. In: H. Hurni and Kebede .T. (editors). Erosion, Conservation and Small Scale Farming Walswoth Inc.306 N.Kansas.ave, Switzerland.
Moges, W.B. and D.B. Thomas, 1992. The influence of surface residue on soil loss. In: H. Hurni and Kebede T. (editors). Erosion, conservation and small scale farming Walswoth Inc. 306 N.Kansas.ave., Switzerland.
Morgan, R.P., 1986. Soil Erosion and Conservation .D.A. Davidson(Ed) John Wiley &sons Inc. New York.