Using Three-Parameter Latent Trait Model In
The Development Mathematics Achievement
Test
Ogbonna, Joseph .U, Orluwene, Goodness. W
Department of psychology, Guidance and counseling University of port Harcourt
ABSTRACT
This study was concerned with the development and validation of mathematics achievement test using the three-parameter latent trait model of the item response theory in the junior secondary schools in Rivers state. The sample comprised 2000 JSS III students in public schools in the urban and rural locations in Rivers state selected through proportional stratified random sampling. The instruments for data collection was the fifty itemed Mathematics Achievement Test (MAT) developed by the researchers. It is a 5-optioned multiple choice objective test. Three research questions guided the study. Students’ responses to the test items were calibrated with an IRT statistical software named x-calibre 4.2.2 developed by Assessment Systems Corporation. The study revealed that fifteen (15) out of the fifty (50) items which was 30% of the mathematics achievement test items fitted the three parameter latent trait model. From the fifteen (15) items, two (2) were classified as good items, nine (9) were classified as fairly good items while four (4) items were classified as poor items. Based on the findings, recommendations were made, one of them being that three-parameter latent model be used to ascertain the credibility of mathematics achievement test items by removing items prone to guessing.
Keywords: IRT, difficulty index, discrimination index and guessing index, mathematic achievement test
INTRODUCTION
Mathematics is a fundamental science which deals with the study of time, space measurement, time, space, quantities, shapes and numbers and how they relate with each other (Srivastav, 2013). That means mathematics cut across almost all aspects of our lives. For example the knowledge of mathematics is very important to a house wife who uses it to determine the quantity of yam, rice, beans, spices and flour to be cooked for the family. To an animator, the knowledge of mathematics (specifically linear algebra) is used to showcase how a given object rotates and shifts. A trader uses the knowledge of mathematics to determine the cost price, selling price and the gain. A carpenter uses the mathematics skills to determine the accurate length and width of the wood before a good furniture can be made. Mathematical skills are also utilized in day-to-day record keeping, budgeting and good selling and buying processes for a business man. Thus without mathematical skill efficient business transaction cannot be achieved.
More so, the fashion designer uses the knowledge of mathematical skills to get the accurate measurement before designing the fabric and even determine the cost for designing the fabric. In another dimension, Srivastav (2013) stated that knowledge of mathematics skills promotes the habits of accuracy, mental alertness and sharpen the reasoning ability in other hand it hinders careless and inaccuracy.
In a nutshell mathematical skills are also indispensible in the hands of the computer scientist, architect astronaut, physician, athletics, mechanic and pilots etc.
the capacity to learn and master new mathematical ideas and skills. In essence, as important as Mathematics is to the self and nation, it is necessary for students to perform well in the subject. However, good performance of students is estimated from a test with good psychometric properties. This is because Onunkwo (2002) stated that sometimes students fail test due fault inherent in the test items and not just due to their own inabilities.
Achievements in mathematic among secondary school students have a very strong influence on the performance in their higher levels of education. This is because high ability in mathematics at the secondary schools predicts preparation for mathematic-related disciplines such as statistics, engineering, medicine technology. To this end Ker (2013) reported that many educators are of the view that high quality mathematics education enhanced students’ interest, values, skills and good attitude required for scientific and technological courses as their future career.
Issues consider worthwhile in improving mathematics achievement include educational policies educational resources in-service training for teachers and quality assessment, obviously quality assessment cannot take place without test with good psychometric properties. Tests with good psychometric properties are better achieved with item response theory because it deals with estimation of item and person parameter.
The quest for better estimation and interpretation of examinees’ abilities has necessitated several researches in most field, mostly in educational and psychological endeavour. The goal has been to provide a tool that will aid eliciting authentic information about the latent construct within the examinee. Test as a tool has become necessary to resolve the enigma. The process of development of test for assessment of hidden trait for necessary comparison is the main focus of Latent Trait Theory (LTT) also known as the Item Response Theory (IRT), which has taken greater prominence over Classical Test Theory (CTT). Classical Test Theory being the earliest framework of test items development assumes equal contribution of items to the overall score of an individual. Its major aim is to enhance reliability. The basic problems with CTT is that it is sample dependent hence scores on test are individual specific. These have led to parallel issues in comparing examinees’ scores which lack predictability, with equal level of error assumed the same for everybody.
These shortcomings and more have led to the need for the better framework, the Item Response Theory which addresses measurement of a hypothetical latent construct such as ability or aptitude. IRT uses same scale to measure the trait and item psychometric properties at a given ability level. This framework is item-oriented and assumes that psychometric properties are invariant, scores are independent of the test and the contributions of item evaluated is independent of other items. The purpose of IRT is to create a scale for the interpretation of assessment and to propose models that permit the linkage of a latent trait to some unobservable characteristics. In general IRT models assumes that the performance of an examinee can be completely predicted or explained from one or more abilities (Hambletion and swaminathan 1985). IRT models enables connection between observed response and the underlying construct, as well as provide a way to estimate score on the ability. Moreover, the examinee score becomes the basis for the estimation of the fundamental construct under investigation. To estimate the hidden construct of interest, IRT uses different models, hence there exist different models and parameterization associated with item response theory including one-parameter, two-parameter and three-parameter models.
One-parameter logistic model (IPLM), also known as Rasch Model, only considers the difficulty index usually denoted by bi as the parameter of the test items. The two parameter logistic model (2PLM) considers two parameters of test items namely the discrimination indices, denoted as ai, in addition to difficulty index (bi),
while the three-parameter logistic model (3PLM) includes the guessing parameter denoted by (ci) in addition to
ai and bi. There are several reasons why students are involved in the art of guessing during testing, Obinne (2012) identified them as lack of adequate knowledge or ability to provide correct answer to a question. Obinne (2011) further opined that guessing means giving an answer or making a judgment about something without being sure of all the facts.
Guessing possess a serious challenge in the process of student assessment affecting both the psychometric properties of items and the determination of aptitude or abilities of test takers. It is observed that in mathematics and other mathematical sciences, guessing is well utilized by students due to their low mathematical ability or insufficient knowledge of the subject matter under consideration.
In view of the aforementioned, the purpose of the paper is to develop items that lend itself not to guessing using three-parameter logistic model of IRT in mathematics. Hence the study was guided by the following three research questions:
a. What are the items parameter estimates ai, bi, and ci ?
b. How many item fitted the three-parameter logistic model?
c. What are the qualities of the fitted items?
Methodology
The design for this study is instrumentation research design as it involves instrument development. Kpolovie (2010) opined that instrumentation research is a scientific investigation for meticulous development or production of a test or measuring instrument that validly measures a given concept or psychological construct, which it is intended with maximum accuracy.
The instrument for this study is 50 mathematics question drawn from JS3 syllabus in Rivers state. An initial 100 multiple-choice questions with five options were drawn from relevant content areas of the scheme, which students have been taught using test blue-print to ensure content coverage and validity. The items of the instrument were ascertained for validity also through expert judgment. Thereafter, the instrument was administered to a sample of 200 students from the population of study. The students’ responses were collected, scored, collated and analyzed using maximum likelihood estimation procedures via X-calbre 4.2.2 developed by Harwell, Baker and Zwarts (1998). This was to ensure that the items parameters (difficulty and discrimination) indexes are within the recommended interval. The result of the pilot study showed that eighty-nine (89) items fitted the two-parameter logistic model (2PLM), while 11 items did not fit the 2PLM. Furthermore, the standard errors of estimate of the items parameters were also computed. Fifty 50 test items from the fitted items to the two-parameter logistic model were chosen based on the items that discriminated well and of moderate difficulty. It is assumed that in 2PLM the guessing is assumed constant or 0.00 for all items.
This 50 itemed-multiple choice Mathematics Achievement Test (MAT) constituted the final version of the tool. The 50 multiple-choice Mathematics Achievement Test (MAT) was administered to a sample of 2000 JS3 students drawn from 10 Local Government Areas of Rivers state of the entire population. It is assumed that a sample 2000 students is sufficient enough to estimate the guessing index of the items because three-parameter logistic model, because it requires a test with large number of items and a large sample size.
The data analysis was done on the responses from 2000 students on the 50 multiple-choice MAT using the maximum likelihood estimation of the x-calibre 4.2.2. The x-calibre IRT software was used to run the analysis because of its easiness in applicability. The items’ parameter and their item characteristic curves were generated and standard error of estimation of each item parameter was also estimated.
Results
The result of research questions 1, 2 and 3 are presented in tables 1, 2, and 3 respectively
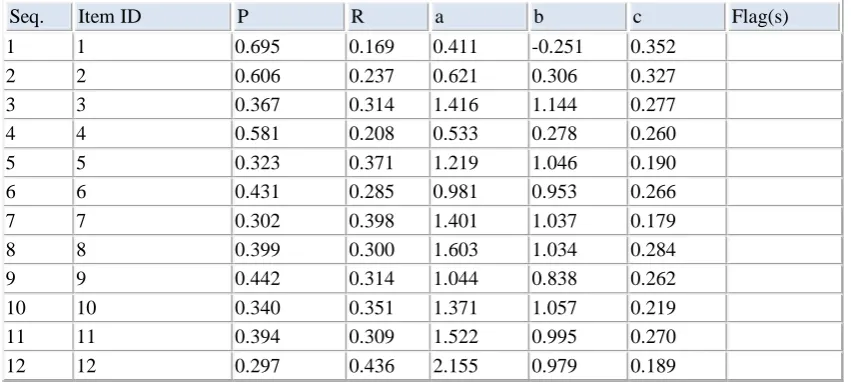
Table 1: The item parameter a, b and c of the 50 itemed MAT using 3PLM of IRT
Seq. Item ID P R a b c Flag(s)
1 1 0.695 0.169 0.411 -0.251 0.352
2 2 0.606 0.237 0.621 0.306 0.327
3 3 0.367 0.314 1.416 1.144 0.277
4 4 0.581 0.208 0.533 0.278 0.260
5 5 0.323 0.371 1.219 1.046 0.190
6 6 0.431 0.285 0.981 0.953 0.266
7 7 0.302 0.398 1.401 1.037 0.179
8 8 0.399 0.300 1.603 1.034 0.284
9 9 0.442 0.314 1.044 0.838 0.262
10 10 0.340 0.351 1.371 1.057 0.219
11 11 0.394 0.309 1.522 0.995 0.270
13 13 0.268 0.442 1.953 1.042 0.168
14 14 0.284 0.366 1.640 1.153 0.191
15 15 0.368 0.278 1.300 1.168 0.259
16 16 0.339 0.350 1.467 1.022 0.216
17 17 0.272 0.415 1.649 1.080 0.169
18 18 0.312 0.402 1.740 0.992 0.196
19 19 0.368 0.349 1.212 0.954 0.220
20 20 0.340 0.359 1.522 1.020 0.220
21 21 0.292 0.297 1.681 1.263 0.215
22 22 0.345 0.423 1.768 0.875 0.207
23 23 0.370 0.343 1.298 0.961 0.228
24 24 0.365 0.298 1.414 1.097 0.253
25 25 0.250 0.381 1.911 1.172 0.170
26 26 0.327 0.397 1.559 0.969 0.199
27 27 0.391 0.347 1.420 0.919 0.249
28 28 0.271 0.447 1.711 1.010 0.158
29 29 0.439 0.387 1.290 0.662 0.238
30 30 0.375 0.356 1.392 0.925 0.231
31 31 0.355 0.438 1.633 0.820 0.201
32 32 0.250 0.454 1.575 1.021 0.136 F
33 33 0.381 0.417 1.767 0.762 0.220
34 34 0.328 0.338 1.343 1.070 0.208
35 35 0.346 0.417 1.909 0.857 0.208
36 36 0.330 0.414 1.642 0.894 0.191
37 37 0.288 0.502 1.920 0.834 0.147 F
38 38 0.321 0.437 1.720 0.870 0.180
39 39 0.271 0.483 2.095 0.928 0.154 F
40 40 0.369 0.392 1.466 0.853 0.216
41 41 0.357 0.374 1.945 0.928 0.234
42 42 0.416 0.351 2.130 0.849 0.284 F
43 43 0.380 0.348 1.290 0.905 0.227
44 44 0.346 0.399 1.570 0.873 0.201
45 45 0.348 0.437 1.768 0.799 0.194
46 46 0.306 0.430 1.534 0.896 0.164
47 47 0.333 0.458 1.723 0.787 0.174
48 48 0.338 0.419 1.492 0.847 0.183
49 49 0.359 0.377 1.301 0.856 0.196
50 50 0.375 0.396 1.510 0.805 0.214
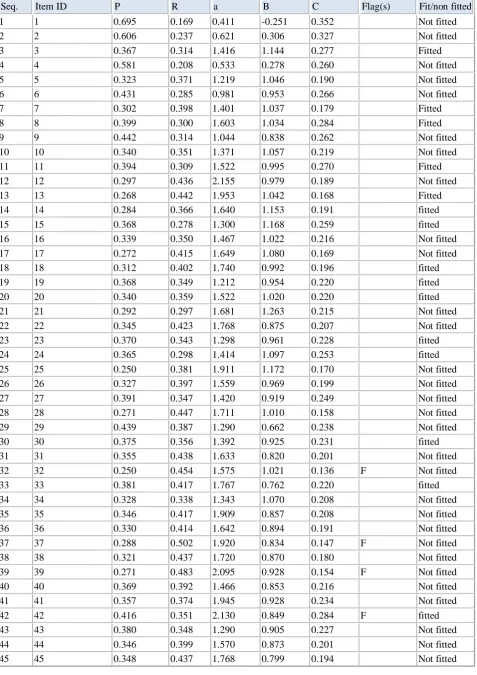
Table 2: The items of the MAT that fitted three-parameter model
Seq. Item ID P R a B C Flag(s) Fit/non fitted
1 1 0.695 0.169 0.411 -0.251 0.352 Not fitted
2 2 0.606 0.237 0.621 0.306 0.327 Not fitted
3 3 0.367 0.314 1.416 1.144 0.277 Fitted
4 4 0.581 0.208 0.533 0.278 0.260 Not fitted
5 5 0.323 0.371 1.219 1.046 0.190 Not fitted
6 6 0.431 0.285 0.981 0.953 0.266 Not fitted
7 7 0.302 0.398 1.401 1.037 0.179 Fitted
8 8 0.399 0.300 1.603 1.034 0.284 Fitted
9 9 0.442 0.314 1.044 0.838 0.262 Not fitted
10 10 0.340 0.351 1.371 1.057 0.219 Not fitted
11 11 0.394 0.309 1.522 0.995 0.270 Fitted
12 12 0.297 0.436 2.155 0.979 0.189 Not fitted
13 13 0.268 0.442 1.953 1.042 0.168 Fitted
14 14 0.284 0.366 1.640 1.153 0.191 fitted
15 15 0.368 0.278 1.300 1.168 0.259 fitted
16 16 0.339 0.350 1.467 1.022 0.216 Not fitted
17 17 0.272 0.415 1.649 1.080 0.169 Not fitted
18 18 0.312 0.402 1.740 0.992 0.196 fitted
19 19 0.368 0.349 1.212 0.954 0.220 fitted
20 20 0.340 0.359 1.522 1.020 0.220 fitted
21 21 0.292 0.297 1.681 1.263 0.215 Not fitted
22 22 0.345 0.423 1.768 0.875 0.207 Not fitted
23 23 0.370 0.343 1.298 0.961 0.228 fitted
24 24 0.365 0.298 1.414 1.097 0.253 fitted
25 25 0.250 0.381 1.911 1.172 0.170 Not fitted
26 26 0.327 0.397 1.559 0.969 0.199 Not fitted
27 27 0.391 0.347 1.420 0.919 0.249 Not fitted
28 28 0.271 0.447 1.711 1.010 0.158 Not fitted
29 29 0.439 0.387 1.290 0.662 0.238 Not fitted
30 30 0.375 0.356 1.392 0.925 0.231 fitted
31 31 0.355 0.438 1.633 0.820 0.201 Not fitted
32 32 0.250 0.454 1.575 1.021 0.136 F Not fitted
33 33 0.381 0.417 1.767 0.762 0.220 fitted
34 34 0.328 0.338 1.343 1.070 0.208 Not fitted
35 35 0.346 0.417 1.909 0.857 0.208 Not fitted
36 36 0.330 0.414 1.642 0.894 0.191 Not fitted
37 37 0.288 0.502 1.920 0.834 0.147 F Not fitted
38 38 0.321 0.437 1.720 0.870 0.180 Not fitted
39 39 0.271 0.483 2.095 0.928 0.154 F Not fitted
40 40 0.369 0.392 1.466 0.853 0.216 Not fitted
41 41 0.357 0.374 1.945 0.928 0.234 Not fitted
42 42 0.416 0.351 2.130 0.849 0.284 F fitted
43 43 0.380 0.348 1.290 0.905 0.227 Not fitted
44 44 0.346 0.399 1.570 0.873 0.201 Not fitted
46 46 0.306 0.430 1.534 0.896 0.164 Not fitted
47 47 0.333 0.458 1.723 0.787 0.174 Not fitted
48 48 0.338 0.419 1.492 0.847 0.183 Not fitted
49 49 0.359 0.377 1.301 0.856 0.196 Not fitted
50 50 0.375 0.396 1.510 0.805 0.214 Not fitted
The criteria for an item to fit the 3PLM is that the probability of the item should be greater than alpha level of 0.05 significant level as was calibrated. Hence 15 i t e m s f i t t e d the 3PLM of the study Such items are 3,7,8,11,13, 14,15,18,19,20,23,24,30,33, and 42.
While 35 items of MAT did not fit the 3PLM, (Not fitted); such items; are 1, 2, 4, 5, 6, 9, 10, 12, 16, 17, 21, 22, 25, 26, 27, 28, 29, 31, 32, 34, 35, 36, 37, 38, 39, 40, 41, 43, 44, 45, 46, 47, 48, 49, and 50.
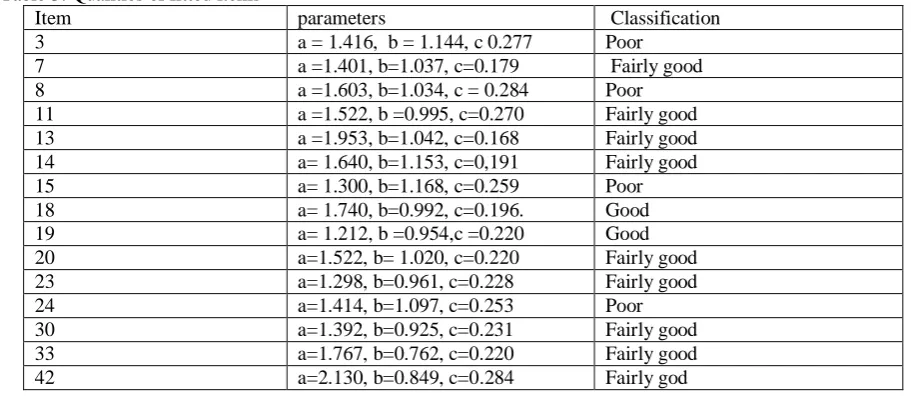
Table 3: Qualities of fitted items
Item parameters Classification
3 a = 1.416, b = 1.144, c 0.277 Poor
7 a =1.401, b=1.037, c=0.179 Fairly good
8 a =1.603, b=1.034, c = 0.284 Poor
11 a =1.522, b =0.995, c=0.270 Fairly good
13 a =1.953, b=1.042, c=0.168 Fairly good
14 a= 1.640, b=1.153, c=0,191 Fairly good
15 a= 1.300, b=1.168, c=0.259 Poor
18 a= 1.740, b=0.992, c=0.196. Good
19 a= 1.212, b =0.954,c =0.220 Good
20 a=1.522, b= 1.020, c=0.220 Fairly good
23 a=1.298, b=0.961, c=0.228 Fairly good
24 a=1.414, b=1.097, c=0.253 Poor
30 a=1.392, b=0.925, c=0.231 Fairly good
33 a=1.767, b=0.762, c=0.220 Fairly good
42 a=2.130, b=0.849, c=0.284 Fairly god
Table 3 indicates that four items (3,8,15, and 24) were classified as poor items, two items (18 and 19 ) as good items while nine items (7,11,13, 14,20, 23,30, 33,42), are classified as fairly good items
Discussion on Results
Fifteen items out of the fifty items of the MAT test fitted the 3PLM of the study and they are items 3, 7, 8, 11, 13, 14, 15, 18, 19, 20, 23, 24, 30, 33, 42 and their difficulty indices are between 0.925 for item 30 and 1.168 for item 15, their discrimination indices were between 1.212 for item 19 and 2.130 for item 42, while their guessing parameters were between 0.168 for item 13 and 0.284 for item 42. Conversely thirty-five items of the MAT did not fit the 3PLM. Their discrimination indices were between 0.411 for item 1 and 2.095 for item 39, while difficulty indices were between -0.251 and 1.263 while the guessing indices are between 0.136 for item 32 and 0.352 for item 1. These thirty-five items could not fit the 3PLM due to several weakness noticed in their item parameters especially in the standard error of estimations. Item 1 had the lowest discrimination of 0.411 while other items were well-discriminated, their inability to fit the model could beat tribute to too low or too high difficulty index or very high guessing factor or a combination of both (see table 1). It is also necessary to determine the quality of these items using IRT (3PL) model. The basic criteria were that the item must be able to discriminate very well among the examinees i.e. must have a high value of item discrimination (a-value), a value of greater or equal to 1 ( a ≥ 1) is desirable f o r a g o o d i t e m . T he item difficulty value (b-value) between -0.5 to + 1.0 (or values very near to–1 to + 1), any b-value greater than 1 (b>1) is considered as a bit difficult item, and since all test items should have a minimum difficulty of b= 0.00 and a low guessing value (c-value) very close to 0.00.
For the present study, the maximum value for the guessing parameter stands at 0.20 since there were four distracters, in addition to the item key, therefore c-parameter greater than 0.20 for an item could be considered to have high guessing probability. Nevertheless, the determination of good item is a product of the interaction of the three parameters considered for each item.
For good test items, the discrimination parameter value a must be greater or equal to 1. The value of the difficulty parameter b should be from 0.5 to +1, any test item with value above + 1 would be considered as difficult. Any test item with a ‘b-value’ less than 0.5 was considered as easy item. For the c-value, it should be between 0.00 to 0.20 for test with five distracters, test items with c-values greater than 0.20 was considered as an item with a high probability of guessing the answer correctly and such test items would be classified as not good test items (Adedoyin & Mokobi, 2013). Some items classified as poor items could be modified to become an acceptable test item, for example:
Item 3 with a =1.416, b =1.144, and c =0.277. This item discriminates very well between low and high ability examinees but a difficult item and has probability of guessing of 0.277 (c >0.20), it is classified poor item, it could be modified to be a good item.
Item 7 with a = 1.401, b=1.037, and c=0.179. This item differentiates well between the high and low ability examinees. The item is a bit difficult (a>1) and guessing parameter within limit, it is classified as fairly good item.
Item 8 with a=1.603, b=1.034, and c= 0.284 is classified as poor item because it differentiates between high ability and low ability examinees, it is difficult and has guessing parameter 0.284 which is greater than 0.20. Item 11 with a=1.522, b=0.995, and c=0.270 is classified as fairly good item, it discriminates between the high ability and low ability examinees with difficulty index approximately 1 with guessing index somewhat high. Item 13 with a=1.953, b=1.042, and c=0.168. This item is a fairly good item because the item discrimination value indicates that it differentiates between the high ability and low ability examinees. The item difficulty value (b=1.042) is very close to1 and the value of the guessing parameter is close to 0.20.
Item 14 with a= 1.640, b=1.153, c=0,191. This item is a fairly good item because the item discrimination value indicates that it differentiates between the high ability and low ability examinees very well. The item though difficult and the value of the guessing parameter is close to 0.20.
Item 15 with a=1.300, b=1.168, and c=0.259. This item is a poor item although the item discrimination value indicates that it differentiates between the high ability and low ability examinees. The item is very difficult and the c-value of the item is higher than 0.20.
Item 18 with a=1.740, b=0.992, and c=0.196: This item is a good item because the item discrimination value indicates that it differentiates between the high ability and low ability examinees very well. The item difficulty is close to1 and the value of the guessing parameter is close to 0.20.
Item 19 with a=1.212, b=0.954, and c=0.220: This item is a good item because the item discrimination value indicates that it differentiates between the high ability and low ability examinees very well. The item difficulty is close to 1 and the value of the guessing parameter is close to 0.20.
Item 20 with a=1.522, b=1.020, and c=0.220: This item is a fairly good item because the item discrimination value indicates that it differentiates between the high ability and low ability examinees. The item difficulty value (b=1.020) is very close to 1 and the value of the guessing parameter is close to 0.20.
Item 23 with a=1.298, b=0.961, and c=0.228. This item is a fairly good item because the item discrimination value indicates that it differentiates between the high ability and low ability examinees. The item difficulty value (b=0.961) is very close to 1 and the value of the guessing parameter is close to 0.20.
Item 24 with a=1.414,b=1.097, and c=0.253: This item discriminates very well between low and high ability examinees but a difficult item and has probability of guessing of 0.253 (c>0.20) it is classified poor item. Item 30 with a=1.392, b=0.925, and c=0.231. This item is a fairly good item because the item discrimination value indicates that it differentiates between the high ability and low ability examinees. The item difficulty value (b=0.925) is very close to 1 and the value of the guessing parameter is close to 0.20.
Item 33 with a=1.767, b=0.762, c=0.220: This item is a fairly good item because the item discrimination value indicates that it differentiates between the high ability and low ability examinees. The item has medium difficulty value (b= 0.762) and the value of the guessing parameter is close to 0.20.
Item 42. a=2.130, b=0.849, c= 0.284. This item is classified as fairly good item because the item has high discrimination value which indicates that it differentiates between the high ability and low ability examinees very well. The item has medium difficulty value (b=0.849) and though the value of the guessing parameter is high a bit.
Recommendation
It is therefore recommended that examination bodies should engage the service of expert in the development and construction of assessment items and that three-parameter latent model be used to ascertain the credibility of achievement test items by removing items disposed to guessing and hence ensure quality test items.
Furthermore, mathematics achievement test should fulfill item response theory assumption
Conclusion
From the findings of the study it was concluded that three-parameter model is indispensible model for a high quality test that will provide reliable information concerning the students and the test items.
References
[1] Adedoyin, O.O. & Mokobi, T. (2013). Using IRT psychometric analysis in examining the quality of junior certificate mathematics test items. International Journal of Asian SCIENCE, 3(4): 992-1011
[2] Hambleton, R. K„ & Swaminathan, H. (1985): Item Response Theory Principles and Applications. Boston, MA: Kluwer Academic Publishers.
[3] Harwell, M.R., Baker, F.B., & Zwarts, M. (1998). Item parameter estimation via marginal maximum likelihood and EM algorithms. Journal of Education Statistics, 13,243-271.
[4] Jayanthi, J. (2014) Development and validation of an achievement test in mathematics. International Journal of Mathematics and Statistics Invention, 2 (4), 40-46
[5] Ker, H.W. (2013). Trend analysis on mathematics achievement. A comparative study using TIMSS data. Universal Journal of Educational Research 1(3) 200-203.
[6] Kpolovie, P.J. (2010). Advanced Research Methods. New Owerri: Springfield Publishers Ltd
[7] Obinne, A.D.E. (2011). A psychometric analysis of two major examinations in Nigeria: standard error of measurement. Int J. Edu Sci, 3(2):137-144
[8] Obinne, A.D.E. (2012). Using IRT in determining test item prone to guessing. World Journal of Education. Vol.1,91-95 [9] Onunkwo, G.I.N. (2002). Fundamentals of educational measurement and evaluation. Owerri Ontisha: Cape publishers
international.
[10] Srivastav, P. (2013). Mathematics meaning, importance and uses category. Essay paragraphs and article November 8. [11] Vilkomir T, & O’Donoghue J. (2009). Using components of mathematical ability for initial development and identification of