IJPBCS
Genetic Variability, Heritability and Genetic Advance Analysis
in Upland Rice (
Oryza sativa
L.) Genotypes for Yield and Yield
Related Traits in Benishangul Gumuz, Ethiopia
1
Atsedemariyam Tewachew*,
2Wassu Mohammed,
3Alemayehu Assefa
1,2,3Pawe Agricultural Research Centre, Haramaya University and Ethiopian Institute of Agricultural Research, Ethiopia The experiment was conducted to assess genetic variability, heritability and genetic advance for yield and yield related traits in some upland rice genotypes. A total of 23 rice genotypes were evaluated in a randomized complete block design with three replications in 2017 at Pawe and Assosa. Analysis of variance revealed significant difference among the genotypes for most of the traits at individual and across locations, and error variances of the two locations were homogenous for most of the traits including grain yield. Moreover, the genotypes showed wider variability for grain yield in the range between 3707-6241kg/ha, 4853-7282kg/ha and 4280-6761kg/ha at Pawe, Assosa and over locations, respectively. A relatively high (>20%) phenotypic and genotypic coefficient of variations were estimated merely for number of unfilled grains per panicle. High heritability estimates (> 60%) were obtained for all of the traits, except plant height and Protein content. A relatively high genetic advance was obtained for traits like unfilled grains per panicle and fertile tiller per plant. Thus, this study revealed that there was higher genetic variability among the tested genotypes, which could be potentially exploited in future breeding programs.
Key words: Genetic advance, Genetic variability, Heritability, Upland Rice and Yield related traits. INTRODUCTION
Rice (Oryza sativa L.) is one of the most important food crops in the world. It is a staple food crop for more than half of the world’s human population. Rice contains more than 20 species. However, only two species are economic importance of which Oryza sativa L. cultivated in Southeast Asian countries and Japan, and Oryza glaberrima Steud cultivated in West Africa. Rice grain contains 75 to 80% starch, 12% water and 7% protein (Okoet al., 2012). China, India, Indonesia, Bangladesh and Viet Nam are the major producing countries in the world (FAOSTAT, 2014). Rice was introduced in Ethiopia in the 1970s (MoARD, 2010). However, it has been cultivated in small pocket areas though the country has suitable ecologies for rice productions but unsuitable for production of other food crops. In the country, four rice ecosystems are identified and these are: upland rice, hydrophilic (rain fed lowland) rice, irrigated lowland ecosystem, paddy rice (with or without irrigation) (MoARD, 2010). The national average yield of rice in Ethiopia is 2.81 ton/ha (CSA, 2017), which is much lower than the world’s average rice yield of
4.6 ton/ha (FAOSTAT, 2017). In Ethiopia, rice variety development is mainly through introduction and then selection out of breeding materials. The development of new varieties requires knowledge about the genetic variability in the germplasm being handled by breeder. The knowledge about genetic variability can help to know if these variations are heritable or non-heritable. The magnitude of variation due to heritable component is very important because, it would be a guide for selection of parents for crop improvement (Dutta et al., 2013). Considering the importance of generating information on genetic variability, heritability and genetic advance that could be help development of high yielding rice genotypes as pre-requisite for breeding program.
*Corresponding Author: Atsedemariyam Tewachew, Pawe Agricultural Research Centre, Haramaya University and Ethiopian Institute of Agricultural Research, Ethiopia. Email: [email protected]
International Journal of Plant Breeding and Crop Science
Vol. 5(3), pp. 437-443, December, 2018. © www.premierpublishers.org.ISSN: 2167-0449
Tewachew et al. 438
Further, information on the association of agro-morphological and grain quality traits in rice breeding programs will help to select the most desirable genotype(s) leading to evolution of new rice varieties. Therefore, present research was conducted to assess genetic variability, heritability and genetic advance of upland rice genotypes to understand the mechanism of genetic variation and further selection of genotypes on strong genetic basis.
MATERIALS AND METHODS
The experiment was conducted in Benishangul Gumuze region at two locations, namely Assosa and Pawe Agricultural Research Center (PARC) during the main cropping season of 2017.PARC is located 575Kmfrom Addis Ababa. Its geographical location is between 11015’and 11023” North latitude and 36030’ East longitudes at an altitude of 1120 meters above sea level and the soil type of vertisol with clay loam texture. A total of 23 upland rice genotypes wereobtained from Fogera National Rice Research and Training Center (FNRRTC). The genotypes were introduced from Africa Rice Center and EMBRAPA (Brazilian Agricultural Research Enterprise). The experiment was conducted in Randomized Complete Block Design (RCBD) with three replications. A plot consisting six rows of 5 m long by 1.2m width (6 m2) with spacing of 0.2 m between rows, 0.3 m between plots and 1.5 m between blocks was used. The seed rate of 60 kg/h was used and a seed was drilled in a row. The recommended fertilizer urea and DAP (diammonium phosphate) was applied at a rate of 64 N and 46 P2O5 kg ha-1. Data on grain yield and other important agronomic traits and quality traits were collected on plot and individual plant basis at each location. Crop phenology parameters were registered by visual observation of plants grown in a net plot, growth characters were measured from pre-tagged 5 randomly taken plants from four central rows while yield and yield components were measured plants from 4m2 net plots. The grain quality parameter was measured from randomly taken grain samples from each plot.
Data Analysis
Analysis of variance (ANOVA) for two locations was computed for all data recorded using the statistical analysis software computer program (SAS Ins, 2014). Genotypic means were compared following Fisher’s Least Significant Difference (LSD) test at 5% levels of probability. The following linear additive model was used:
Yijk= μ + Gi+ Lj+ (G x L)ij+ Rj(k)+ Eijk Where;
Yijk is the observation on the ith genotype in the jth location in the kth replication,
μ is the general mean,
Gi is the fixed effect of the jth genotype, Lj is the effect of the jth location, (G x L)
ij is the interaction of the jth genotype with jth location, Rk (j)is the effect of kth randomized block within thejth location and Eijk is the experimental error associated within the ijkth observation.
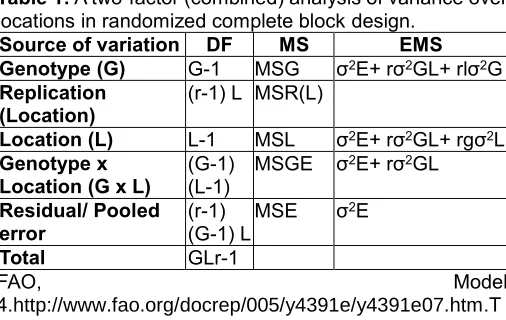
Table 1: A two-factor (combined) analysis of variance over locations in randomized complete block design.
Source of variation DF MS EMS
Genotype (G) G-1 MSG σ2E+ rσ2GL+ rlσ2G Replication
(Location) (r-1) L MSR(L)
Location (L) L-1 MSL σ2E+ rσ2GL+ rgσ2L Genotype x
Location (G x L) (G-1) (L-1) MSGE σ
2E+ rσ2GL Residual/ Pooled
error (r-1) (G-1) L MSE σ 2E
Total GLr-1
FAO, Model
4.http://www.fao.org/docrep/005/y4391e/y4391e07.htm.T he F-test for genotype, location and genotype x location mean squares is against pooled error.
Where, r = number of replications; G = number of genotypes; L = number of locations, MSR(L) = mean square due to replications over location; MSG = mean square due to genotypes; MSL= mean square due to locations, MSGE= mean square of genotype x location interaction, MSE = mean square of error; σ2E+ rσ2GL+ rlσ2G, σ2E+ rσ2GL+ rgσ2L and σ2E+ rσ2GL are variances or expected mean squares due to genotype, location and genotype x location interaction, respectively, whileσ2E is expected mean squares due to error.
Phenotypic and Genotypic Variability Analysis
The phenotypic and genotypic coefficient of variation was computed for each location using the formula suggested by Burton and de Vane (1953) as follows.
Genotypic variance (σ2g) =𝑀𝑔−𝑀𝑒 𝑟
Where, σ2g = genotypic variance, Mg= mean square of genotype, Me = mean square of error, r = number of replications
Phenotypic Variance (σ2p) = σ2g + σ2e
Where, σ2g = Genotypic variance, σ2e = Environmental variance, σ2p = phenotypic variance
Where: PCV= Phenotypic coefficient of variation, GCV= Genotypic coefficient of variation, 𝐱 = population mean of the character being evaluated.
Sivasubramaniah and Menon (1973), phenotypic coefficients of variation and genotypic coefficients of variation were categorized as low (0-10%), moderate (10-20%) and high (>20%).
Int. J. Plant Breed. Crop Sci. 439
Heritability and Genetic Advance
Broad Sense (b.s) heritability values were estimated for each location using the formula adopted by Falconer et al (1996) as follows
𝐇𝟐 =𝛔𝟐𝐠
𝛔𝟐𝐩𝑿𝟏𝟎𝟎Where, H
2 = heritability in broad sense, σ2p = phenotypic variance, σ2g = Genotypic variance Genetic advance in absolute unit (GA) and percent of the mean (GAM), assuming selection of superior 5% of the genotypes were estimated for each location in accordance with the methods illustrated by Johnson et al. (1955) as:
GA = K * SDp * H2
Where, GA = Genetic advance, SDp = Phenotypic standard deviation on mean basis of the character. H2 = Heritability in the broad sense, k = the standardized selection differential at 5% selection intensity (K = 2.063).
The heritability values as percentage could be categorized as low (<30%), medium (30-60%) and high (>60%) (Robinson et al., 1949).
Genetic advance as percent of mean was estimated as follows:
GAM =GA
X X100
Where, GAM = Genetic advance as percent of mean, GA = Genetic advance.X= Population mean of the character being evaluate.
Johson et al. (1955) genetic advance as percent of mean is classified as low (<10%), moderate (10-20%) and high (>20%).
RESULTS AND DISCUSSION
Analysis of Variance
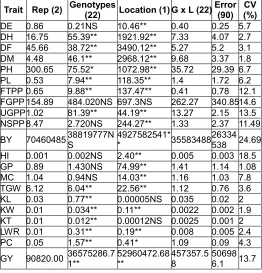
The analysis of variance revealed that the error mean squares (EMS) ratio was <3 for all traits except days to heading and flowering. Moreover, the calculated F-values were non-significant for half of the traits including grain yield. Therefore, combined analysis of variance over locations was performed (Table 2).The performance of genotypes was evaluated based on the pooled mean values for the traits that the homogenous error variances and non-significant mean squares for genotype x location were evident. The results of combined ANOVA over locations revealed that the mean squares for genotype and location were significant for all traits except for kernel length and kernel thickens in which mean squares for location were non-significant. The significant mean square due to genotypes indicated the existence of variability
among the genotypes, which could be an opportunity to apply selection breeding to improve the respective traits that genotypes exhibited significant differences. Similar findings were also presented by Ogunbayo et al., 2014; Seyou et al., 2015; Ekka et al., 2015; Munganyinka et al.,
2015 and Lingaiah et al., 2014. The mean squares for genotype x location interaction (GLI) were significant for days to maturity, unfilled grains per panicle, kernel length, kernel thickens, length width ratio and protein content whereas mean squares for GLI were non-significant for the rest of the traits. Moreover, the contribution of genotype x location to the total sum square was much lower than the contribution of genotype and location. This implies that the variation observed among genotypes could be explained by the inherent characteristics of the genotypes and location effects for most of the traits.
Table 2: Mean square values of characters from combine analysis over two locations (Pawe and Assosa) during 2017.
Trait Rep (2) Genotypes (22) Location (1) G x L (22) Error (90) (%) CV
DE 0.86 0.21NS 10.46** 0.40 0.25 5.7 DH 16.75 55.39** 1921.92** 7.33 4.07 2.7 DF 45.66 38.72** 3490.12** 5.27 5.2 3.1 DM 4.48 46.1** 2968.12** 9.68 3.37 1.8 PH 300.65 75.52* 1072.98** 35.72 29.39 6.7 PL 0.53 7.94** 118.35** 1.4 1.72 6.2 FTPP 0.65 9.88** 137.47** 0.41 0.78 12.1 FGPP 154.89 484.020NS 697.3NS 262.27 340.85 14.6 UGPP 1.02 81.39** 44.19** 13.27 2.15 13.5 NSPP 8.47 2.720NS 244.27** 1.33 2.37 11.49 BY 70460485 38819777NS 4927582541** 35583488 26334538 24.69 HI 0.001 0.002NS 2.40** 0.005 0.003 18.5 GP 0.89 1.430NS 74.99** 1.41 1.14 1.08 MC 1.04 0.94NS 14.03** 1.16 1.03 7.8 TGW 6.12 6.04** 22.56** 1.12 0.76 3.6 KL 0.03 0.77** 0.00005NS 0.035 0.02 2 KW 0.01 0.034** 0.11** 0.0022 0.002 1.9 KT 0.01 0.012** 0.00012NS 0.0025 0.001 2 LWR 0.01 0.31** 0.19** 0.008 0.005 2.4 PC 0.05 1.57** 0.41* 1.09 0.09 4.3 GY 90820.00 36575286.71** 52960472.68** 457357.58 506986.1 13.7
Tewachew et al. 440
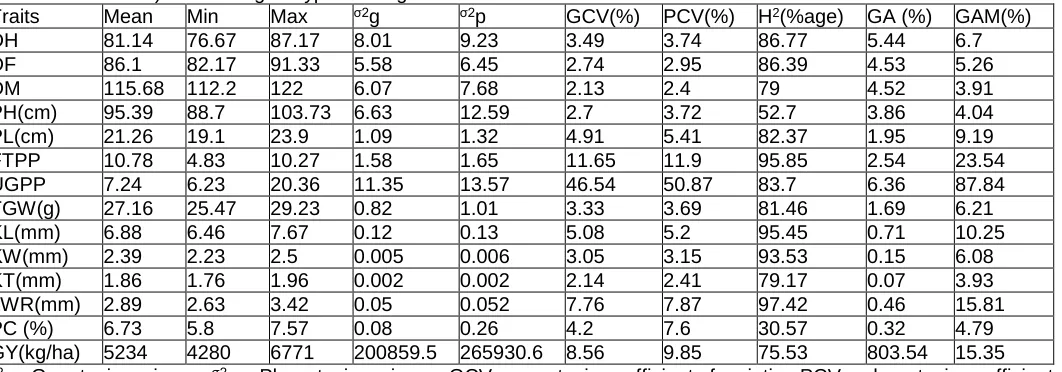
Table 3: Estimates of variance components,broad sense heritability and genetic advance evaluated over two locations (Pawe and Assosa) in 23 rice genotypes during 2017.
Traits Mean Min Max σ2g σ2p GCV(%) PCV(%) H2(%age) GA (%) GAM(%) DH 81.14 76.67 87.17 8.01 9.23 3.49 3.74 86.77 5.44 6.7 DF 86.1 82.17 91.33 5.58 6.45 2.74 2.95 86.39 4.53 5.26 DM 115.68 112.2 122 6.07 7.68 2.13 2.4 79 4.52 3.91 PH(cm) 95.39 88.7 103.73 6.63 12.59 2.7 3.72 52.7 3.86 4.04 PL(cm) 21.26 19.1 23.9 1.09 1.32 4.91 5.41 82.37 1.95 9.19 FTPP 10.78 4.83 10.27 1.58 1.65 11.65 11.9 95.85 2.54 23.54 UGPP 7.24 6.23 20.36 11.35 13.57 46.54 50.87 83.7 6.36 87.84 TGW(g) 27.16 25.47 29.23 0.82 1.01 3.33 3.69 81.46 1.69 6.21 KL(mm) 6.88 6.46 7.67 0.12 0.13 5.08 5.2 95.45 0.71 10.25 KW(mm) 2.39 2.23 2.5 0.005 0.006 3.05 3.15 93.53 0.15 6.08 KT(mm) 1.86 1.76 1.96 0.002 0.002 2.14 2.41 79.17 0.07 3.93 LWR(mm) 2.89 2.63 3.42 0.05 0.052 7.76 7.87 97.42 0.46 15.81 PC (%) 6.73 5.8 7.57 0.08 0.26 4.2 7.6 30.57 0.32 4.79 GY(kg/ha) 5234 4280 6771 200859.5 265930.6 8.56 9.85 75.53 803.54 15.35 σ2g= Genotypic variance, σ2p = Phenotypic variance, GCV = genotypic coefficient of variation PCV = phenotypic coefficient of variation, H2 (%age) = heritability in broad sense GA= Genetic Advance, GAM (%) = genetic advance as percent of mean at 5% selection intensity DH= days to heading, DF= days to flowering, DM= days to maturity, PH= plant height, PL= panicle length, FTPP=fertile tiller per plant, UGPP = unfilled grains per panicle, TGW=thousand grain weight, KL=kernel length, KW= kernel width, KT= kernel thickens, LWR= length width ratio, PC= Protein content and GY= grain yield. Mean Performance of Genotypes
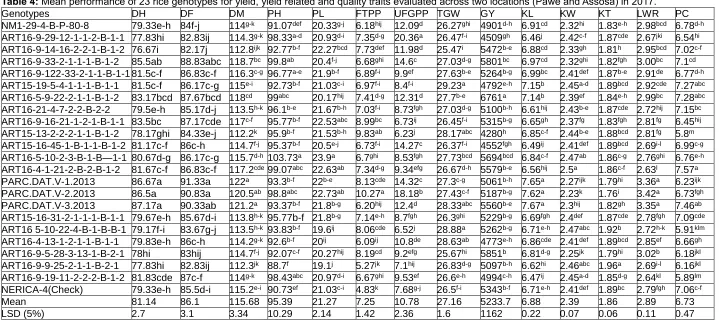
The genotypes had 115.7 days of grand mean of maturit. Eight genotype (ART15-13-2-2-2-1-1-B-1-2, NM1-29-4-B-P-80-8, ART16-9-14-16-2-2-1-B-1-2, ART16-21-4-7-2-2-B-2-2, ART15-16-31-2-1-1-1-B-1-1, ART16 5-10-22-4-B-1-B-B-1, ART16-9-9-25-2-1-1-B-2-1, ART16-9-19-11-2-2-2-B-1-2) were identified with the earliest maturity varying from 112 to 114 days of mean maturity (Table 4). Osman
et al.(2012) and Bitewet al.(2016)evaluated 13 and 22 rice genotypes respectively and found that genotypes had variation in days to maturity from 88 to 110and 104 to115 days respectively. The genotypes showed a wide range of variation for plant height, panicle length and fertile tiller per plant which ranged from 88.7 to 103.73 cm, 19.1 to 23.9 cm and 4.87 to 10.27 per plant respectively. Akinwale et al. (2011) also reported similar findings.
A wide range of variability was observed in panicle length ranged from 19.1to 23.9cm for ART16-9-9-25-2-1-1-B-2-1 and ART16-5-10-2-3-B-1-B—1-1 with a mean value of 21.27. The genotypes also showed a wide range of variation for number of fertile tiller per plant and number of unfilled grains per panicle. The mean values of number of fertile tiller per plant and unfilled grains per panicle were ranged from 4.83 to 10.27 and 6.23 to 20.36 with mean value of 7.25 and 10.78 respectively. The three genotypes (ART16-5-9-22-2-1-1-B-1-2, ART16-9-5-28-3-13-1-B-2-1 and ART16-9-33-2-1-1-1-B-1-2) showed highest mean values of grain yield significantly different from other genotypes that had about 5801 to 6761kg grain yield per hectare. Abebe et al. (2017) evaluated 34rice genotypes and reported grain yield in the range between 2886 and 6759 kg/ha which showedwide range of variation among the varieties.
The genotypes showed variation for kernel length, kernel width and kernel thickness ranged from 6.46 to 7.67mm, 2.23 to 2.5mm and 1.76 to 1.96mm respectively, with the mean value of 6.88mm, 2.39mm and 1.86mm respectively. The three genotypes (PARC.DAT.V-1.2013, PARC.DAT.V-2.2013 and PARC.DAT.V-3.2013) had significantly longest kernel length. Girma et al. (2016) also reported there are significant difference among 15 rice genotypes for kernel length, breadth, thickness and length-to-breadth ratio. The mean value of length width ratioand protein content ranged from 2.63 to 3.42mm and 5.8 to 7.57%, with mean value of 2.89mm and 6.73% respectively. Similar findings were reported by Diako et al.
(2011) protein content ranged from 5.10 to 5.9% and Girma et al. (2016) found protein content of 5.3 to 10.55% from 15 rice genotypes.
Estimates of Variance Components
Int. J. Plant Breed. Crop Sci. 441
Table 4: Mean performance of 23 rice genotypes for yield, yield related and quality traits evaluated across two locations (Pawe and Assosa) in 2017.
Genotypes DH DF DM PH PL FTPP UFGPP TGW GY KL KW KT LWR PC
NM1-29-4-B-P-80-8 79.33e-h 84f-j 114g-k 91.07def 20.33g-j 6.18hij 12.09d 26.27ghi 4901d-h 6.91cd 2.32hi 1.83e-h 2.98bcd 6.78d-h ART16-9-29-12-1-1-2-B-1-1 77.83hi 82.83ij 114.3g-k 98.33a-d 20.93d-i 7.35d-g 20.36a 26.47f-i 4509gh 6.46j 2.42c-f 1.87cde 2.67jki 6.54hi ART16-9-14-16-2-2-1-B-1-2 76.67i 82.17j 112.8ijk 92.77b-f 22.27bcd 7.73def 11.98d 25.47i 5472b-e 6.88cd 2.33gh 1.81h 2.95bcd 7.02c-f ART16-9-33-2-1-1-1-B-1-2 85.5ab 88.83abc 118.7bc 99.8ab 20.4f-j 6.68ghi 14.6c 27.03d-g 5801bc 6.97cd 2.32ghi 1.82fgh 3.00bc 7.1cd ART16-9-122-33-2-1-1-B-1-1 81.5c-f 86.83c-f 116.3c-g 96.77a-e 21.9b-f 6.89f-i 9.9ef 27.63b-e 5264b-g 6.99bc 2.41def 1.87b-e 2.91de 6.77d-h ART15-19-5-4-1-1-1-B-1-1 81.5c-f 86.17c-g 115e-i 92.73b-f 21.03c-i 6.97f-i 8.4f-i 29.23a 4792e-h 7.15b 2.45a-d 1.89bcd 2.92cde 7.27abc ART16-5-9-22-2-1-1-B-1-2 83.17bcd 87.67bcd 118cd 99abc 20.17hij 7.41d-g 12.31d 27.7b-e 6761a 7.14b 2.39ef 1.84e-h 2.99bc 7.28abc ART16-21-4-7-2-2-B-2-2 79.5e-h 85.17d-j 113.5h-k 96.1b-e 21.67b-h 7.03f-i 8.73fgh 27.03d-g 5100b-h 6.61hij 2.43b-e 1.87cde 2.72hij 7.15bc ART16-9-16-21-1-2-1-B-1-1 83.5bc 87.17cde 117c-f 95.77b-f 22.53abc 8.99bc 6.73ij 26.45f-i 5315b-g 6.65gh 2.37fg 1.83fgh 2.81fg 6.45hij ART15-13-2-2-2-1-1-B-1-2 78.17ghi 84.33e-j 112.2k 95.9b-f 21.53b-h 9.83ab 6.23j 28.17abc 4280h 6.85c-f 2.44b-e 1.88bcd 2.81fg 5.8m ART15-16-45-1-B-1-1-B-1-2 81.17c-f 86c-h 114.7f-j 95.37b-f 20.5e-j 6.73f-i 14.27c 26.37f-i 4552fgh 6.49ij 2.41def 1.89bcd 2.69i-l 6.99c-g ART16-5-10-2-3-B-1-B—1-1 80.67d-g 86.17c-g 115.7d-h 103.73a 23.9a 6.7ghi 8.53fgh 27.73bcd 5694bcd 6.84c-f 2.47ab 1.86c-g 2.76ghi 6.76e-h ART16-4-1-21-2-B-2-B-1-2 81.67c-f 86.83c-f 117.2cde 99.07abc 22.63ab 7.34d-g 9.34efg 26.67d-h 5579b-e 6.56hij 2.5a 1.86c-f 2.63l 7.57a PARC.DAT.V-1.2013 86.67a 91.33a 122a 93.3b-f 22b-e 8.13cde 14.32c 27.3c-g 5061b-h 7.65a 2.27ijk 1.79hi 3.36a 6.23ijk PARC.DAT.V-2.2013 86.5a 90.83a 120.5ab 98.8abc 22.73ab 10.27a 18.18b 27.43c-f 5187b-g 7.62a 2.23k 1.76i 3.42a 6.73fgh PARC.DAT.V-3.2013 87.17a 90.33ab 121.2a 93.37b-f 21.8b-g 6.20hij 12.4d 28.33abc 5560b-e 7.67a 2.3hij 1.82gh 3.35a 7.46ab ART15-16-31-2-1-1-1-B-1-1 79.67e-h 85.67d-i 113.8h-k 95.77b-f 21.8b-g 7.14e-h 8.7fgh 26.3ghi 5229b-g 6.69fgh 2.4def 1.87cde 2.78fgh 7.09cde ART16 5-10-22-4-B-1-B-B-1 79.17f-i 83.67g-j 113.5h-k 93.83b-f 19.6ij 8.06cde 6.52j 28.88a 5262b-g 6.71e-h 2.47abc 1.92b 2.72h-k 5.91klm ART16-4-13-1-2-1-1-B-1-1 79.83e-h 86c-h 114.2g-k 92.6b-f 20ij 6.09ij 10.8de 28.63ab 4773e-h 6.86cde 2.41def 1.89bcd 2.85ef 6.66gh ART16-9-5-28-3-13-1-B-2-1 78hi 83hij 114.7f-j 92.07c-f 20.27hij 8.19cd 9.2efg 25.67hi 5851b 6.81d-g 2.25jk 1.79hi 3.02b 6.18jkl ART16-9-9-25-2-1-1-B-2-1 77.83hi 82.83ij 112.3jk 88.7f 19.1j 5.27jk 7.1hij 26.83d-g 5097b-h 6.62hi 2.46abc 1.96a 2.69i-l 6.16jkl ART16-9-19-11-2-2-2-B-1-2 81.83cde 87c-f 114g-k 98.43abc 20.97d-i 6.67ghi 9.53ef 26.6e-h 4994c-h 6.47ij 2.45a-d 1.85d-g 2.64kl 5.89lm NERICA-4(Check) 79.33e-h 85.5d-i 115.2e-i 90.73ef 21.03c-i 4.83k 7.68g-j 26.5f-i 5343b-f 6.71e-h 2.41def 1.89bc 2.79fgh 7.06c-f Mean 81.14 86.1 115.68 95.39 21.27 7.25 10.78 27.16 5233.7 6.88 2.39 1.86 2.89 6.73 LSD (5%) 2.7 3.1 3.34 10.29 2.14 1.42 2.36 1.6 1162 0.22 0.07 0.06 0.11 0.47 indicated that the estimates of PCV were slightly higher than the corresponding
GCV estimates for all the traits studied in rice and indicated the characters were less influenced by the environment.
High value of PCV and GCV were obtained for only unfilled grains per panicle. The results were also in agreement with the earlier reports of (Ekka et al., 2015 and Fathelrahman et al., 2015). High PCV and GCV values of these traits suggested that the possibility of improving the traits through selection. Kernel thickness, Kernel width and length-to-width ratio showed relatively similar PCV and GCV values. This indicates that there is low environmental influence for the phenotypic expression of these traits and the phenotypic variation of these traits is more of due to their genotypic variations.
Heritability and Expected Genetic Advance
Tewachew et al. 442
length, thousand grain weight; Babu et al. (2012) for days to flowering and Rashid et al. (2017) for days to flowering, days to maturity, panicle length, unfilled grains per panicle and thousand grain weight reported high estimates of heritability. Unfilled grains per panicle showed high heritability coupled with high genotypic coefficient of variation. High heritability coupled with high genotypic coefficient of variation of the traits indicated that this trait may respond effectively to phenotypic selection.
The estimated value of expected genetic advance expressed as percentage of mean ranged from 3.91% for days to maturity to 87.84% for number of unfilled grains per panicle. With this range, a relatively high expected genetic advance was obtained from traits with high and moderate heritability but with better genotypic coefficient of variation. According to Johson et al. (1955) genetic advance as percent of mean is classified as low (<10%), moderate (10-20%) and high (>(10-20%). Based on this argument, in the present study, traits such as unfilled grains per panicle (87.87%) and fertile tiller per plant (23.54%) gave high genetic advance as percent of mean, while moderate genetic advance as percent of mean was computed for kernel length (10.25%), length width ratio (15.81%) and grain yield (15.35%). The present finding is corresponding to the work of Abebe et al. (2017) for number of unfilled grains per panicle. Bitew (2016) also reported moderate genetic advance for grain yield. Generally, from this study, traits such as unfilled grains per panicle and fertile tiller per plant have the potential to respond positively to selection because of their better broad sense heritability coupled with relatively high genetic advance.
CONCLUSION
This study identified the existence of adequate genetic variability among 23 tested genotypes for grain yield andrelated traits. The genotypes ART16-5-9-22-1-1-B-1-, ART16-9-5-28-3-13-1-B-2-1 and ART16-9-33-2-1-1-1-B-1-2 had shown highest grain yield significantly superiors from rest of the genotypes. Thetraitfertile tillers per plant, unfilled grains per panicle and grain yield have great potential which may respond positively to selection owing to their better broad sense heritability coupled with high genetic advance. Hence, the information generated from this present study can be helpful for, rice breeder to exploit genetic parameters for future rice breeding program. Although this study has been carried out for one season and at two locations, further evaluation of these breeding materials at more locations and year, different environments and agro-ecologies is advisable to confirm the promising results observed in the present study.
REFERENCES
Abebe T, Alamerew S, and Tulu, L. 2017. Genetic Variability, Heritability and Genetic Advance for Yield and its Related Traits in Rain fed Lowland Rice (Oryza sativa L.) Genotypes at Fogera and Pawe, Ethiopia.
Advances in Crop Science and Technology, 5(2): 1-8. Akinwale, M. G., Gregorio, G., Nwilene, F., Akinyele, B. O.,
Ogunbayo, S. A., and Odiyi, A. C. 2011. Heritability and correlation coefficient analysis for yield and its components in rice (Oryza sativa L.). African Journal of
Plant Science, 5(3): 207-212.
Babu, V.R., Shreya, K., Dangi, K. S., Usharani, G., and Nagesh, P. 2012. Genetic variability studies for qualitative and quantitative traits in popular rice ( Oryza sativa L .) Hybrids of India. International Journal of
Scientific and Research Publications,2(6): 1-5.
Bitew J. M., Mekbib, F. and Assefa, A., 2016. Genetic Variability among Yield and Yield Related Traits in Selected Upland Rice (Oryza sativa L. and Oryza glaberrima Steud) Genotypes in Northwestern Ethiopia.
World Scientific News 2(47): 62-74.
Burton GW, Devane EH (1953)Estimating heritability in tall fescue (Festucaarundinacea) from replicated clonal material. Agronomy Journal 45: 478-481.
Cochran, W.G., 1957. Analysis of covariance, its nature and uses. Biometrics,13(3):261-281
CSA (Central Statistical Agency).2017. Agricultural sample survey Report on area and Production of major crops. Central Statistical Agency of Ethiopia, Addis Ababa, Ethiopia, Statistical Bulletin 584.
Diako, C, Manful, J.T., Johnson P.N.T., Sakyi-Dawson, E.,Bediako-Amoa, B. and Saalia, F.K., 2011. Physicochemical Characterization of Four Commercial Rice Varieties in Ghana. Advanced Journal of Food Science and Technology. 3(3):196-202.
Dutta, P., Dutta, P. N. and Borua, P. K., 2013. Morphological traits as selection indices in rice: A statistical view. Universal Journal of Agricultural Research, 1(3): 85-96.
Ekka, R.E., Sarawgi, A.K. and Kanwar, R.R. 2015. Genetic variability and inter-relationship analysis for various yield attributing and quality traits in traditional germplasm of rice (Oryza sativa L.). Plant Archives, 15(2): 637-645.
Falconer, D.S., Mackay, T.F. and Frankham, R. 1996. Introduction to quantitative genetics (4th edn). Trends in Genetics, 12(7): 280.
FAOSTAT. 2014. Statistical data base. Food and Agriculture Organizations of the United Nations. Rome, Italia.
FAOSTAT .2017. Statistical database. Food and Agriculture Organizations of the United Nations. Fathelrahman, S.A., Alsadig, A.I. and Dagash, Y.I., 2015.
Genetic Variability, Heritability and Genetic Advance Analysis in Upland Rice (Oryza sativa L.) Genotypes for Yield and Yield Related Traits in BenishangulGumuz, Ethiopia
Int. J. Plant Breed. Crop Sci. 443
Girma, B.T., Mohammed, H. and Abegaz, K. 2016. Physical characteristics and nutritional quality of salt tolerant rice genotypes. Journal of Cereals and Oilseeds, 7(2): 7-13.
Johnson, H.W., Robinson, H.F. and Comstock, R. E. 1955. Estimates of genetic and environmental variability in soybeans 1. Agronomy journal 47: 314-318.
Khare, R., Singh, A.K., Eram, S. and Singh, P. K. 2015. Genetic variability, association and diversity analysis in upland Rice (Oryza sativa L). SAARC Journal of Agriculture,12(2), 40-51.
Konate, A.K.,Zongo, A.,Kam,H., and Sanni, A. 2015. Genetic variability and correlation analysis of rice (Oryza sativa L.) inbred lines based on agro-morphological traits, African Journal of Agricultural Research, 11(35), 3340-3346.
Lingaiah, N., Venkanna, V. and Cheralu, C. 2014. Genetic variability analysis in rice (Oryza sativa L.). International Journal of Pure and Applied Bioscience2(5): 203-204.
MoARD. 2010. Ministry of Agriculture and Rural Development National Rice research and development strategy of Ethiopia. MOARD, Addis Ababa, Ethiopia. MulugetaSeyoum M, SentayehuAlamerew and
KassahunBantte. 2012.Genetic Variability, Heritability, Correlation Coefficient and Path Analysis for Yield and Yield Related Traits in Upland Rice (Oryza sativa L.).
Journal of Plant Sciences, 7(1): 13. Munganyinka, E., Edama,R., Lamo, J., Gibson, P., Agri,I.J., and Agri, R. 2015. Heritability of resistance to rice yellow mottle virus disease and of yield related attributes in segregating generations of rice, 7(2):111-120.
Ogunbayo, S.A., Ojo, D.K., Sanni, K. A., Akinwale, M.G., Toulou, B., Shittu, A., Idehen, E.O., Popoola, A.R., Daniel, I.O. and Gregorio, G.B., 2014. Genetic variation and heritability of yield and related traits in promising rice genotypes (Oryza sativa L.). Journal of Plant Breeding and Crop Science, 6(11): 153-159.
Oko AO, Ubi BE, Efisue AA, Dambaba N 2012. Comparative analysis of the chemical nutrient composition of selected local and newly introduced rice varieties grown in Ebonyi State of Nigeria. International Journal of Agriculture.For. 2(2):16-23.
Osman, K.A., Mustafa, A.M., Ali, F., Yonglain, Z. and Fazhan, Q. 2012. Genetic variability for yield and related attributes of upland rice genotypes in semi-arid zone (Sudan). African Journal of Agricultural Research, 7(33): 4613-4619.
Rashid, M.M., Nuruzzaman, M., Hassan, L. and Begum, S.N. 2017. Genetic variability analysis for various yield attributing traits in rice genotypes. Journal of the
Bangladesh Agricultural University, 15(1): 15-19.
Robinson HF, Comstock RE, Harvey PH (1949). Estimates of heritability and the degree of dominance in com. Agronomy Journal.
Seyou Mulugeta, Alamerew, S., and Bantte, K.2015. Stability analysis of grain yield in rice genotypes across environments of Jimma Zone, Western Ethiopia, 7(3): 27-33.
Sivasubramanian S, Madhavamenon P. 1973. Genotypic and phenotypic variability in rice. Madras Agric J 60: 1093-1096
Srivastava, N., Babu, G. S., Singh, O. N., Verma., Pathak , S. K., Behra, M., Chanda, M. 2017. Genetic variation, heritability and diversity analysis of exotic upland rice (Oryza sativa L.) germplasms based on quantitative traits. The Pharma Innovation Journal, 6(12): 316-320
Accepted 24 November 2018
Citation: Tewachew A, Mohammed W, Assefa A (2018). Genetic Variability, Heritability and Genetic Advance Analysis in Upland Rice (Oryza sativa L.) Genotypes for Yield and Yield Related Traits in Benishangul Gumuz, Ethiopia. International Journal of Plant Breeding and Crop Science 5(3): 437-443.