S H O R T C O M M U N I C A T I O N
Open Access
Multicentre quantitative
68
Ga PET/CT
performance harmonisation
Daphne M. V. Huizing
1, Daniëlle Koopman
2, Jorn A. van Dalen
3, Martin Gotthardt
4, Ronald Boellaard
5,6,7,
Terez Sera
7, Michiel Sinaasappel
8, Marcel P. M. Stokkel
1and Berlinda J. de Wit-van der Veen
1** Correspondence:[email protected] 1
Department of Nuclear Medicine, Netherlands Cancer Institute, Amsterdam, The Netherlands Full list of author information is available at the end of the article
Abstract
Purpose:Performance standards for quantitative18F-FDG PET/CT studies are provided by the EANM Research Ltd. (EARL) to enable comparability of quantitative PET in multicentre studies. Yet, such specifications are not available for68Ga. Therefore, our aim was to evaluate68Ga-PET/CT quantification variability in a multicentre setting.
Methods:A survey across Dutch hospitals was performed to evaluate differences in clinical68Ga PET/CT study protocols.68Ga and18F phantom acquisitions were performed by 8 centres with 13 different PET/CT systems according to EARL protocol. The cylindrical phantom and NEMA image quality (IQ) phantom were used to assess image noise and to identify recovery coefficients (RCs) for quantitative analysis. Both phantoms were used to evaluate cross-calibration between the PET/CT system and local dose calibrator.
Results: The survey across Dutch hospitals showed a large variation in clinical 68
Ga PET/CT acquisition and reconstruction protocols. 68Ga PET/CT image noise was below 10%. Cross-calibration was within 10% deviation, except for one system to overestimate18F and two systems to underestimate the68Ga activity concentration. RC-curves for18F and68Ga were within and on the lower limit of current EARL standards, respectively. After correction for local68Ga/18F cross-calibration, mean68Ga performance was 5% below mean EARL performance specifications.
Conclusions:68Ga PET/CT quantification performs on the lower limits of the current EARL RC standards for18F. Correction for local68Ga/18F cross-calibration mismatch is advised, while maintaining the EARL reconstruction protocol thereby avoiding multiple EARL protocols.
Keywords:Quantification,68Gallium PET/CT, Image quality, Harmonisation
Introduction
The use of 68Gallium (68Ga)-labelled peptides for PET imaging has increased in the past years with the market authorisation for 68Ga/68Ge-generators. The main applica-tions include imaging of neuroendocrine tumours using somatostatin analogues and prostate cancer imaging using the prostate-specific membrane antigen [1, 2]. Though the interpretation of 68Ga-PET/CT is mainly based on visual assessment, quantitative measures should be used to evaluate or predict therapy response.
Previous experience with 18Fluorine (18F) expressed the need for standardisation of acquisition and reconstruction protocols in order to retrieve comparable quantitative
imaging data. The EANM Research Ltd. (EARL) provides an accreditation programme to ensure PET/CT system harmonisation in multicentre 18F-FDG PET/CT studies [3]. This approach is based on standardizing the recovery coefficient (RC) for six phantom spheres with different sizes, thereby minimising inter- and intra-institute variability. For other isotopes, quantification should be evaluated separately as isotope characteristics can result in different image quality and quantification accuracy. For example, Makris et al. studied89Zirconium (89Zr) PET and showed the need for a specific harmonisation step including post-reconstruction smoothing to enable comparable quantitative measures among PET/CT systems [4]. In contrast, a recent18F performance study showed that post-reconstruction filtering is not required for state-of-the-art PET/CT systems in relation to this isotope [5]. However, for68Ga, such studies are not yet available.
In general, PET quantification accuracy depends on reconstructions, noise, and spatial resolution [6]. For68Ga, the lower positron yield (89%), long positron range due to high initial positron energy (max 1.90 MeV, mean 0.84 MeV), short physical half-life (68 min) and small prompt gamma branching (3.2%, 1.077 MeV) may result in an inferior image quality compared to 18F [7]. Therefore, the aim of this study was to assess
68
Ga-PET/CT quantification accuracy and reproducibility in a multicentre setting based on EARL standards.
Materials and methods Clinical protocol evaluation
A survey among eight Dutch hospitals was performed to evaluate factors that affect quantification and to assess variability in clinical 68Ga-PET/CT acquisition protocols. Questions focussed on administered activity, PET/CT system, and acquisition- and reconstruction settings.
18
F and68Ga PET/CT phantom acquisitions
Eight European hospitals with 13 PET/CT systems performed phantom acquisitions, of which 11 systems were EARL accredited, but all had recoveries within the published EARL specifications. Six Biograph mCT systems (Siemens Healthineers, Erlangen, Germany), three Discovery systems (GE Healthcare, Milwaukee, WI, USA) and four Philips systems (Philips Healthcare, Eindhoven, The Netherlands) were included.
18
F and68Ga acquisitions were performed at the end of 2017 and beginning of 2018 with two phantoms which were prepared using a standardised procedure by experi-enced staff from each centre. First, the NEMA PET cylindrical phantom was filled with 6–13 kBq/ml of18F and68Ga. Second, the NEMA NU-2 Image Quality (IQ) phantom was imaged using a 1:10 ratio with 2.0 and 20.0 kBq/ml of18F and68Ga in background compartment and spheres (37, 28, 21, 17, 13, and 10 mm diameter), respectively. Acquisitions of both phantoms were performed with minimal two bed positions and at least 5 min per bed position. Images were reconstructed according to local settings, in-cluding corrections for decay, randoms, dead time, CT-based attenuation, and scatter.
Data analysis
Image quality was based on the RC of all six spheres, analysed by the EARL semi-automatic tool [5, 8]. The RCmax, RCpeak and RCmean were determined as a
func-tion of sphere size based on the maximum voxel value (RCmax), the 1.0 cm3
vol-ume with the maximised average value (RCpeak) and the mean value of 50%
isocontour of the maximum voxel value (RCmean) with contrast correction,
respect-ively. A spherical volume-of-interest (VOI) of ~ 300 ml in the centre of the cylin-drical phantom and ten VOIs in the background of the IQ phantom were used for local PET and dose calibrator cross-calibration. IQ phantom background volume was 9400 ml, unless specified otherwise by the institute.
Results
Eight Dutch hospitals provided their clinical acquisition- and reconstruction protocols (Table1), which showed to be different.
An overview of all PET/CT systems and reconstruction settings is provided in Table 2. For local cross-calibration, most systems performed within 10% deviation of the dose calibrator (Fig. 1). The median [IQR] ratio was 0.93 [0.91–0.98] and
Table 1Acquisition and reconstruction settings of clinical68Ga PET/CT imaging for prostate cancer
and neuroendocrine tumours. One hospital per row is presented
Site PET/CT system Reconstruction settings
Prostate cancer Neuroendocrine tumours
Minutes per bed position
Injected activity
Minutes per bed position
Injected activity
A Philips Gemini TOF 64
BLOB-OS-TF 4 mm 3i33ss
Pelvis: 4 Body: 3 1.5 MBq/kg (range 50– 250 MBq)
< 90 kg: 2.5
> 90 kg: 3.5
2.6 MBq/kg (range 100– 160 MBq)
B Philips Gemini TF and XL
Astonish iterative reconstruction
4 2.0 MBq/kg 4 2.6 MBq/kg
C Siemens mCT Flow
TrueX + TOF 2i21ss Gaussian 5mm
1.5 mm/s CTM 2.0 MBq/kg 2.5 100 MBq
D Philips Ingenuity TF
BLOB-OS-TF 4 mm 3i33ss
2 mm smooth B filter
NA 4 < 90 kg: 150
MBq > 90 kg: 200 MBq
E Siemens mCT TrueV
OSEM3D, TOF + PSF
2i21ss Gaussian 5 mm
4 1.5 MBq/kg
(min 80 MBq)
NA
F Philips Gemini TOF
BLOB-OS-TF 4 mm 3i33ss
Pelvis: 3 Body: 2 100 MBq 2.5 100 MBq
G Siemens mCT TrueX + TOF 4i21ss Gaussian 5 mm
3 1.5 MBq/kg 3 1.5 MBq/kg
H Siemens mCT40 and mCT128
TrueX + TOF 3i21ss Gaussian 3 mm
< 70 kg: 1.5 MBq/kg: 3 1.13 MBq/ml: 4 0.9 MBq/ml: 5
> 70 kg: 1.5 MBq/ kg: 4 1.2 MBq/ ml: 5 1 MBq/ ml: 6
1.5 MBq/kg < 70 kg: 1.5 MBq/kg: 3 1.13 MBq/ml: 4 0.9 MBq/ml: 5
> 70 kg: 1.5 MBq/ kg: 4 1.2 MBq/ ml: 5 1 MBq/ ml: 6 1.5 MBq/kg
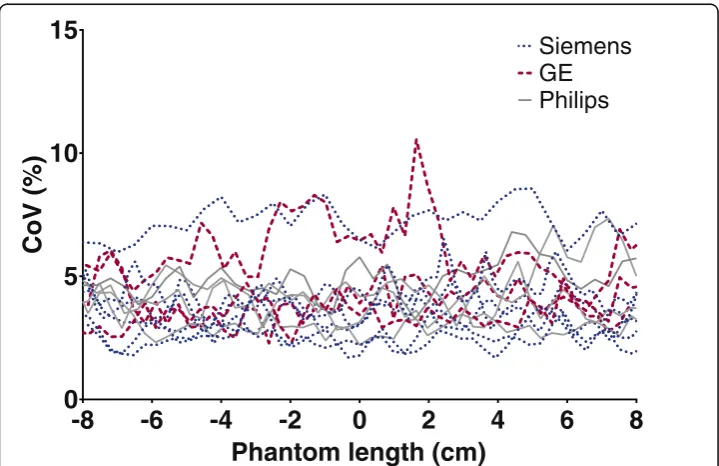
0.99 [0.97–1.01] for 68Ga and 18F, respectively. Two systems showed identical cali-bration accuracy for both isotopes (system 2 and 11), all other show a consistent underestimation for 68Ga. The 68Ga CoV in the centre of the cylindrical phantom was below 10% (Fig. 2).
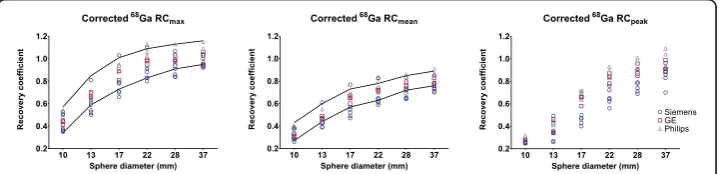
The 18F RC-curves of all PET/CT systems satisfied the current EARL specifications (Fig. 3a–c). However, for 68Ga the RC-curves were located around the lower limit of the EARL specifications (Figure3d-f). In addition,68Ga showed a reduced mean recov-ery and larger variation between PET/CT systems compared to the 18F. The variation for all spheres of the RCmean,RCmaxand RCpeak for 18F was 6%, 6% and 8%,
respect-ively. For68Ga, the mean range was 11%, 11% and 15% (largest variation was 19%). Fur-thermore, the mean RCmaxand RCmean were both 11% lower compared to the mean
EARL specifications for18F. The mean68Ga/18F calibration difference within one scan-ner was 7% (range 1–13%).
After correction for the local difference between 68Ga/18F cross-calibration (Fig. 1), the 68Ga RC curve was within EARL limits for all but two scanners (Figure 4). The mean 68Ga RCmax and RCmean were accordingly 5% lower compared to mean EARL
standards.
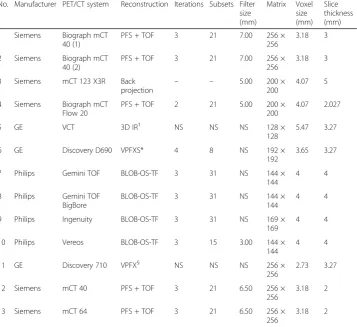
Table 2PET/CT reconstruction settings for phantom measurements
No. Manufacturer PET/CT system Reconstruction Iterations Subsets Filter size (mm) Matrix Voxel size (mm) Slice thickness (mm)
1 Siemens Biograph mCT 40 (1)
PFS + TOF 3 21 7.00 256 ×
256
3.18 3
2 Siemens Biograph mCT 40 (2)
PFS + TOF 3 21 7.00 256 ×
256
3.18 3
3 Siemens mCT 123 X3R Back
projection – –
5.00 200 × 200
4.07 5
4 Siemens Biograph mCT Flow 20
PFS + TOF 2 21 5.00 200 ×
200
4.07 2.027
5 GE VCT 3D IR† NS NS NS 128 ×
128
5.47 3.27
6 GE Discovery D690 VPFXS* 4 8 NS 192 ×
192
3.65 3.27
7 Philips Gemini TOF BLOB-OS-TF 3 31 NS 144 ×
144
4 4
8 Philips Gemini TOF BigBore
BLOB-OS-TF 3 31 NS 144 ×
144
4 4
9 Philips Ingenuity BLOB-OS-TF 3 31 NS 169 ×
169
4 4
10 Philips Vereos BLOB-OS-TF 3 15 3.00 144 ×
144
4 4
11 GE Discovery 710 VPFX§ NS NS NS 256 ×
256
2.73 3.27
12 Siemens mCT 40 PFS + TOF 3 21 6.50 256 ×
256
3.18 2
13 Siemens mCT 64 PFS + TOF 3 21 6.50 256 ×
256
3.18 2
TOF orTF= time-of-flight,PSF= point-spread-function,NS= not specified
†3D OSEM
Discussion
In this study, quantitative 68Ga PET/CT performance was evaluated in a multicentre setting. In a survey across Dutch hospitals, differences in clinical acquisition and recon-struction protocols were observed, underlining the need for clinical harmonisation. Although 11 out of the 13 PET/CT systems were EARL accredited, all systems showed
1 2 3 4 12 13
5 6 11
7 8 9 10
0.8
0.9
1.0
1.1
1.2
Ratio
PET/dose
calibrato
r
68Ga
18
F
Siemens
GE
Philips
Fig. 1Accuracy of the measured activity by the PET/CT system and local dose calibrator, based on the average between the cylindrical and IQ phantom. Numbers correspond to Table2
-8
-6
-4
-2
0
2
4
6
8
0
5
10
15
Phantom length (cm)
CoV
(%)
Siemens
Philips
GE
18
F recovery performance within EARL standards. For this reason, all systems were included for68Ga evaluation.
The absence of local and central dose calibrator cross-calibration for 68Ga is a limitation in this study. This would increase local calibrator harmonisation and im-proves PET/CT comparability across sites. Most institutes use a long-lived (137 Cea-sium) source to assess constancy and accuracy of the dose calibrator on a daily basis, and perform actual cross-calibration with the PET/CT system at least once a year using 18F. Still, in all but three PET/CT systems the measured 18F and 68Ga activity concentrations were within 10% deviation from the local dose calibrator. High energy prompt gammas emitted by 68Ga are likely detected by the dose cali-brator causing a disconcordance, yet in fewer extent by the PET system. Because of this, the dose calibrator overestimates68Ga-activity, and a persistent underestimation for
68
Ga compared to 18F is seen in Fig. 1. A recent study by Bailey et al. also showed an underestimation of ± 15% for68Ga, which was primarily related to an inaccurate scaling factor for the dose calibrator of a specific vendor [9]. To avoid these issues, they calibrated the dose calibrator towards the PET, after verifying that the scanner has a good response for 18F. These results are also supported by the fact that on specific Siemens scanners (scanners 1 and 2), a traceable 68Germanium (68Ge) source was used to verify absolute PET response independent of a dose calibrator. When imaging the68Ge-source, the PET/
Fig. 3RC for18F with the current EARL standards and RC of68Ga. Solid lines: maximum and minimum
values according to EARL limits as applicable before 2019
Fig. 468Ga RC-curves corrected for the18F/68Ga calibration mismatch according to local cross-calibration.
CT system did not show the same offset as was observed when imaging the68Ga cross-calibration phantom (roughly a deviation of < 1% vs. 6% and 7%, respectively). For the sake of simplicity, we would suggest to correct the RC curve for the local 68Ga/18F dis-crepancy, as after correction for this68Ga/18F difference (Fig.4) all but two scanners were within EARL specifications. This correction has to be performed offline in multicentre quantitative studies. The 68Ga used for this study was produced either locally or by a pharmaceutical institution and was therefore not traceable to a central dose calibrator. We expect that the response between the dose calibrator and the PET-system could be uniform in future clinical 68Ga-PET/CT studies if a traceable (NIST) source is used to harmonise protocols between centres.
68
Ga image noise was below 10% for all PET/CT systems which is in concordance with the EANM/EARL guidelines [3,8]. The RC variation is larger for68Ga compared to18F (Fig.3). However,68Ga performance nearly reached EARL performance specifica-tions after correction for the local68Ga/18F ratio. Surprisingly, the RCpeak variation (8%
and 15%) is larger in contrast to RCmaxand RCmean (both 6% and 11%) for both 18F
and 68Ga, respectively. The study of Kaalep et al. showed the opposite result in RCpeak
variation [5]. The RCpeak is expected to be less prone to noise compared to RCmax;
therefore, it was expected to be more comparable over all PET-systems. The difference could be explained by the fact that the standard deviation of RCmax and RCpeak are
similar: 8.4% and 8.6% for 68Ga and 4.8% and 5.0% for18F, respectively. Yet, the mean RCpeakvalue is lower; therefore, resulting in a higher CoV. Next to that, the larger68Ga
variation in the RC-curves compared to 18F is likely related to the higher positron energy of 68Ga and thereby revealing a lower signal-to-noise ratio. This effect is enhanced by post-reconstruction filtering. Finally, previous single-centre studies show
68
Ga RC-curves similar [10] or somewhat better due to point spread function recon-struction [11] as observed in the current study. The EARL limits as applicable before 2019 (EARL1) are shown in Figs.3and4, as all acquisitions were acquired before 2019 and therefore site-specific acquisition and reconstruction protocols are designed to meet the EARL1 limits. RCpeakspecifications are not available for EARL1 and are
there-fore not shown in Figs. 3 and 4. EARL2 limits (applicable from 2019) for RCmax and
RCmean increased with ~ 25% in comparison to EARL1. We expect that the gap
between18F and 68Ga recoveries will further increase with these new limits, as already for EARL1 not all scanners agreed to EARL1 limits after68Ga/18F correction (Fig.4).
Based on the results, we propose to correct68Ga recovery towards the18F recovery to correct for the current dose calibrator deviation. We suggest, therefore, to apply the EARL acquisition and reconstruction protocol and to correct for 68Ga/18F cross-calibration mismatch. One can assume that68Ga recovery is steady if18F specifications of a PET-system are stable during regular yearly assessment. Unless the acquisition and reconstruction protocol is changed or major maintenance is performed to the PET/CT-system, we recommend to perform additional 68Ga IQ acquisitions only when regular
18
Conclusion
This evaluation of multicentre 68Ga PET/CT performance showed that 68Ga RCs perform at the lower limits of current 18F EARL standards. For practical reasons, we recommend to use the 18F EARL approved reconstruction settings and to correct for
68
Ga/18F calibration mismatch based on local cross-calibration. Finally, we suggest to evaluate68Ga PET/CT recovery performance once and repeat only when18F specifica-tions are changed.
Abbreviations
18F:18Fluorine;68Ga:68Gallium;89Zr:89Zirconium; CoV: Coefficient of variation; EARL: EANM Research Ltd; IQ: Image
quality; RC: Recovery coefficient; VOI: Volume-of-interest
Acknowledgements
The authors thank A. Eek for coordinating the BetaCure study. Furthermore, we thank the hospitals of the Dutch PSMA consortium and the other centres who have sent their clinical68Ga PET/CT acquisition protocols.
Authors’contributions
DH performed data collection, analysis and drafted the manuscript. DH, DK, LWV, MS and JvD discussed the methodology. RB provided the analysis tools and discussed methodology. All authors critically reviewed the manuscript and approved the final version of the manuscript.
Funding
The research leading to these results have received funding from the European Community’s Seventh Framework Programme (FP7/2007-2013) under grant agreement no. 602812 (BetaCure study).
Availability of data and materials
The datasets used and/or analysed during the current study are available from the corresponding author on reasonable request.
Ethics approval and consent to participate
This article does not contain any studies with human participants or animals performed by any of the authors.
Consent for publication
Not applicable.
Competing interests
RB is a scientific advisor and chair of the EARL accreditation programme. TS is an associate of the EARL accreditation programme. All other authors declare that they have no conflict of interest.
Author details
1Department of Nuclear Medicine, Netherlands Cancer Institute, Amsterdam, The Netherlands.2Department of Nuclear
Medicine, Isala, Zwolle, The Netherlands.3Department of Medical Physics, Isala, Zwolle, The Netherlands.4Department of Radiology and Nuclear Medicine, Radboud University Medical Center, Nijmegen, The Netherlands.5Department of Radiology and Nuclear Medicine, Amsterdam University Medical Centres, location VU University Medical Center, Amsterdam, The Netherlands.6Department of Nuclear Medicine and Molecular Imaging, University of Groningen and University Medical Center Groningen, Groningen, The Netherlands.7EANM Research Limited (EARL), Vienna, Austria. 8Department of Physics, Netherlands Cancer Institute, Amsterdam, The Netherlands.
Received: 3 May 2019 Accepted: 2 September 2019
References
1. Singh S, Poon R, Wong R, Metser U.68Ga PET imaging in patients with neuroendocrine tumors: a systematic review and
meta-analysis. Clin Nucl Med. 2018;43:802–10.
2. Lütje S, Heskamp S, Cornelissen AS, Poeppel TD, van den Broek SAMW, Rosenbaum-Krumme S, et al. PSMA ligands for radionuclide imaging and therapy of prostate cancer: clinical status. Theranostics. 2015;5:1388–401.
3. Boellaard R, Willemsen A, Arends B, Visser EP. EARL procedure for assessing PET/CT system specific patient FDG activity preparations for quantitative FDG PET/CT studies. 2013. p. 1–3. Available from: http://earl.eanm.org/html/img/pool/EARL-procedure-for-optimizing-FDG-activity-for-quantitative-FDG-PET-studies_version_1_1.pdf.
4. Makris NE, Boellaard R, Visser EP, de Jong JR, Vanderlinden B, Wierts R, et al. Multicenter Harmonization of89Zr PET/CT Performance. J Nucl Med. 2014;55:264–7.
5. Kaalep A, Sera T, Rijnsdorp S, Yaqub M, Talsma A, Lodge MA, et al. Feasibility of state of the art PET/CT systems performance harmonisation. Eur J Nucl Med Mol Imaging. 2018;45:1344–61.
6. Boellaard R, Krak NC, Hoekstra OS, Lammertsma AA. Effects of noise, image resolution, and ROI definition on the accuracy of standard uptake values: a simulation study. J Nucl Med. 2004;45:1519–27.
8. Boellaard R, Delgado-Bolton R, Oyen WJG, Giammarile F, Tatsch K, Eschner W, et al. FDG PET/CT: EANM procedure guidelines for tumour imaging: version 2.0. Eur J Nucl Med Mol Imaging. 2015;42:328–54.
9. Bailey D, Hofman M, Forwood N, O’Keefe G, Scott A, van Wyngaardt W, Howe B, Kovacev O, Francis R. Accuracy of dose calibrators for68Ga PET imaging: unexpected findings in a multicenter clinical pretrial assessment. J Nucl Med. 2018;59:636–8.
10. Preylowski V, Schlögl S, Schoenahl F, Jörg G, Samnick S, Buck AK, et al. Is the image quality of I-124-PET impaired by an automatic correction of prompt gammas? PLoS One. 2013;8:1–8.
11. Jönsson L, Stenvall A, Mattsson E, Larsson E, Sundlöv A, Ohlsson T, et al. Quantitative analysis of phantom studies of
111In and68Ga imaging of neuroendocrine tumours.
12. Kaalep A, Huisman M, Sera T, Vugts D, Boellaard R. Feasibility of PET/CT system performance harmonisation for quantitative multicentre89Zr studies. EJNMMI Phys. 2018;5:26.
Publisher’s Note