www.ann-geophys.net/33/1469/2015/ doi:10.5194/angeo-33-1469-2015
© Author(s) 2015. CC Attribution 3.0 License.
Comparisons of electron acceleration efficiency among different
structures during magnetic reconnection: a Cluster multicase study
M. Zhou1,2, T. Li1,3, X. Deng1, S. Huang4, and H. Li5
1Institute of Space Science and Technology, Nanchang University, Nanchang 330031, China 2State Key Laboratory of Space Weather, Chinese Academy of Sciences, Beijing 100190, China 3School of Sciences, Nanchang University, Nanchang 330031, China
4School of Electronic and Information, Wuhan University, Wuhan 430072, China
5School of Physics and Optoelectronic Engineering, Xidian University, Xi’an 710071, China
Correspondence to: M. Zhou ([email protected])
Received: 10 March 2015 – Revised: 29 September 2015 – Accepted: 17 November – Published: 1 December 2015
Abstract. Magnetic reconnection has long been believed to be an efficient engine for energetic electrons production. Four different structures have been proposed for electrons being energized: flux pileup region, density cavity located around the separatrix, magnetic island and thin current sheet. In this paper, we compare the electron acceleration efficiency among these structures based on 12 magnetotail reconnection events observed by the Cluster spacecraft in 2001–2006. We used the flux ratio between the energetic electrons (> 50 keV) and lower energy electrons (< 26 keV) to quantify the elec-tron acceleration efficiency. We do not find any specific se-quence in which electrons are accelerated within these struc-tures, though the flux pileup region, magnetic island and thin current sheet have higher probabilities to reach the maximum efficiency among the four structures than the density cavity. However, the most efficient electron energization usually oc-curs outside these structures. We suggest that other structures may also play important roles in energizing electrons. Our re-sults could provide important constraints for the further mod-eling of electron acceleration during magnetic reconnection. Keywords. Space plasma physics (magnetic reconnection)
1 Introduction
Electron energization is an outstanding issue in plasma physics and astrophysics. Magnetic reconnection is able to produce a large number of energetic electrons (Sonnerup, 1979). In the terrestrial magnetosphere, hundreds of keV electrons were detected in the reconnection region (e.g.
Øieroset et al., 2002). In the past decade, there have been many theoretical models and observations about electron ac-celeration during magnetic reconnection.
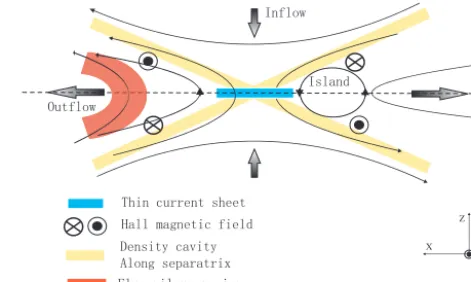
ob-servation (Imada et al., 2007). In addition, recent observa-tions found that the flux pileup region can propagate far away from X-line in the magnetotail. The flux pileup region usu-ally has a sharp leading boundary, which is called dipolariza-tion front (e.g. Zhou et al., 2009). Electrons can be acceler-ated around the front by adiabatic betatron and Fermi accel-eration, or non-adiabatic acceleration through wave-particle interactions (Ashour-Abdalla et al., 2011; Deng et al., 2010; Fu et al., 2013; Huang et al., 2012b). In summary, thin cur-rent sheet, magnetic island, density cavity around the separa-trix and flux pileup region are four different structures which are frequently involved in electron energization during re-connection. The locations of these structures in the context of 2-D reconnection geometry are depicted in Fig. 1.
Huang et al. (2012a) experimentally compared the ener-getic electron fluxes within a thin current sheet and a mag-netic island in a diffusion region. They found that flux within the island was larger than that within the thin current sheet. Based on this they suggested that electrons were first accel-erated in the current sheet and further energized inside the island. Their study raises some interesting questions: does any specific sequence exist in which electrons are acceler-ated through these structures (Hoshino et al., 2001; Huang et al., 2012a; Imada et al., 2007)? At which structure is the elec-tron acceleration the most efficient? In this paper we extend their study by comparing the energetic electron acceleration efficiency among these different structures during multiple reconnection events in the Earth’s magnetotail.
2 Observation
Multiple instruments of Cluster spacecraft were used in this study, including the fluxgate magnetometer (FGM) (Balogh et al., 2001), the electric fields and waves (EFW) (Gustafsson et al., 2001), the Cluster ion spectrometry (CIS) (Rème et al., 2001), the plasma electron and current experiment (PEACE) (Johnstone et al., 1997), and the research with adaptive par-ticle imaging detectors (RAPID) (Wilken et al., 2001). Only the data points with values above the background noise and that were also flagged with quality number 3 or 4 (good for publication) were used from PEACE. Magnetic field and plasma flow are presented in the geocentric solar magneto-spheric (GSM) coordinate, while the electric field is shown in the ISR2 (inverted spacecraft reference) coordinate. Tem-poral resolutions for magnetic and electric fields are 22.3 Hz and 25 Hz respectively. Electron density with resolution of 0.2 s was inferred from the spacecraft potential (Pedersen et al., 2008).
Our database consists of reconnection events in the Earth’s magnetotail during the years 2001–2006 (Zhou et al., 2014). We chose the events in which correlated flow Vx and
mag-netic fieldBzreversal were detected. In addition, the
polar-izations of out-of-plane magnetic fieldsByand normal
elec-tric fieldsEzthat consistent with the conventional Hall fields
Thin current sheet Outflow
Inflow
Density cavity Along separatrix Flux pileup region
Island
Hall magnetic field
X Z
[image:2.612.309.545.68.209.2]Y
Figure 1. Schematic view of the 2-D reconnection geometry and
the proposed structures for electron acceleration.
were also detected during the flow reversal, which confirms that the spacecraft were very close to X-line.
The accuracy of identifying the aforementioned four struc-tures is crucial for this study. Below we discuss and list our criteria.
1. Thin current sheet
We define the thin current sheet as ion-scale current sheet, the thickness of which is around the local proton inertial lengthdi. Heredi=c/ωpiis based on the pro-ton density in the current sheet measured by CIS. If four spacecraft have all crossed the sheet, then we employed the well-known timing method to estimate the sheet thickness. This method is available when the space-craft inter-distance is much smaller than the current sheet width. If less than four spacecraft have crossed the sheet, we resort to a less accurate and less straight-forward method. This method requires two spacecraft being located on the opposite side of current sheet, i.e. one in the Northern Hemisphere while the other in the Southern Hemisphere. In this situation the current sheet thickness should be close or less than the distance be-tween the two spacecraft along theZdirection. 2. Flux pileup region
a. |Bz|increases more than 5 nT in 20 s.Bzcan be either
positive or negative. WhenBzis positive (negative) the
corresponding plasma flow should be earthward (tail-ward).
b. The associated maximum equatorial plasma flow speed should be greater than 150 km s−1, i.e.,pvx2+vy2> 150.
3. Magnetic island
a. Bzexhibits a nearly symmetric bipolar change, andBy
Highly asymmetric bipolarBzstructure is probably the
dipolarization front.
4. Density cavity around the separatrix
a. The spacecraft should be away from current sheet, which means that |Bx| is not very small. Here we
re-quire that|Bx|> 5 nT.
b. It corresponds to large density variations (density should decrease at least fivefold) and electric field fluc-tuations (|δE|> 10 mV m−1) (Cattell et al., 2005; Zhou et al., 2011).
It should be noted that structures located on the high lat-itude and tailward of X-line may contain electrons from the distant reconnection site, so these structures are eliminated from our database.
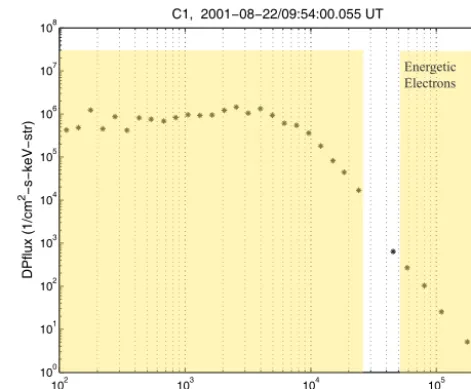
In this paper, acceleration efficiency is defined as the pro-portion of energetic electrons in the whole energy distribu-tion. We used the flux ratio of energetic electrons to lower energy electrons to quantify the efficiency. Here we used electrons measured by RAPID (50.5–244.1 keV) to represent energetic electrons, which is in accord with many previous studies (e.g. Chen et al., 2008). Fluxes of the first energy channel of RAPID occasionally have abnormal fluctuations and/or spikes (not shown), so we did not use it. PEACE mea-sures electrons in the range of approximately 5 eV–26 keV. Electrons with energy less than 70 eV may be contaminated by photoelectrons, so we set the lower energy boundary for thermal electrons as 100 eV. Hence we used electrons from 100 eV to 26 keV measured by PEACE to represent lower energy electrons. Figure 2 presents an energy distribution to show the energy ranges for energetic and lower energy elec-trons. This ratio has been employed by Imada et al. (2011) to compare the electron acceleration efficiency among differ-ent reconnection evdiffer-ents. It is a more reliable parameter than the flux magnitude to indicate the electron acceleration ef-ficiency. Relying on flux magnitude may misinterpret some pseudo acceleration event. For instance, the density variation can lead to flux variation even if the energy distribution does not change. If a spacecraft moves from lower density plasma to higher density plasma with density increases by a factor of two, it will measure a two times increase of energetic particle flux even if the energy distributions are the same in these two plasmas. However, this flux increase is not due to accelera-tion but merely a plasma compression.
Small-scale or transient structures, the duration of which is less than the spin period 4 s, are not included in this study be-cause the cadence of electron flux data is 4 s. To compare the electron acceleration efficiency among different structures, we chose the events in which at least two different structures were encountered. If one type of structure was detected more than once in one event, or one structure was detected by more than one spacecraft, we chose the one that has the highest flux ratio. Following this we present two events in which all four types of structures were detected by Cluster.
102 103 104 105
100 101
102 103
104 105 106
107 108
Energy (eV)
DPflux (1/cm
2−s−keV−str)
C1, 2001−08−22/09:54:00.055 UT
[image:3.612.311.547.66.261.2]Energetic Electrons
Figure 2. Differential particle flux as a function of energy for C1
on 22 August 2001 event at around 09:54:00 UT. Yellow shaded regions mark the energy ranges for the energetic and lower energy electrons used to calculate the efficiency.
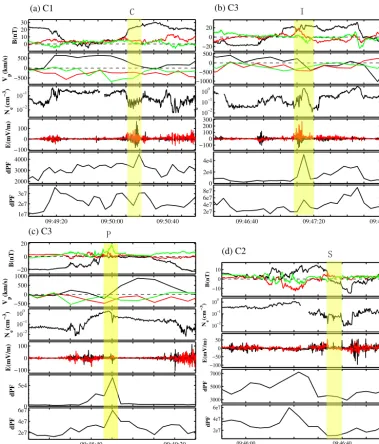
The first event is between 09:38 and 09:51 UT on 1 Oc-tober 2001. This event has been extensively studied in many different aspects, such as diffusion region structure and electron energization (e.g. Runov et al., 2003; Cat-tell et al., 2005; Chen et al., 2008). Figure 3 presents the four structures observed by Cluster. The upper left plot (Fig. 3a) shows the C1 observation of a density cavity around 09:50:10–09:50:20 UT. The density cavity is man-ifested as a sharp density drop (from 0.3 to 0.03 cm−3). It corresponds to a large Bx (∼20 nT) and intense
elec-tric field fluctuations (> 100 mV m−1). The upper right plot (Fig. 3b) shows the C3 observation of a magnetic island around 09:47:10–09:47:20 UT. This island is manifested as bipolarBzand evident enhancement of core field|By|. The
two sides of island moved in opposite direction as there was a flow reversal inside the island. The convergent flow in-side the island was originated from the two active X-lines binding the island (Deng et al., 2004; Zhou et al., 2012). The lower left plot (Fig. 3c) shows the C3 observation of a flux pileup region around 09:48:46–09:48:52 UT. We see a rapidBzincrease (> 15 nT in less than 10 s) at the leading
measure-−10 0 10
B(nT)
100
10−1
10−2
Ne
(cm
−3)
−100 −50 0 50
E(mV/m)
3000 5000 7000
dPF
09:46:00 09:46:40
2e7 4e7 6e7
dPF
−20 0 20
B(nT)
−500 0 500 1000
Vp
(km/s)
100
10−1
10−2
Ne
(cm
−3)
−100 0 100
E(mV/m)
0 5e4
dPF
09:48:40 09:49:20
2e7 4e7 6e7
dPF
−20 0 20
−1000 −500 0 500
Vp
(km/s)
100
10−1
10−2
Ne
(cm
−3)
−1000
100 200 300
E(mV/m)
0 2e4 4e4
09:46:40 09:47:20 09:48:00
2e7 4e7 6e7 8e7 0
10 20 30
B(nT)
−500 0 500
Vp
(km/s)
10−2
10−1
Ne
(cm
−3)
−100 0 100
E(mV/m)
2000 3000 4000
dPF
09:49:20 09:50:00 09:50:40
1e7 2e7 3e7
dPF
(a) C1
(d) C2 (c) C3
(b) C3
C I
P
[image:4.612.109.489.66.510.2]S
Figure 3. Observations of four structures on 1 October 2001 event: (a) density cavity by C1, (b) magnetic island by C3, (c) flux pileup region
by C3 and (d) thin current sheet by C2. Each plot in Fig. 3a-d shows (From the top to bottom) three components of magnetic fields (black:
Bx, red:By, green:Bz), three components of plasma bulk velocity (black:Vx, red:Vy, green:Vz), two components of electric fields, electron
density, energetic electron differential particle flux (integrated in the range of 50.5–244.1 keV), and lower energy electron differential particle flux (integrated in the range of 0.1–26 keV). The shaded areas mark the identified structures. Because the CIS instrument of C2 is out of order, panel (d) does not show the plasma bulk velocity.
ments by RAPID. We see that the ratios in the flux pileup region and magnetic island are higher than those inside the other two structures. The maximum flux ratio recorded in this event is (11.6±0.4)×10−4, which is the same as the flux ra-tio inside the flux pileup region.
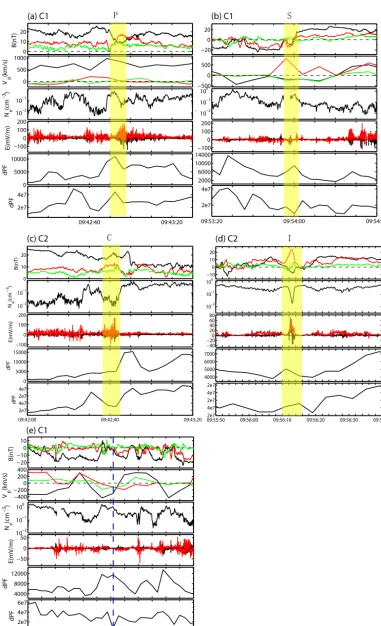
Another event is between 09:41 and 09:57 UT on 22 Au-gust 2001. This event has been studied by Eastwood et al. (2007). They reported the Hall magnetic and electric fields in the ion diffusion region from both hemispheres. Fig-ure 4 presents the four structFig-ures observed by different
space-craft. The upper left plot (Fig. 4a) shows the C1 observa-tion of a flux pileup region around 09:42:51–09:42:58 UT. The upper right plot (Fig. 4b) shows the C1 observation of a thin current sheet around 09:53:54–09:54:02 UT. The current sheet thickness is about 450 km∼1.1c/ωpi (based on the local plasma density 0.3 cm−3). The lower left plot (Fig. 4c) shows the C2 observation of a density cavity around 09:42:37–09:42:44 UT. The cavity was located around a separatrix, which corresponds to a large Bx and intense
−10 0 10 20
100
10−1
10−2
N
(cm
−3)
−40 −200 20 40 60 80
4000 5000 6000 7000
09:55:502e7 09:56:00 09:56:10 09:56:20 09:56:30 09:56:40 4e7
2e7 4e7 2e7 0
10 20
B(nT)
10−2 10−1
Ne
(cm
−3)
−100 0 100 200
E(mV/m)
0 5000 10000 15000
dPF
09:42:00 09:42:40 09:43:20
2e7 4e7 2e7 4e7
dPF
−20 0 20
−500 0 500
Vp
(km/s)
100
10−1 10−2
Ne
(cm
−3)
−100 0 100 200
E(mV/m)
2000 6000 10000 14000
09:53:20 09:54:00 09:54:40
2e7 4e7 0
10 20
B(nT)
0 500 1000
Vp
(km/s)
10−2 10−1
Ne
(cm
−3)
−100 0 100 200
E(mV/m)
0 5000 10000
dPF
09:42:40 09:43:20
2e7 4e7
dPF
(a) C1 (b) C1
(c) C2 (d) C2
P S
C I
−20 −10 0 10
B(nT)
−400 −2000 200 400
Vp
(km/s)
10−2 10−1 100
Ne
(cm
−3)
−50 0 50
E(mV/m)
4000 8000 12000
dPF
09:52:00 09:52:40 09:53:20 2e7
4e7 6e7
dPF
[image:5.612.110.491.58.684.2](e) C1
Figure 4. Observations of four structures on 22 August 2001 event: (a) flux pileup region by C1, (b) thin current sheet by C1, (c) density
shows the C2 observation of a magnetic island around 09:56:10–09:56:16 UT. All the above structures are consis-tent with our criteria. The maximum flux ratios within the flux pileup region, density cavity, thin current sheet and magnetic island are (2.5±0.2)×10−4, (3.4±0.5)×10−4, (9.5±1.0)×10−4and (2.3±0.3)×10−4respectively. The ratio in the thin current sheet is higher than those in the other structures. This is different from the October 01, 2001 event in which the flux pileup region has a higher ratio than the other three structures. The maximum flux ratio in this event is (16.4±1.5)×10−4. This value is larger than those mea-sured in the four structures. Panel e shows that it occurred in-side the current sheet and tailward flow. It corresponds to the increase of high energy electron flux and decrease of lower energy electron flux, and relatively low electric field fluctua-tions.
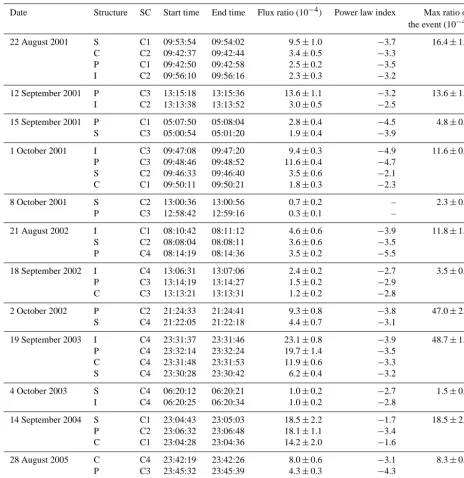
Overall, there are 12 events that have more than one tures detected by Cluster. Detailed parameters of these struc-tures are listed in Table 1. Symbol “P” denotes flux pileup region, “C” denotes density cavity, “S” denotes thin current sheet and “I” denotes magnetic island. The power law in-dices of energetic electrons (by using four energy channels from 50.5 to 244.1 keV) are also calculated for reference. In order to reduce the statistical uncertainties, the power law in-dex was calculated only if the integrated energetic electron flux was greater than 1000/(s sr cm2). For each event we sort the structures in order of the flux ratio from high to low. Two values are indistinguishable if the error bars are overlapped with each other.
From Table 1 we see that the order of electron acceleration efficiency is different in different events. For instance, the se-quence is S-C-P-I in the 22 August 2001 event according to the efficiency from high to low, while the sequence is I-P-C-S in the 19 September 2003 event. The number of events that flux pileup region has the highest efficiency among these structures is 5, while the number of events that flux pileup region was detected is 11. Hence the occurrence rate that flux pileup region has the highest efficiency is 5/11. The two numbers for density cavity are 1 and 9, for magnetic island are 2 and 8, and for thin current sheet are 3 and 9. For sim-plicity, we call the evens that flux pileup region has the high-est efficiency among the four as P-type events. Similarly we define other three types of events: C-type, S-type and I-type events. We see that all four type events exist in the 12 recon-nection events. And the occurrence rates of P-type, I-type and S-type event are similar, while they are greater than the occurrence rate of C-type event. Furthermore, we calculated the maximum flux ratio ever measured for each event (right-most column of Table 1). It is shown that, only in four events (12 September 2001, 1 October 2001, 14 September 2004 and 28 August 2005), the maximum ratio occurs inside these four structures. The maximum efficiency occurs outside the four structures for the majority of events.
−1 −0.5 0 0.5 1
−1 −0.8 −0.6 −0.4 −0.2 0 0.2 0.4 0.6 0.8 1
V x/VA Bx
/B
[image:6.612.319.535.68.234.2]0
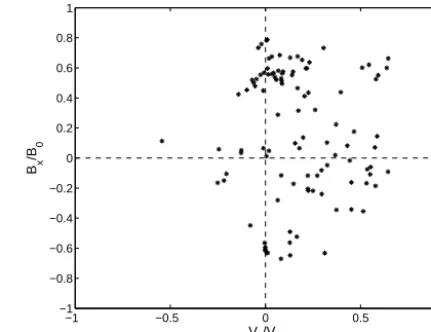
Figure 5. A scatterplot of locations of the most efficient
energiza-tions as a function ofBxandVx.BxandVxhave been normalized
by the asymptotic magnetic fieldB0and Alfven speed based onB0 andn0; heren0is the plasma density in the central current sheet. Data points with top 3 % electron acceleration efficiency for each event are plotted.
3 Discussion and summary
In this paper, we study the electron acceleration efficiency in reconnection region by examining 12 reconnection events in the magnetotail observed by Cluster spacecraft. The flux ratio of (50.5–244.1) to (0.1–26) keV electrons is employed to quantify the electron acceleration efficiency. We compared the electron acceleration efficiency within the following four structures: thin current sheet, density cavity around the sep-aratrix, magnetic island and flux pileup region. We find that the occurrence rates of P-type, I-type and S-type events are higher than the occurrence rate of C-type event. However, we do not find consistent order of efficiency among these four structures through the analysis of the 12 events, which implies that there is no specific sequence in which electrons are energized through these structures. Through a statistical study of energetic electrons in the magnetotail reconnection region, Zhou et al. (2015) found that the electron accelera-tion efficiency is positively correlated to the plasma outflow speedVx. Because there is no specific order of outflow speed
Table 1. A summary of flux ratio and power law indices within the different structures for all the selected reconnection events. “–” in the
column of power law index corresponds to the integrated energetic electron flux less than 1000/(s str cm2). For each event the structures are sorted in order of flux ratio from high to low.
Date Structure SC Start time End time Flux ratio (10−4) Power law index Max ratio of the event (10−4)
22 August 2001 S C1 09:53:54 09:54:02 9.5±1.0 −3.7 16.4±1.5 C C2 09:42:37 09:42:44 3.4±0.5 −3.3
P C1 09:42:50 09:42:58 2.5±0.2 −3.5 I C2 09:56:10 09:56:16 2.3±0.3 −3.2
12 September 2001 P C3 13:15:18 13:15:36 13.6±1.1 −3.2 13.6±1.1 I C2 13:13:38 13:13:52 3.0±0.5 −2.5
15 September 2001 P C1 05:07:50 05:08:04 2.8±0.4 −4.5 4.8±0.9 S C3 05:00:54 05:01:20 1.9±0.4 −3.9
1 October 2001 I C3 09:47:08 09:47:20 9.4±0.3 −4.9 11.6±0.4 P C3 09:48:46 09:48:52 11.6±0.4 −4.7
S C2 09:46:33 09:46:40 3.5±0.6 −2.1 C C1 09:50:11 09:50:21 1.8±0.3 −2.3
8 October 2001 S C2 13:00:36 13:00:56 0.7±0.2 – 2.3±0.3 P C3 12:58:42 12:59:16 0.3±0.1 –
21 August 2002 I C1 08:10:42 08:11:12 4.6±0.6 −3.9 11.8±1.3 S C2 08:08:04 08:08:11 3.6±0.6 −3.5
P C4 08:14:19 08:14:36 3.5±0.2 −5.5
18 September 2002 I C4 13:06:31 13:07:06 2.4±0.2 −2.7 3.5±0.3 P C3 13:14:19 13:14:27 1.5±0.2 −2.9
C C3 13:13:21 13:13:31 1.2±0.2 −2.8
2 October 2002 P C2 21:24:33 21:24:41 9.3±0.8 −3.8 47.0±2.3 S C4 21:22:05 21:22:18 4.4±0.7 −3.1
19 September 2003 I C4 23:31:37 23:31:46 23.1±0.8 −3.9 48.7±1.8 P C4 23:32:14 23:32:24 19.7±1.4 −3.5
C C4 23:31:48 23:31:53 11.9±0.6 −3.3 S C4 23:30:28 23:30:42 6.2±0.4 −3.2
4 October 2003 S C4 06:20:12 06:20:21 1.0±0.2 −2.7 1.5±0.2 I C4 06:20:25 06:20:34 1.0±0.2 −2.8
14 September 2004 S C1 23:04:43 23:05:03 18.5±2.2 −1.7 18.5±2.2 P C2 23:06:32 23:06:48 18.1±1.1 −3.4
C C1 23:04:28 23:04:36 14.2±2.0 −1.6
28 August 2005 C C4 23:42:19 23:42:26 8.0±0.6 −3.1 8.3±0.5 P C3 23:45:32 23:45:39 4.3±0.3 −4.3
I C3 23:40:11 23:40:20 0.2±0.1 –
current layer. Figure 5 displays the locations of the most ef-ficient energizations as a function of reconnecting magnetic fieldBx and plasma outflow speedVx. The energization
oc-curs in a broad regime from Bx= −0.8B0 to Bx=0.8B0 and fromVx= −0.5VAtoVx=0.5VA. There are more data
points within the earthward flow than those within the tail-ward flow. The reason for this asymmetry is yet unknown.
Our results do not contradict with recent results that em-phasize the dominant role played by the earthward moving
dipolarization fronts in electron energization in the near-tail region (e.g. Ashour-Abdalla et al., 2011). This is because we focus on the region around the neutral line beyond X∼ −15
RE, where the flux pileup region/dipolarization front is just produced. Whereas most observations of energized electrons associated with dipolarization fronts were made at X >−15
Electrons inside these structures may drift from other ac-celeration sites. In particular, Duan et al. (2014) found that most energetic electrons in plasma sheet are directly or indi-rectly associated with magnetic reconnection, but some en-ergetic electron burst is not caused by local acceleration. Actually we cannot determine the relative contribution of these two factors (local acceleration and drift-in effect) in any of the four structures. What we confirm is that local ac-celeration exists inside all four structures, as we have de-scribed in the introduction section. If the two factors coexist in one structure, take magnetic island for example, electrons trapped within the island may come from the thin current sheet, where they have been energized. Then these electrons are further energized inside the island. Hence the accelera-tion efficiency within the island is higher than that within the current sheet. What we emphasize is the resultant efficiency, which is determined by the two factors even though we do not know the relative contributions from them based on the present study.
Interestingly, one may notice that, in some of the events, the highest flux ratio corresponds to the lowest power law index, such as the 22 August 2001, 12 September 2001, 15 September 2001, 1 October 2001, 2 October 2002 and 19 September 2003 event. Because not only the power law index but also the effective temperature affects the flux ra-tio, we suggest that in some cases electrons are substantially heated so the ratio is high even though the spectrum is rela-tively softer.
We also note that the maximum ratio for each event usu-ally does not locate in the four structures. It means that the most efficient energization of electrons occurs outside these structures. Although many previous studies focus on the elec-tron energization inside these four structures, what we learn from this study is that, other structures (except the four we discussed) may be more important for electron energization and worth paying more attention to in future studies.
Acknowledgements. We thank the Cluster teams and the Cluster Science Archive for providing high-quality data. This work was supported by the National Science Foundation of China (NSFC) un-der grants 41174147, 41274170, 41331070, 41522405 and Science Foundation of Jiangxi Province under grant 20142BCB23006. M. Z was also supported by the Specialized Research Fund for State Key Laboratories. All the data presented in this paper were downloaded freely from the Cluster Science Archive (http://www.cosmos.esa. int/web/csa/access).
The topical editor E. Roussos thanks the two anonymous refer-ees for help in evaluating this paper.
References
Ashour-Abdalla, M., El-Alaoui, M., Goldstein, M., Zhou, M., Schriver, D., Richard, R., Walker, R., Kivelson, M. G., and Hwang, K.: Observations and Simulations of Nonlocal Accelera-tion of Electrons in Magnetotail Magnetic ReconnecAccelera-tion Events, Nat. Phys., 7, 360–365, doi:10.1038/nphys1903, 2011.
Balogh, A., Carr, C. M., Acuña, M. H., Dunlop, M. W., Beek, T. J., Brown, P., Fornacon, H., Georgescu, E., Glassmeier, K.-H., Harris, J., Musmann, G., Oddy, T., and Schwingenschuh, K.: The Cluster Magnetic Field Investigation: overview of in-flight performance and initial results, Ann. Geophys., 19, 1207–1217, doi:10.5194/angeo-19-1207-2001, 2001.
Borg, A. L., Taylor, M. G. G. T., and Eastwood, J. P.: Ob-servations of magnetic flux ropes during magnetic reconnec-tion in the Earth’s magnetotail, Ann. Geophys., 30, 761–773, doi:10.5194/angeo-30-761-2012, 2012.
Cattell, C., Dombeck, J., Wygant, J., Drake, J. F., Swisdak, M., Goldstein, M. L., Keith, W., Fazakerley, A., André, M., Lucek, E., and Balogh, A.: Cluster observations of elec-tron holes in association with magnetotail reconnection and comparison to simulations, J. Geophys. Res., 110, A01211, doi:10.1029/2004JA010519, 2005.
Chen, L.-J., Bhattacharjee, A., Puhl-Quinn, P. A., Yang, H., Bessho, N., Imada, S., Muhlbachler, S., Daly, P. W., Lefebvre, B., Khotyaintsev, Y., Vaivads, A., Fazakerley, A., and Georgescu, E.: Observation of energetic electrons within magnetic islands, Nat. Phys., 4, 19–23, doi:10.1038/nphys777, 2008.
Dahlin, J. T., Drake, J. F., and Swisdak, M.: Electron acceleration in three-dimensional magnetic reconnection with a guide field, Phys. Plasmas, 22, 100704, doi:10.1063/1.4933212, 2015. Deng, X. H., Matsumoto, H., Kojima, H., Mukai, T., Anderson,
R. R., Baumjohann, W., and Nakamura, R.: Geotail encounter with reconnection diffusion region in the Earth’s magnetotail: Evidence of multiple X lines collisionless reconnection?, J. Geo-phys. Res., 109, A05206, doi:10.1029/2003JA010031, 2004. Deng, X., Ashour-Abdalla, M., Zhou, M., Walker, R., El-Alaoui,
M., Angelopoulos, V., Ergun, R. E., and Schriver, D.: Wave and Particle Characteristics of Earthward Electron Injections Associ-ated with Dipolarization Fronts, J. Geophys. Res., 115, A09225, doi:10.1029/2009JA015107, 2010.
Drake, J. F., Shay, M. A., and Thongthai, W.: Production of ener-getic electrons during magnetic reconnection, Phys. Rev. Lett., 94, 095001, doi:10.1103/PhysRevLett.94.095001, 2005. Drake, J. F., Swisdak, M., Che, H., and Shay, M. A.: Electron
accel-eration from contracting magnetic islands during reconnection, Nature, 443, 7111, 553–556, 2006.
Duan, A. Y., Cao, J. B., Dunlop, M., and Wang, Z. Q.: En-ergetic electron bursts in the plasma sheet and their relation with BBFs, J. Geophys. Res. Space Physics, 119, 8902–8915, doi:10.1002/2014JA020169, 2014.
Eastwood, J. P., Phan, T.-D., Mozer, F. S., Shay, M. A., Fu-jimoto, M., Retinò, A., Hesse, M., Balogh, A., Lucek, E. A., and Dandouras, I.: Multi-point observations of the Hall electromagnetic field and secondary island formation dur-ing magnetic reconnection, J. Geophys. Res., 112, A06235, doi:10.1029/2006JA012158, 2007.
Fu, H. S., Khotyaintsev, Y. V., Vaivads, A., Retinò, A., and An-dré, M.: Energetic electron acceleration by unsteady magnetic reconnection, Nat. Phys., 9, 426–430, doi:10.1038/NPHYS2664, 2013.
Gustafsson, G., André, M., Carozzi, T., Eriksson, A. I., Fältham-mar, C.-G., Grard, R., Holmgren, G., Holtet, J. A., Ivchenko, N., Karlsson, T., Khotyaintsev, Y., Klimov, S., Laakso, H., Lindqvist, P.-A., Lybekk, B., Marklund, G., Mozer, F., Mursula, K., Peder-sen, A., Popielawska, B., Savin, S., Stasiewicz, K., Tanskanen, P., Vaivads, A., and Wahlund, J.-E.: First results of electric field and density observations by Cluster EFW based on initial months of operation, Ann. Geophys., 19, 1219–1240, doi:10.5194/angeo-19-1219-2001, 2001.
Hoshino, M., Mukai, T., Terasawa, T., and Shinohara, I.: Suprather-mal electron acceleration in magnetic reconnection, J. Geophys. Res., 106, 4509–4530, 2001.
Huang, S. Y., Vaivads, A., Khotyaintsev, Y. V., Zhou, M., Fu, H. S., Retinò, A., Deng, X. H., André, M., Cully, C. M., He, J. S., Sahraoui, F., Yuan, Z. G., and Pang, Y.: Electron accelera-tion in the reconnecaccelera-tion diffusion region: Cluster observaaccelera-tions, Geophys. Res. Lett., 39, L11103, doi:10.1029/2012GL051946, 2012a.
Huang, S. Y., Zhou, M., Deng, X. H., Yuan, Z. G., Pang, Y., Wei, Q., Su, W., Li, H. M., and Wang, Q. Q.: Kinetic structure and wave properties associated with sharp dipolarization front observed by Cluster, Ann. Geophys., 30, 97-107, doi:10.5194/angeo-30-97-2012, 2012b.
Imada, S., Nakamura, R., Daly, P. W., Hoshino, M., Baumjohann, W., Mühlbachler, S., Balogh, A., and Rème, H.: Energetic elec-tron acceleration in the downstream reconnection outflow region, J. Geophys. Res., 112, A03202, doi:10.1029/2006JA011847, 2007.
Imada, S., Hirai, M., Hoshino, M., and Mukai, T.: Favorable con-ditions for energetic electron acceleration during magnetic re-connection in the Earth’s magnetotail, J. Geophys. Res., 116, A08217, doi:10.1029/2011JA016576, 2011.
Johnstone, A. D., Alsop, C., Burge, S., Carter, P. J., Coates, A. J., Coker, A. J., Fazakerley, A. N., Grande, M., Gowen, R. A., Gur-giolo, C., Hancock, B. K., Narheim, B., Preece, A., Sheather, P. H., Winningham, J. D., and Woodliffe, R. D.: PEACE: A plasma electron and current experiment, Space Sci. Rev., 79, 351–398, doi:10.1023/A:1004938001388, 1997.
Øieroset, M., Lin, R. P., Phan, T. D., Larson, D. E., and Bale, S. D.: Evidence for electron acceleration up to 300 keV in the magnetic reconnection diffusion region of Earth’s magnetotail, Phys. Rev. Lett., 89, 195001, doi:10.1103/PhysRevLett.89.195001, 2002. Pedersen, A., Lybekk, B., André, M., Eriksson, A., Masson, A.,
Mozer, F. S., Lindqvist, P.-A., Décréau, P. M. E., Dandouras, I., Sauvaud, J.-A., Fazakerley, A., Taylor, M., Paschmann, G., Svenes, K. R., Torkar, K., and Whipple, E.: Electron den-sity estimations derived from spacecraft potential measurements on Cluster in tenuous plasma regions, J. Geophys. Res., 113, A07S33, doi:10.1029/2007JA012636, 2008.
Pritchett, P. L.: Relativistic electron production during guide field magnetic reconnection, J. Geophys. Res., 111, A10212, doi:10.1029/2006JA011793, 2006.
Rème, H., Aoustin, C., Bosqued, J. M., Dandouras, I., Lavraud, B., Sauvaud, J. A., Barthe, A., Bouyssou, J., Camus, Th., Coeur-Joly, O., Cros, A., Cuvilo, J., Ducay, F., Garbarowitz, Y., Medale, J.
L., Penou, E., Perrier, H., Romefort, D., Rouzaud, J., Vallat, C., Alcaydé, D., Jacquey, C., Mazelle, C., d’Uston, C., Möbius, E., Kistler, L. M., Crocker, K., Granoff, M., Mouikis, C., Popecki, M., Vosbury, M., Klecker, B., Hovestadt, D., Kucharek, H., Kuenneth, E., Paschmann, G., Scholer, M., Sckopke, N., Seiden-schwang, E., Carlson, C. W., Curtis, D. W., Ingraham, C., Lin, R. P., McFadden, J. P., Parks, G. K., Phan, T., Formisano, V., Amata, E., Bavassano-Cattaneo, M. B., Baldetti, P., Bruno, R., Chion-chio, G., Di Lellis, A., Marcucci, M. F., Pallocchia, G., Korth, A., Daly, P. W., Graeve, B., Rosenbauer, H., Vasyliunas, V., Mc-Carthy, M., Wilber, M., Eliasson, L., Lundin, R., Olsen, S., Shel-ley, E. G., Fuselier, S., Ghielmetti, A. G., Lennartsson, W., Es-coubet, C. P., Balsiger, H., Friedel, R., Cao, J.-B., Kovrazhkin, R. A., Papamastorakis, I., Pellat, R., Scudder, J., and Sonnerup, B.: First multispacecraft ion measurements in and near the Earth’s magnetosphere with the identical Cluster ion spectrometry (CIS) experiment, Ann. Geophys., 19, 1303–1354, doi:10.5194/angeo-19-1303-2001, 2001.
Retinò, A., Nakamura, R., Vaivads, A., Khotyaintsev, Y., Hayakawa, T., Tanaka, K., Kasahara, S., Fujimoto, M., Shinohara, I., East-wood, J. P., André, M., Baumjohann, W., Daly, P. W., Kronberg, E. A., and Cornilleau-Wehrlin, N.: Cluster observations of ener-getic electrons and electromagnetic fields within a reconnecting thin current sheet in the Earth’s magnetotail, J. Geophys. Res., 113, A12215, doi:10.1029/2008JA013511, 2008.
Runov, A., Nakamura, R., Baumjohann, W., Treumann, R. A., Zhang, T. L., Volwerk, M., Voros, Z., Balogh, A., Glaßmeier, K.-H., Klecker, B., Rème, K.-H., and Kistler, L.: Current sheet structure near magnetic X-line observed by Cluster, Geophys. Res. Lett., 30, 1579, doi:10.1029/2002GL016730, 2003.
Sonnerup, B. U. O.: Magnetic field reconnection, in Solar System Plasma Physics, vol. 3, 45–118, Elsevier, New York, 1979. Wang, R., Du, A., Nakamura, R., Lu, Q., Khotyaintsev, Y. V.,
Volwerk, M., Zhang, T., Kronberg, E. A., Daly, P. W., and Fazakerley, A. N.: Observation of multiple sub-cavities adja-cent to single separatrix, Geophys. Res. Lett., 40, 2511–2517, doi:10.1002/grl.50537, 2013.
Wilken, B., Daly, P. W., Mall, U., Aarsnes, K., Baker, D. N., Belian, R. D., Blake, J. B., Borg, H., Büchner, J., Carter, M., Fennell, J. F., Friedel, R., Fritz, T. A., Gliem, F., Grande, M., Kecskemety, K., Kettmann, G., Korth, A., Livi, S., McKenna-Lawlor, S., Mur-sula, K., Nikutowski, B., Perry, C. H., Pu, Z. Y., Roeder, J., Reeves, G. D., Sarris, E. T., Sandahl, I., Søraas, F., Woch, J., and Zong, Q.-G.: First results from the RAPID imaging ener-getic particle spectrometer on board Cluster, Ann. Geophys., 19, 1355–1366, doi:10.5194/angeo-19-1355-2001, 2001.
Zhou, M., Ashour-Abdalla, M., Deng, X., Schriver, D., El-Alaoui, M., and Pang, Y.: THEMIS observation of multi-ple dipolarization fronts and associated wave characteristics in the near-Earth magnetotail, Geophys. Res. Lett., 36, L20107, doi:10.1029/2009GL040663, 2009.
Zhou, M., Pang, Y., Deng, X. H., Yuan, Z. G., and Huang, S. Y.: Density cavity in magnetic reconnection diffusion region in the presence of guide field, J. Geophys. Res., 116, A06222, doi:10.1029/2010JA016324, 2011.
Zhou, M., Li, H., Deng, X., Huang, S., Pang, Y., Yuan, Z., Xu, X., and Tang, R.: Characteristic distribution and possi-ble roles of waves around the lower hybrid frequency in the magnetotail reconnection region, J. Geophys. Res.-Space, 119, doi:10.1002/2014JA019978, 2014.