A Comparative Study of Gender and Age Classification in
Speech Signals
M. H. Sedaaghi*
Abstract: Accurate gender classification is useful in speech and speaker recognition as
well as speech emotion classification, because a better performance has been reported when separate acoustic models are employed for males and females. Gender classification is also apparent in face recognition, video summarization, human-robot interaction, etc. Although gender classification is rather mature in applications dealing with images, it is still in its infancy in speech processing. Age classification, on the other hand, is also concerned as a useful tool in different applications, like issuing different permission levels for different aging groups. This paper concentrates on a comparative study of gender and age classification algorithms applied to speech signal. Experimental results are reported for the Danish Emotional Speech database (DES) and English Language Speech Database for Speaker Recognition (ELSDSR). The Bayes classifier using sequential floating forward selection (SFFS) for feature selection, probabilistic Neural Networks (PNNs), support vector machines (SVMs), the K nearest neighbor (K-NN) and Gaussian mixture model (GMM), as different classifiers, are empirically compared in order to determine the best classifier for gender and age classification when speech signal is processed. It is proven that gender classification can be performed with an accuracy of 95\% approximately using speech signal either from both genders or male and female separately. The accuracy for age classification is about 88%.
Keywords: Gender classification, age classification, emotional speech, support vector
machines, K-nearest neighbor classifier, probabilistic neural networks, Bayes classifier, sequential floating forward selection, Gaussian mixture model.
1 Introduction 1
Automatic speech recognition and speaker verification can be successfully accomplished under rather highly constrained conditions [1]. Factors that limit speech and speaker recognition systems include the inability to identify acoustic features sensitive to the task and yet robust enough to accommodate speaker articulation differences, prosodic variations, vocal tract differences, that influence recognition ability [1]. An automatic gender classifier assists the development of improved male and female voice synthesizers [2–4]. One should bear in mind that gender information is time-invariant, phoneme-independent, and identity-independent for speakers of the same gender [1]. In [5], an accent classification method is introduced on the top of gender classification. Vergin et al. claim that the use of
Iranian Journal of Electrical & Electronic Engineering, 2009. Paper first received 08 Apr. 2008 and in revised form 12 Nov. 2008. * The Author is with the Department of Electrical Engineering, Sahand University of Technology, Tabriz, Iran.
E-mail: [email protected]
dependent acoustic-phonetic models reduces the word error rate of the baseline speech recognition system by 1.6% [6]. In [7], a set of acoustic and pitch features along with different classifiers is tested for gender identification. The fusion of features and classifiers is shown to perform better than any individual classifier.
A gender classification system is proposed in [8] based on Gaussian mixture models of speech features. Metze et al. have compared four approaches for age and gender recognition using telephone speech [9]. Gender cues extracted from the speech signal are useful in content-based multimedia indexing as well [7]. Gender-dependent speech emotion recognizers have been shown to perform better than gender-independent ones for five emotional state [10, 11] in the Danish Emotional Speech Database (DES) [12]. However, gender information is taken for granted there. The most closely related work to the present one is that of Xiao et al. [13], where gender classification was incorporated in emotional speech recognition system using a wrapper approach based on back-propagation neural networks with
sequential forward selection. An accuracy of 94.65% was reported for gender classification in the Berlin dataset [14].
The interest in gender classification is not limited to speech processing. A successful gender classification approach can boost the performance of many other applications including face recognition or human-computer interfaces [3]. A remarkable success has been achieved in biometric person authentication, such as face detection and recognition. Moghaddam et al. have employed support vector machines (SVMs) for visual gender classification [15]. A gender classifier with good performance using frontal facial images has been reported in [16]. An experimental study on automatic face gender classification is presented in [17] where a system is built that mainly consists of four parts: face detection, face alignment, texture normalization, and gender classification. Kim et al. have investigated the discrimination between facial images of men and women [18]. Gender classification is considered as a fundamental estimation problem, where classification is achieved by boosting local binary pattern-based classifiers [19]. An automated system classifying gender by utilizing a set of human gait data is proposed in [20]. The problem of gender classification has burgeoned at a rapid rate in the past decade and widely studied in psychology. Algorithms employed by humans in order to classify facial images with respect to their gender are investigated in [21].
Age, on the other hand, is concerned as an important automatic classification parameter in lots of applications, e.g., permitting special age groups to get access to special premises, or issuing different prices when buying goods for different aging groups. It has also been stated by many researchers [22–27]. The proposed method in [24] by Schotz estimates speaker age with an aim at increasing the phonetic knowledge of age. Acoustic features are extracted from the four phonemes of the Swedish word /ra:sa/ (collapse) produced by 428 adult Swedish speakers, and then used to build classification and regression trees for prediction of age, age group and gender. Minematsu et al. in [28] carried out age estimation tests with 30 listeners for 400 male speakers, and then used two methods to model the speakers with GMMs (Gaussian Mixture Models) [24]. Kwon et. al. in [29] present a theory and practical computations for visual age classification from facial images for three age groups of a baby, young adult, and senior adult. An age group classification system for gray-scale facial images is proposed in [30]. Four age groups, including babies, young adults, middle-aged adults, and old adults, are used in their classification system. A framework of age-group classification using facial images under various lighting conditions is
reported in [31]. Age classification based on speech has been reported in [9, 32–34].
The aforementioned research motivated us to employ several classifiers and assess their performance in gender and age classification by processing emotional speech, i.e. utterances from DES database [12] as an emotional speech and ELSDSR [35] which is a normal speech database. The author has already investigated gender classification in emotional speech [4]. In this paper, different classifiers are examined on both databases, such as the Bayes classifier with sequential floating forward feature selection (SFFS) [36, 37], probabilistic neural networks (PNNs) [38], SVMs [39, 40], K-nearest neighbor (K-NNs) [41, 42] and GMM classifiers [24, 43, 44]. Although techniques based on hidden Markov models (HMMs) [45] could be applied for gender and age classification in principle, they are not included in this study, because temporal information is ignored. In this research related to age classification, we only aim to classify whether the speaker’s age is below and/or above a pre-determined years, i.e., a binary decision for senior/non-senior adults
.
The outline of the paper is as follows. The extracted features are enumerated in Section 2. The classifiers included in the comparative study are described in Section 3. Section 4 briefly describes DES and ELSDSR. Experimental results for gender and age classification are reported in Section 5, and conclusions are drawn in Section 6.
2 Feature extraction
The statistical features employed in our study are grouped in several classes and have been demonstrated below. The same features have been adopted from [46].
• Formant features: The set of formants features indexed by 1-16 is comprised by statistics of the 4 formant frequency contours.
1-4: Mean value of the first, second, third, and fourth formant. 5-8: Maximum value of the first, second, third, and fourth formant.
9-12: Minimum value of the first, second, third, and fourth formant.
13-16: Variance of the first, second, third, and fourth formant. • Pitch features: Pitch features, indexed by 17-51, are
statistical properties of the pitch contour. The plateaux of the contours are detected as follows. The first and second derivative of the contour are estimated numerically. The derivatives are smoothed with a moving average filter. If the first derivative is approximately zero and the second derivative is positive, the point belongs to a plateau at a local minimum. If the second derivative is negative, it belongs to a plateau at a local maximum.
17-21: Maximum, minimum, mean, median, inter-quartile range of pitch values.
22: Pitch existence in the utterance expressed in percentage (0-100%).
23-26: Maximum, mean, median, interquartile range of durations for the plateaux at minima.
27-29: Mean, median, interquartile range of pitch values for the plateaux at minima.
30-34: Maximum, mean, median, interquartile range, upper limit (90%) of durations for the plateaux at maxima.
35-37: Mean, median, interquartile range of the pitch values within the plateaux at maxima.
38-41: Maximum, mean, median, interquartile range of durations of the rising slopes of pitch contours.
42-44: Mean, median, interquartile range of the pitch values within the rising slopes of pitch contours.
45-48: Maximum, mean, median, interquartile range of durations of the falling slopes of pitch contours.
49-51: Mean, median, interquartile range of the pitch values within the falling slopes of pitch contours.
• Intensity (Energy) features: Energy features, indexed by 52-85, are statistical properties of the energy contour.
52-56: Maximum, minimum, mean, median, interquartile range of energy values.
57-60: Maximum, mean, median, interquartile range of durations for the plateaux at minima.
61-63: Mean, median, interquartile range of energy values for the plateaux at minima.
64-68: Maximum, mean, median, interquartile range, upper limit (90%) of duration
for the plateaux at maxima.
69-71: Mean, median, interquartile range of the energy values within the plateaux at maxima.
72-75: Maximum, mean, median, interquartile range of durations of the rising slopes of energy contours.
76-78: Mean, median, interquartile range of the energy values within the rising slopes of energy contours.
79-82: Maximum, mean, median, interquartile range of durations of the falling slopes of energy contours.
83-85: Mean, median, interquartile range of the energy values within the falling slopes of energy contours.
• Spectral features: Features indexed by 86-113 quantify the energy content in certain frequency bands divided by the utterance duration.
86-93: Energy below 250, 600, 1000, 1500, 2100, 2800, 3500, 3950 Hz.
94-100: Energy in the frequency bands 250-600, 600-1000, 1000-1500, 1500-2100, 2100-2800, 2800-3500, 3500-3950 Hz.
101-106: Energy in the frequency bands 250-1000, 600-1500, 1000-2100, 1500-2800, 2100-3500, 2800-3950 Hz.
107-111: Energy in the frequency bands 250-1500, 600-2100, 1000-2800, 1500-3500, 2100-3950 Hz.
112-113: Energy ratio between the frequency bands (3950-2100) and 0) and between the frequency bands (2100-1000) and (1000-0) Hz.
Not all the features can be extracted from each utterance. For example, some pitch contours do not have plateaux below 45% of their maximum pitch value, or some utterances do not have pitch at all because they are unvoiced. When a large number of missing feature values is met, the corresponding feature is discarded. Such discarded features are indexed by {8, 23-29, 33-34, 41, 48, 57-63, 67, 75, 82, 105}. For the aforementioned features, the frequency of missing feature values varies between 2% and 70%. When the missing feature values are less than 1% of the total number of corresponding feature values extracted, the missing values are replaced by their mean. As a result, finally, only K=90 features were retained.
3 Classifiers
The output of speech gender or age classifier is a prediction value (label) of the actual speaker’s gender or age. In order to evaluate the performance of a classifier, the repeated s-fold cross-validation method is used. According to this method if s = 20, the utterances in the data collection are divided into a training set containing 80% of the available data and a disjoint test set containing the remaining 20% of the data. The procedure is repeated for s = 20 times. The training and the test sets are selected randomly. The classifier is trained using the training set and the classification error is estimated on the test set. The estimated classification error is the average classification error over all repetitions [47].
The following classifiers have been investigated: 1. Naive Bayes classifier using the SFFS feature selection method [37]. The SFFS consists of a forward (inclusion) step and a conditional backward (exclusion) step that partially avoids local optima. In our approach, feature selection is used in order to determine a set of 20 features that yields the lowest prediction error for a fixed number of cross-validation repetitions, e.g. 20. 2. Probabilistic Neural Networks (PNNs) [38]. PNNs are a kind of radial basis function (RBF) networks suitable for classification problems. A PNN employs an input, a hidden, and an output layer. The input nodes forward the values admitted by patterns to the hidden layer ones. The hidden layer nodes are as many as the input nodes. They are simply RBFs that nonlinearly transform pattern values to activations. The nodes at the output layer are as many as the classes. Each node sums the activation values weighted possibly by proper weights. The input pattern is finally classified to the class associated to the output node whose value is maximum. PNNs with a spread parameter equal to 0.1 are found to yield the best results. If the spread
parameter is near zero, the network acts as a nearest neighbor classifier. As the spread parameter becomes large, the network takes into account several nearby patterns.
3. Support vector machines (SVMs) [39, 40]. The following definitions for SVM have been adopted from [48]. Let {xi, yi}, i = 1, …,N denote N training examples
where xi comprises an K-dimensional pattern and yi is
its class label. Without any loss of generality, we shall confine ourselves to the two-class pattern recognition problem. That is, yi
∈
{−1, 1}. Let Φ denote a nonlinearmap Φ: RK→
H
whereH
is a higher-dimensional Hilbert space. SVMs construct the optimal separating hyperplane inH
. Therefore, their decision boundary is of the form:∑
=α +=sign[ Ni1 iyiK(x,xi b)]
) x (
f (1)
where K(z1, z2) is a kernel function that defines the dot
product between Φ (z1) and Φ (z2) in
H
, and αi are thenonnegative Lagrange multipliers associated with the quadratic optimization problem that aims to maximize the distance between the two classes measured in
H
subject to the constraints
( )
1 for 1 1 for 1{
≥≤ ==+−+
ii y y i
T
b
x
W
φ
(2)Where W and b are the parameters of the optimal separating hyperplane in
H
. That is, W is the normal vector to the hyperplane, b W is the perpendicular distance from the hyperplane to the origin, and ||W|| denotes the Euclidian norm of vector W. The use of kernel functions eliminates the need for an explicit definition of the nonlinear mapping Φ, because the data appear in the training algorithm of SVM only as dot products of their mappings. SVMs with five different kernels have been used. Training was performed by the least-squares method. The following kernel functions have been tested; (1): Gaussian RBF, denoted SVM1. (2): Multilayer perceptron, denoted SVM2. (3): Quadratic, denoted SVM3. (4): Linear, denoted SVM4. (5): Cubic polynomial, denoted SVM5.4. For K-NNs, it is hard to find systematic methods for selecting the optimum number of the closest neighbors and the most suitable distance. If K=1, then the classifier will classify all the utterances in the design set correctly, but its performance on the test set will be poor. As K → ∞, a less biased classifier is obtained. However, the optimality is not feasible for a finite number of utterances in the latter case [49]. Four K-NNs have been employed with different distance functions, such as the Euclidean, denoted as KNN1, cityblock (i.e., sum of absolute differences), denoted as KNN2, cosine-based (i.e. one minus the cosine of the included angle between patterns), denoted as KNN3 and correlation-based (i.e. one minus the sample correlation between patterns), denoted as KNN4, respectively. We have
selected K=2 in all experiments. Other values of K did not affect the classification accuracy.
5. Gaussian mixture model (GMM) have been employed in many fields, e.g., speech and speaker recognition ([43, 44]). In GMM, during the training phase, pdf (probability density function) parameters for each class (gender or age) are estimated. Then, during the classification phase, a decision is taken for each test utterance by computing the maximum likelihood criterion. GMM is a combination of K Gaussian laws. Each law in the mixture is weighted and specified by two parameters: the mean and the covariance matrix ΣK.
4 Datasets
In one of the employed databases, Data stem from Danish Emotional Speech (DES) database, which is publicly available and well-annotated [12]. The recordings in DES include utterances expressed by two professional actors and two actresses in five different emotional states (anger, happiness, neutral, sadness, and surprise). One of the actors and also an actress are both 52 years old. The other actor and actress are 38 and 34 years old, respectively. Therefore, we have made an age threshold, i.e., 45 years. One actor and also one actress are older than 45 and the other two are younger than 45 years. The utterances correspond to isolated words, sentences, and paragraphs. For example: Nej (No), Ja (Yes), Kom med dig (Come with me!). The complete database comprises approximately 30 minutes of speech. To test the quality of the simulated emotional speech, a listening test has been performed by the creators of the database, where 20 normal-hearing listeners (10 from each gender) were asked if they could identify the emotional content of the recorded utterances. The emotional states were correctly identified with an average rate of 67%. In this paper, we only concentrate on gender and age classification. Overall, 1160 utterances (360 utterances corresponding to words and sentences and another 800 utterances extracted from paragraphs) have been used that are equally split into 580 utterances uttered by male speakers and another 580 utterances uttered by female ones. Each utterance corresponds to a speech segment between two silence pauses.
As second database, English Language Speech Database for Speaker Recognition (ELSDSR) [35] is employed. ELSDSR corpus of read speech has been designed to provide speech data for the development and evaluation of automatic speaker recognition system. ELSDSR corpus design was a joint effort of the faculty, Ph.D. students and Master students from department of Informatics and Mathematical Modeling (IMM) at Technical University of Denmark (DTU). The speech language is English, and spoken by 21 Dane, one Islander and one Canadian. Due to the usage of this
database and some realistic factors, perfect or even correct pronunciation is not required and necessary for getting the specific and uniquely identifiable characteristics for individual. Ten of the speakers are female while there are 13 male speakers. Six of the female and 3 of male speakers are older than 33 years. Part of the text, which is suggested as training subdivision, was made with the attempt to capture all the possible pronunciation of English language, which includes the vowels, consonants and diphthongs. With the suggested training and test subdivision, seven paragraphs of text are constructed and collected for training, which includes 11 sentences; and 46 sentences (each speaker reads two of these sentences) from NOVA Home were collected for test text. In a word, for the training set, 161 (7*23) utterances were recorded; and for test set, 46 (2*23) utterances were provided. We consider the train and test sentences as a unique information for gender and age classification and cut the sentences into small ones. This leads to 4170 utterances. It provides a good source for gender and age classification. The age threshold for ELSDSR database is 33 years.
5 Results
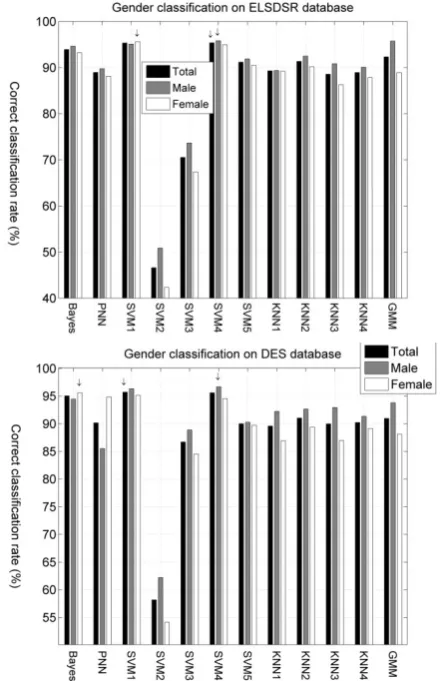
Fig. 1 illustrates the correct classification rates, for gender classification of two databases achieved by each of the aforementioned 11 classifiers, when 20% of the total utterances have been used for testing. For each classifier, 3 columns are given. The leftmost column (black) shows the total correct classification rate. The middle (gray) and the rightmost (white) columns are the classification rates that correspond to correct matches between the actual speaker gender (i.e. the ground truth) and the gender prediction by the classifier for male and female speakers, separately. In the sequel, the total correct gender classification rate, the correct gender classification rate for male speakers, and the correct gender classification rate for female speakers are abbreviated as GTCCR, GMCCR, and GFCCR, respectively. In Fig. 1, the maximum and minimum GTCCR were obtained by the SVM1 (95.73%) and the SVM2 (58.17%), respectively. The maximum and minimum GMCCR were related to SVM4 (96.67%) and SVM2 (62.22%), respectively. For GFCCR, the maximum and minimum values were obtained by the Bayes classifier with SFFS (95.61%) and SVM2 (54.13%), respectively. These scores are reported for DES. For ELSDSR, in Fig. 1, the maximum and minimum GTCCR were obtained by the SVM4 (95.37%) and the SVM2 (46.60%), respectively. The maximum and minimum GMCCR were related to SVM4 (95.81%) and SVM2 (50.88%), respectively. For GFCCR, the maximum and minimum values were obtained by the SVM1 (95.59%) and SVM2 (42.32%), respectively.
Fig. 1. Correct gender classification rates for the different methods on DES (up) and ELSDSR (down) databases when the size of test utterances is 20% of the total utterances (i.e., 232). For each classifier, columns “Total”, ”Male”, and ”Female” correspond to the total correct gender classification rate, the rate of correct matches between the actual gender and the predicted one by the classifier for utterances uttered by male speakers, and the rate of correct matches between the actual gender and the predicted one by the classifier for utterances uttered by female speakers, respectively. The arrows indicate the best rates.
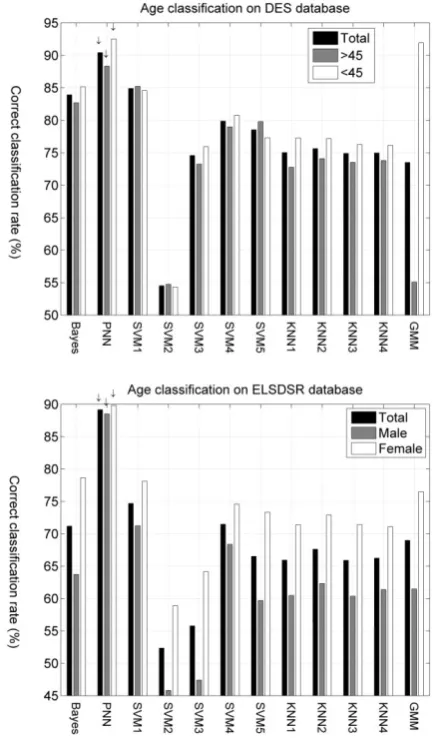
The threshold for age grouping in DES and ELSDSR is 45 and 33 years, respectively. Fig. 2 demonstrates the correct classification rates, for age classification on DES and ELSDSR databases achieved by each of the aforementioned 11 classifiers, when 20% of the total utterances have been used for testing. The leftmost column (black) shows the total correct classification rate. The middle (gray) and the rightmost (white) columns are the classification rates that correspond to correct matches between the actual speaker age to be greater or less than 45 (33) years old (i.e. the ground truth) and the age prediction by the classifier for speakers whose ages are above or below 45 (33) years, separately for DES (ELSDSR). In the
following, the total correct age classification rate, the correct age classification rate for speakers older than 45 (33) years, and the correct age classification rate for speakers younger than 45 (33) are abbreviated as ATOT, AGT45 (AGT33), and ALT45 (ALT33), respectively. Fig. 2 illustrates the maximum rate for ATOT, AGT45, and ALT45 belonging to PNN2 with 90.13%, 87.93%, and 92.34%, respectively for DES. In Fig. 2, the minimum rate for ATOT, AGT45, and ALT45 belong to SVM2, with rates 55.5%, 55.81%, and 55.29%, respectively. Fig. 2 illustrates the maximum rate for ATOT, AGT33, and ALT33 belonging to PNN2 with 89.17%, 88.51%, and 89.83%, respectively. In Fig. 2, the minimum rate for ATOT, AGT33, and ALT33 belong to SVM2, with rates 52.35%, 45.81%, and 58.88%, respectively.
In the following, we concentrate on the top four methods, i.e., PNN, the Bayes classifier with SFFS, SVM1, and SVM4. Table 1 demonstrates the confusion matrix on DES database for gender classification of the four top methods after running each method several times and taking the mean value. The correct classification rates for each gender are shown in boldface. SVM1 outperforms the other methods achieving a correct classification rate (GTCCR) of 95.73% with a standard deviation of 1.29%. SVM4 is the best classifier, when the correct matches are between the actual gender and the predicted one by the classifier are measured for actors’ utterances (GMCCR), yielding a rate of 96.67%. The Bayes classifier using SFFS achieves a rate of 95.61%, when the correct matches between the actual gender and the predicted one by the classifier are measured for actresses’ utterances (GFCCR). GTCCR for the Bayes classifier using SFFS is 95.04% with a standard deviation of 1.23%. GMCCR for Bayes classifier with SFFS is 94.46%. The GTCCR for SVM4 and PNN are 95.60% (with a standard deviation of 1.40%) and 90.18% (with a standard deviation of 1.91%), respectively. GMCCR for SVM1 and PNN is 96.33% and 85.52%, respectively, while GFCCR for these two is 95.12% and 94.83%, respectively. The GFCCR for SVM4 is 94.52%.
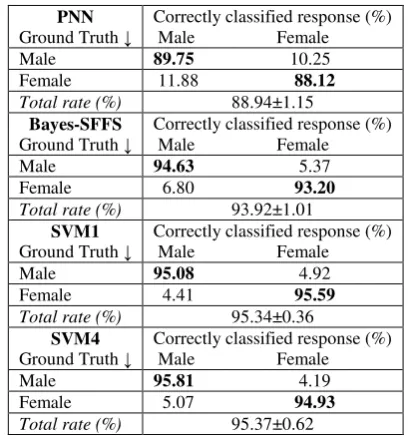
Table 2 demonstrates the confusion matrix on ELSDSR database for gender classification of the four top methods after running each method several times and taking the mean value. The correct classification rates for each gender are shown in boldface. SVM4 outperforms the other methods achieving a correct classification rate (GTCCR) of 95.37% with a standard deviation of 0.62%. SVM4 is the best classifier, when the correct matches are between the actual gender and the predicted one by the classifier are measured for actors’ utterances (GMCCR), yielding a rate of 95.81%. SVM1 achieves a rate of 95.59%, when the correct matches between the actual gender and the predicted
one by the classifier are measured for actresses’ utterances (GFCCR). GTCCR for SVM1 is 95.34% with a standard deviation of 0.36%. GFCCR for SVM4 is 94.93%. GMCCR is 95.08% for SVM1. GTCCR for the Bayes classifier using SFFS and PNN is 93.92% with a standard deviation of 1.01% and 88.94% wit a standard deviation of 1.15%. GMCCR and GFCCR for Bayes classifier are 94.63% and 93.20%. GMCCR and GFCCR for PNN are 89.75% and 88.12%..
Fig. 2. Correct age classification rates for the different methods on DES (up) and ELSDSR (down) databases when the size of test utterances is 20% of the total utterances (i.e., 232). For each classifier, columns “Total”, ”>45” (“> 33”), and ”<45” (“<33”) correspond to the total correct age classification rate, the rate of correct matches between the actual age and the predicted one by the classifier for utterances uttered by speakers with age older than 45 (33) years, and the rate of correct matches between the actual age and the predicted one by the classifier for utterances uttered by speakers younger than 45 (33) years, respectively. The arrows highlight the best rates.
Table 1 Confusion matrix for the 4 best gender classification methods when 20% of the utterances are used for testing on DES database.
PNN Ground Truth ↓
Correctly classified response (%) Male Female Male 85.52 14.48 Female 5.17 94.83 Total rate (%) 90.18±1.91
Bayes-SFFS Ground Truth ↓
Correctly classified response (%) Male Female Male 94.46 5.54 Female 4.39 95.61 Total rate (%) 95.04±1.23
SVM1 Ground Truth ↓
Correctly classified response (%) Male Female Male 96.33 3.67 Female 4.88 95.12 Total rate (%) 95.73±1.29
SVM4 Ground Truth ↓
Correctly classified response (%) Male Female Male 96.67 3.33 Female 5.48 94.52 Total rate (%) 95.60±1.40
Table 2 Confusion matrix for the 4 best gender classification methods when 20% of the utterances are used for testing on ELSDSR database.
PNN Ground Truth ↓
Correctly classified response (%) Male Female Male 89.75 10.25 Female 11.88 88.12 Total rate (%) 88.94±1.15
Bayes-SFFS Ground Truth ↓
Correctly classified response (%) Male Female Male 94.63 5.37 Female 6.80 93.20 Total rate (%) 93.92±1.01
SVM1 Ground Truth ↓
Correctly classified response (%) Male Female Male 95.08 4.92 Female 4.41 95.59 Total rate (%) 95.34±0.36
SVM4 Ground Truth ↓
Correctly classified response (%) Male Female Male 95.81 4.19 Female 5.07 94.93 Total rate (%) 95.37±0.62
Table 3 demonstrates the confusion matrix on DES database for age classification of the four top methods after running each method several times and taking the mean value. The correct classification rates for each age group are shown in boldface. PNN outperforms the other methods achieving a correct classification rate of 90.43% (ATOT) with a standard deviation of 1.84%. PNN is also the best classifier, when the correct matches are between the actual age less than 45 years and the
predicted one by the classifier are measured for utterances related to age greater than 45 years (AGT45) and also less than 45 years (ALT45), yielding a rate of 88.34% and 92.51%. The Bayes classifier using SFFS achieves 83.92% for ATOT, 82.68% for AGT45 and 84.57% for ALT45. The ATOT for SVM1 and SVM4 is 84.90% and 79.87%, respectively. SVM1 and SVM4 rates for AGT45 are 85.23% and 78.98%, respectively, while their corresponding rates for ALT45 are 84.57% and 80.76%, respectively.
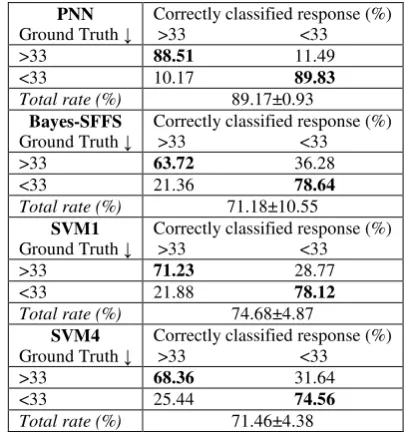
Table 4 demonstrates the confusion matrix on ELSDSR database for age classification of the four top methods after running each method several times and taking the mean value. The correct classification rates for each age group are shown in boldface. PNN outperforms the other methods achieving a correct classification rate of 90.43% (ATOT) with a standard deviation of 1.84%. PNN is also the best classifier, when the correct matches are between the actual age less than 33 years and the predicted one by the classifier are measured for utterances related to age greater than 33 years (AGT33) and also less than 33 years (ALT33), yielding a rate of 88.34% and 92.51%. The Bayes classifier using SFFS achieves 83.92% for ATOT, 82.68% for AGT33 and 84.57% for ALT33. The ATOT for SVM1 and SVM4 is 84.90% and 79.87%, respectively. SVM1 and SVM4 rates for AGT33 are 85.23% and 78.98%, respectively, while their corresponding rates for ALT33 are 84.57% and 80.76%, respectively.
Table 5 investigates, in detail, the behavior of best classifiers for gender and age classifications on DES dataset. It is understood that:
Table 3 Confusion matrix testing on DES database for the 4 best age classification methods when 20% of the utterances are used for testing.
PNN Ground Truth ↓
Correctly classified response (%) >45 <45 >45 88.34 11.66 <45 7.49 92.51 Total rate (%) 90.43±1.84
Bayes-SFFS Ground Truth ↓
Correctly classified response (%) >45 <45 >45 82.68 17.32 <45 14.84 85.16 Total rate (%) 83.92±1.48
SVM1 Ground Truth ↓
Correctly classified response (%) >45 <45 >45 85.23 14.77 <45 15.43 84.57 Total rate (%) 84.90±2.05
SVM4 Ground Truth ↓
Correctly classified response (%) >45 <45 >45 78.98 21.02 <45 19.24 80.76 Total rate (%) 79.87±2.32
Table 4 Confusion matrix testing on ELSDSR database for the 4 best age classification methods when 20% of the utterances are used for testing.
PNN Ground Truth ↓
Correctly classified response (%) >33 <33 >33 88.51 11.49 <33 10.17 89.83 Total rate (%) 89.17±0.93
Bayes-SFFS Ground Truth ↓
Correctly classified response (%) >33 <33 >33 63.72 36.28 <33 21.36 78.64 Total rate (%) 71.18±10.55
SVM1 Ground Truth ↓
Correctly classified response (%) >33 <33 >33 71.23 28.77 <33 21.88 78.12 Total rate (%) 74.68±4.87
SVM4 Ground Truth ↓
Correctly classified response (%) >33 <33 >33 68.36 31.64 <33 25.44 74.56 Total rate (%) 71.46±4.38
• SVM1 as gender classifier: 20% of the available utterances for testing yield the maximum value for GTCCR, and GFCCR, respectively, while 10% of the available utterances yield the maximum value for GMCCR. This is while 25% of the available utterances for testing yield the minimum value for GTCCR, GMCCR, and GFCCR.
• SVM1 as age classifier: 10% of the available utterances for testing yield the maximum value for GTCCR, GMCCR, and GFCCR. 50% of the test utterances yield the minimum value for ATOT and ALT45, while the minimum value for AGT45 is obtained with 35% of the utterances for testing.
• SVM4 as gender classifier: 20% of the available utterances for testing yield the maximum value for GTCCR, and GFCCR, respectively, while 25% of the available utterances yield the maximum value for GMCCR. 40%, 45%, and 50% of the available utterances for testing yield the minimum value for GTCCR, GMCCR, and GFCCR, respectively.
• SVM4 as age classifier: 15% of the available utterances for testing yield the maximum value for ATOT, AGT45, and ALT45. The minimum value for ATOT and ALT45 is produced by half of the utterances for testing, while 20% of them yield the minimum value for AGT45.
• PNN as gender classifier: 15% of the available utterances yield the maximum value for GTCCR and GMCCR, while 20% of the available utterances yield the maximum value for GFCCR. The minimum value for GTCCR and GFCCR is obtained by 50% of the utterances for testing, while 20% of them results in the minimum for GMCCR.
• PNN as age classifier: 15% of the available utterances for testing yield the maximum value for ATOT and AGT45, while 20% of the available utterances yield the maximum value for ALT45. 50% of the available utterances yield the minimum value for ATOT and ALT45, while 20% of the available utterances yield the minimum value for AGT45.
• Bayes classifier using SFFS when employed for gender and age classification behaves on DES database against the changes in parameters. The minimum GTCCR and GMCCR (93.36% and 91.21%, respectively) were measured when 30 and 40 repetitions, respectively, were made using 10% of the utterances for testing. The minimum GFCCR (94.08%) was measured when 50 repetitions were made using 25% of the utterances for testing. The maximum GTCCR and GFCCR were measured when 10 repetitions were made using 50% of the utterances for testing. The maximum GMCCR was measured when 30 repetitions were made using 45% of the utterances for testing. The minimum ATOT and AGT45 were measured when 30 repetitions were made using 10% of utterances for testing. The minimum ALT45 was measured when 10 repetitions were made using 15% of utterances for testing. The maximum ATOT, AGT45, and ALT45 were measured by making 30 repetitions for all and employing 50% of the available utterances for testing for ATOT and AGT45, and 40% for ALT45.
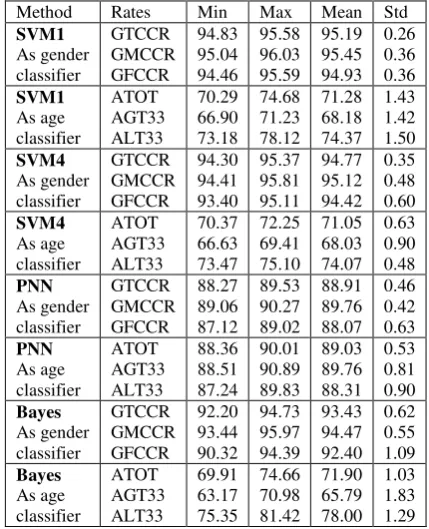
Table 6 shows, in detail, the behavior of best classifiers for gender and age classifications on ELSDSR database. The following results are inferred: • SVM1 as gender classifier: 10%, 30%, and 20% of the available utterances for testing yield the maximum values for GTCCR, GMCCR, and GFCCR, respectively. 45% of the available utterances for testing yield the minimum values for GTCCR and GMCCR. This is while half of the available utterances for testing yields the minimum value for GFCCR.
• SVM1 as age classifier: 20% of the available utterances for testing yield the maximum value for GTCCR, GMCCR, and GFCCR. 50% of the test utterances yield the minimum value for ATOT and AGT33, while the minimum value for ALT33 is obtained with 15% of the utterances for testing.
• SVM4 as gender classifier: 20% of the available utterances for testing yield the maximum value for GTCCR, and GMCCR, respectively, while 25% of the available utterances yield the maximum value for GFCCR. 10% of the available utterances for testing yield the minimum values for GTCCR, and GFCCR, respectively, while the minimum value for GMCCR is obtained by employing 45% of the available utterances for testing.
• SVM4 as age classifier: 10% of the available utterances for testing yield the maximum values for
ATOT, AGT33, and ALT33. The minimum value for ATOT and AGT33 is produced by 45% of the utterances for testing, while half of them yield the minimum value for ALT33.
• PNN as gender classifier: 15% of the available utterances yield the maximum value for GTCCR and GMCCR, while 30% of the available utterances yield the maximum value for GFCCR. The minimum values for GTCCR and GMCCR are obtained by 50% of the utterances for testing, while 35% of them results in the minimum for GMCCR.
• PNN as age classifier: 20% of the available utterances for testing yield the maximum value for ATOT and AGT33, while 25% of the available utterances yield the maximum value for ALT33. 10% of the available utterances yield the minimum value for ATOT and ALT33, while 45% of the available utterances yield the minimum value for AGT33.
• Bayes classifier using SFFS when employed for gender classification behaves on ELSDSR database against the changes in parameters. The minimum GTCCR and GMCCR (92.20% and 93.44%, respectively) were measured when 40 and 10 repetitions, respectively, were made using 15% of the utterances for testing. The minimum GFCCR (90.32%) was measured when 30 repetitions were made using 10% of the utterances for testing. The maximum GMCCR and GFCCR were measured when 20 repetitions were made using 40% and 50% of the utterances for testing, respectively. The maximum GTCCR was measured when 10 repetitions were made using 30% of the utterances for testing. The minimum ATOT, AGT33 and ALT33 were measured when 50, 10 and 20 repetitions were made using 20%, 40% and 15% of utterances for testing, respectively. The maximum ATOT, AGT33, and ALT33 were measured by making 20, 40 and 50 repetitions employing 50%, 45% and 50% of the available utterances for testing, respectively.
Accordingly, SVM1 outperforms the other methods for gender classification. We will also suggest PNN for age classification considering all factors. In both gender and age classification, SVM4 had the least variance among other methods. It means that SVM4 is robust against the modification of the portion of the utterances for testing.
6 Conclusion
We have investigated several popular methods for gender and age classification by processing emotionally colored speech from the DES database and also ELSDSR dataset as an ordinary speech. The SVM with a suitable kernel has demonstrated to yield the most accurate results for gender classification. The correct age classification rates have been 88.38% when total correct age rate was considered. This is achieved by
probabilistic neural networks. Our future work will concentrate on an investigation of fusing the gender and age classification schemes.
Table 5 Behavior of best classifiers for gender and age classifications on DES database.
Method Rates Min Max Mean Std SVM1 As gender classifier GTCCR GMCCR GFCCR 93.32 93.63 93.01 95.73 97.49 95.12 94.77 95.58 93.95 0.76 1.13 0.79 SVM1 As age classifier ATOT AGT45 ALT45 82.59 82.79 82.26 86.89 85.66 88.13 84.68 84.40 84.97 1.45 1.28 1.81 SVM4 As gender classifier GTCCR GMCCR GFCCR 93.49 94.21 91.87 95.60 96.80 94.52 94.24 95.46 93.03 0.73 0.97 0.96 SVM4 As age classifier ATOT AGT45 ALT45 78.68 78.98 78.13 83.86 83.53 84.17 80.88 80.74 81.04 1.85 1.80 2.23 PNN As gender classifier GTCCR GMCCR GFCCR 88.93 85.52 90.76 91.95 91.03 94.83 90.10 87.89 92.32 0.98 1.88 1.13 PNN As age classifier ATOT AGT45 ALT45 88.98 86.59 91.36 90.94 89.93 93.28 90.13 88.01 92.24 0.76 1.23 0.62 Bayes As gender classifier GTCCR GMCCR GFCCR 93.36 91.21 94.08 97.14 97.17 98.23 95.40 94.46 96.35 0.90 1.42 0.95 Bayes As age classifier ATOT AGT45 ALT45 81.62 78.41 82.32 87.98 90.70 89.36 84.56 83.52 85.59 1.86 3.12 1.52
Table 6 Behavior of best classifiers for gender and age classifications on ELSDSR database.
Method Rates Min Max Mean Std SVM1 As gender classifier GTCCR GMCCR GFCCR 94.83 95.04 94.46 95.58 96.03 95.59 95.19 95.45 94.93 0.26 0.36 0.36 SVM1 As age classifier ATOT AGT33 ALT33 70.29 66.90 73.18 74.68 71.23 78.12 71.28 68.18 74.37 1.43 1.42 1.50 SVM4 As gender classifier GTCCR GMCCR GFCCR 94.30 94.41 93.40 95.37 95.81 95.11 94.77 95.12 94.42 0.35 0.48 0.60 SVM4 As age classifier ATOT AGT33 ALT33 70.37 66.63 73.47 72.25 69.41 75.10 71.05 68.03 74.07 0.63 0.90 0.48 PNN As gender classifier GTCCR GMCCR GFCCR 88.27 89.06 87.12 89.53 90.27 89.02 88.91 89.76 88.07 0.46 0.42 0.63 PNN As age classifier ATOT AGT33 ALT33 88.36 88.51 87.24 90.01 90.89 89.83 89.03 89.76 88.31 0.53 0.81 0.90 Bayes As gender classifier GTCCR GMCCR GFCCR 92.20 93.44 90.32 94.73 95.97 94.39 93.43 94.47 92.40 0.62 0.55 1.09 Bayes As age classifier ATOT AGT33 ALT33 69.91 63.17 75.35 74.66 70.98 81.42 71.90 65.79 78.00 1.03 1.83 1.29
References
[1] Wu K. and Childers D. G., “Gender recognition from speech. Part I: Coarse analysis”, J. Acoust. Soc. of Am., Vol. 90, No. 4, pp. 1828–1840, 1991. [2] Childers D. G., Wu K. and Hicks D. M., “Factors in voice quality: acoustic features related to gender”, In Proc. IEEE Int. Conf. Acoustics, Speech, and Signal Processing, Vol. 1, pp. 293– 296, 1987.
[3] Childers D. G., Wu K., Bae K. S. and Hicks D. M., “Automatic gender recognition of gender by voice”, In Proc. IEEE Int. Conf. Acoustics, Speech, and Signal Processing, Vol. 1, pp. 603– 606, 1988.
[4] Sedaaghi M. H., “Gender classification in emotional speech”, In Speech Recognition: Technologies and Applications, pp. 363–376, I-Tech, Vienna, Austria, 2008.
[5] Xiaofan L. and Simske S., “Phoneme-less hierarchical accent classification”, In Proc. 38th. Asilomar Conf. Signals, Systems and Computers, Vol. 2, pp. 1801–1804. California, 2004.
[6] Vergin R., Farhat A. and O’Shaughnessy D., “Robust gender-dependent acoustic phonetic modelling in continuous speech recognition based on a new automatic male/female classification”,
In Proc. Int. IEEE Conf. Acoustics, Speech, and Signal Processing (ICASSP-96), Vol. 2, pp. 1081–1084. Atlanta, May 7-10 1996.
[7] Harb H. and Chen L., “Voice-based gender identification in multimedia applications”, J. Intelligent Information Systems, Vol. 24, No. 2, pp. 179–198, 2005.
[8] Zeng Y., Wu Z., Falk T. and Chan W. Y., “Robust GMM based gender classification using pitch and RASTA-PLP parameters of speech”, In Proc. 5th. IEEE Int. Conf. Machine Learning and Cybernetics, pp. 3376–3379. China, 2006. [9] Metze F., Ajmera J., Englert R., Bub U.,
Burkhardt F., Stegmann J., Muller C., Huber R., Andrassy B., Bauer J. G. and Littel B., “Comparison of four approaches to age and gender recognition for telephone applications”, In Proc. 2007 IEEE Int. Conf. Acoustics, Speech and Signal Processing, Vol. 4, pp. 1089–1092. Honolulu, April 15-20 2007.
[10] Ververidis D. and Kotropoulos C., “Automatic speech classification to five emotional states based on gender information”, In Proc. European Signal Processing Conf. (EUSIPCO 04), Vol. 1, pp. 341–344, Vienna, Austria, Sep. 6-10 2004. [11] Lin Y. L. and Wei G., “Speech emotion
recognition based on HMM and SVM”, In Proc. IEEE Int. Conf. Machine Learning and
Cybernetics, Vol. 8, pp. 4898–4901. Guangzhou, China, 2005.
[12] Engberg I. S. and Hansen A. V., “Documentation of the Danish Emotional Speech database (DES)”,
Technical Report Internal AAU report, Center for Person, Kommunikation, Aalborg Univ., Denmark, 1996.
[13] Xiao Z., Dellandréa E., Dou W. and Chen L., “Hierarchical classification of emotional speech”,
Technical Report RR-LIRIS-2007-06, LIRIS UMR 5205 CNRS, 2007.
[14] Burkhardt F., Paeschke A., Rolfes M., Sendlmeier W. and Weiss B., “A database of German Emotional Speech”, In Proc. Interspeech 2005 Conf., Lisbon, Portugal, 2005.
[15] Moghaddam B. and Yang M. H., “Gender classification with support vector machines”, In Proc. 4th. IEEE Int. Conf. Automatic Face and Gesture Recognition, pp. 306–311. Grenoble, France, 2000.
[16] Jain A. and Huang J., “Integrating independent components and linear discriminant analysis for gender Classification”, In Proc. 6th. IEEE Int. Conf. Automatic Face and Gesture Recognition, pp. 159–163, Seoul, 2004.
[17] Yang Z., Li M. and Ai H., “An experimental study on automatic face gender classification”, In Proc. 18th. IEEE Int. Conf. Pattern Recognition (ICPR-2006), Vol. 3, pp. 1099–1102, Hong Kong, 2006.
[18] Kim H. C., Kim D., Ghahramani Z. and Bang S. Y., “Appearance-based gender classification with Gaussian processes”, Pattern Recognition Letters, Vol. 27, No. 6, pp. 618–626, 2006.
[19] Sun N., Zheng W., Sun C., Zou C. and Zhao L., “Gender classification based on boosting local binary pattern”, In Proc. 3rd. Int. Symp. Neural Networks, pp. 194–201, China, 2006.
[20] Yoo J., Hwang D. and Nixon M., “Gender classification in human gait using support vector machine”, In Proc. 8th Int. Conf. Advanced Concepts for Intelligent Vision Systems, pp. 138-145. Antwerp, Belgium, 2006.
[21] Graf A. B. A., Wichmann F. A., Ulthoff H. H. B. and Schölkopf B., “Classification of faces in man and machine”, Neural Computation, Vol. 18, No. 1, pp. 143–165, 2006.
[22] Hempel T., “Usability of a telephone-based speech dialogue system as experienced by user groups of different age and background”, In Proc. 2nd. ISCA/DEGA Tutorial & Research Workshop on Perceptual Quality of Systems, Berlin, Germany, 2006.
[23] Ajmera J., “Effect of age and gender on LP smoothed spectral envelope”, In Proc. IEEE Conf. Speaker Odyssey, Orlando, FL, 2006. [24] Schöz S., “Automatic prediction of speaker age
using CART”, In Svantesson, J.-O., editor, Working Papers 51, pp. 155–168. Dept. of Linguistics and Phonetics, Lund University. [25] Nakano M., Yasukata F. and Fukumi M., “Age
classification from face images focusing on edge information”, Knowledge-Based Intelligent Information and Engineering Systems, Vol. 3213, pp. 898–904, 2004.
[26] Shafran I., Riley M. and Mohri M., “Voice signatures”, In Proc. IEEE ASRU 2003, U.S. Virgin Islands, 2003.
[27] Minematsu N., Sekiguchi M. and Hirose K., “Automatic estimation of ones age with his/ her speech based upon acoustic modeling techniques of speakers”, In Proc. Int. IEEE Conf. Acoustics, Speech, and Signal Processing (ICASSP-2002), Orlando, FL, 2002.
[28] Minematsu N., Sekiguchi M. and Hirose K., “Automatic estimation of perceptual age using speaker modeling techniques”, In Proc. Eurospeech 2003, Geneva, Switzerland, 2003. [29] Kwon Y. H. and Lobo N. D. V., “Age
classification from facial images”, Computer Vision and Image Understanding, Vol. 74, No. 1, pp. 1–21, 1999.
[30] Horng W. B., Lee C. P. and Chen C. W., “Classification of age groups based on facial features”, Computer Vision and Image Understanding (CVIU), Vol. 4, No. 3, pp. 183– 192, 2001.
[31] Ueki K., Hayashida T. and Kobayashi T., “Subspace-based age-group classification using facial images under various lighting conditions”,
In Proc. IEEE 7th. Int. Conf. Automatic Face and Gesture Recognition (FGR06), pp. 43–48. Southampton, UK., 2006.
[32] Muller C., “Automatic recognition of speakers age and gender on the basis of empirical studies”,
In Proc. 9th. Int. Conf. Spoken Language Processing (Interspeech 2006– ICSLP), Pittsburg, PA, 2006.
[33] Muller C., “Estimating the acoustic context to improve speaker classification”, In Proc. 5th. Int. Conf. Modeling and Using Context (CONTEXT-05), Paris, France, 2005.
[34] Muller C. and Feld M., “Towards a multilingual approach on speaker classification”, In Proc. 11th. Int. Conf. Speech and Computer (SPECOM 2006), pp. 120–124. St. Petersburg, Russia, 2006. [35] A new database for speaker recognition, technical
university of denmark, 2005.
[36] Fukunaga K. and Narendra P. M., “A branch and bound algorithm for computing K-nearest neighbors”, IEEE Trans. Computers, Vol. 24, pp. 750–753, 1975.
[37] Pudil P., Novovicova J. and Kittler J., “Floating search methods in feature selection”, Pattern Recognition Letters, Vol. 15, No. 11, pp. 1119– 1125, Nov. 1994.
[38] Specht D. F., “Probabilistic neural networks”,
Neural Networks, Vol. 3, pp. 109–118, 1990. [39] Vapnik V. N., The Nature of Statistical Learning
Theory, Springer, N.Y., 1995.
[40] Vapnik V. N., Statistical Learning Theory, Wiley, N.Y., 1998.
[41] Fix E. and Hodges J., “Discriminatory analysis, nonparametric discrimination, consistency properties”, In B. Dasarathy, editor, Nearest Neighbor Pattern Classification Techniques, pp. 32–39, IEEE Computer Society Press, Los Alamitos, CA, 1991.
[42] Fix E. and Hodges J., “Discriminatory analysis: small sample performance”, In B. Dasarathy, editor, Nearest Neighbor Pattern Classification Techniques, pp. 40–56. IEEE Computer Society Press, Los Alamitos, CA, 1991.
[43] Stephen S. and Paliwal K. K., “Scalable distributed speech recognition using gaussian mixture modelbased block quantization”, Speech Communication, Vol. 48, No. 6, pp. 746–758, 2006.
[44] Reynolds D. and Rose R., “Robust text-independent speaker identification using Gaussian mixture speaker models”, IEEE Trans. Speech & Audio Processing, Vol. 3, No. 1, pp. 72–83, 1995. [45] Rabiner L. R., “A tutorial on hidden Markov models and selected applications in speech recognition”, Proceedings of the IEEE, Vol. 77, No. 2, pp. 257–286, 1989.
[46] Ververidis D. and Kotropoulos C., “Fast sequential floating forward selection applied to emotional speech features estimated on DES and SUSAS data collections”, In Proc. 14th. European Signal Processing Conf, Florence, Italy, Sep. 4-8 2006.
[47] Efron B. and Tibshirani R. E., An Introduction to the Bootstrap, Chapman & Hall/CRC, N.Y., 1993.
[48] Gordan M., Kotropoulos C. and Pitas I., “A support vector machine-based dynamic network for visual speech recognition applications”,
EURASIP Journal on Applied Signal Processing, Vol. 2002, No. 11, pp. 1248–1259, 2002.
[49] Van der Heijden F., Duin R. P. W., de Ridder D. and Tax D. M. J., Classification, Parameter Estimation, and State Estimation: An Engineering
Approach using MATLAB, J. Wiley & Sons, London, UK., 2004.
Mohammad Hossein Sedaaghi received his B.Sc. and M.Sc. degrees from Sharif University of Technology in 1986 and 1987 and Ph.D. degree from Liverpool University in 1998, all in Electrical Engineering. He has been on the Faculty of Electrical Engineering at Sahand University of Technology, Iran since 1991, where he is currently an associate Professor. His research has focused mainly on nonlinear filtering, signal/image processing and pattern recognition.