PHY-MAC Cross-Layer Cooperative Protocol Supporting
Physical-Layer Network Coding
Quang-Trung Hoang*, Xuan Nam Tran
Le Quy Don Technical University, Hanoi, Viet Nam
Abstract
Cooperative communication has known as an effective solution to deal with the channel fading as well as to improve the network performances. Further, by combining the cooperative relaying technique with the physical-layer network coding (PNC), cooperative networks will obtain more benefits to improve the throughput and network resource utilization. In order to leverage these benefits, in this paper, we propose a PHY-MAC cross-layer cooperative protocol which can support PNC for multi-rate cooperative wireless networks with bidirectional traffic. The design objective of the proposed protocol is to increase the transmission reliability, throughput, and energy efficiency, as well as to reduce the transmission delay. Simulation results show that the proposed protocol outperforms the previous cooperative protocol as well as the traditional protocol in terms of network performance.
c
2015 Published by VNU Journal of Sciences.
Manuscript communication: received 01 June 2015, revised 20 June 2015, accepted 25 June 2015 Correspondence: Xuan Nam Tran, [email protected]
Keywords: Cross-Layer MAC, Cooperative MAC, Physical-Layer Network Coding, Alamouti-DSTBC.
1. Introduction
Nowadays, the increase in the number of people using mobile devices has leveraged the development of wireless networks. With the increased requirements in the quality of service for various applications, technical solutions need to be developed to improve the network performance such as the channel capacity, end-to-end throughput, transmission reliability, energy efficiency, and the network coverage. Cooperative transmission has been known as an effective method to exploit spatial diversity to enhance the quality of wireless channels at the physical layer. In the cooperative transmission multiple single-antenna devices can collaborate with one another to share their antennas with neighbouring partners in order to form a virtual multiple-input multiple-output (MIMO) system.
Recent development of data communication applications has shown that the traffic in
wireless networks is no longer unidirectional but mostly bidirectional. A typical example of bidirectional traffic is the peer-to-peer application such as voice and video communications. A challenging problem for the bidirectional traffic is how to design the data exchange protocol efficiently. In order to deal with this problem, cooperative relaying has been known as a promising technique in the wireless ad hoc networks [1]. In the more recent researches, cooperative relaying has also been proposed to combine with network coding (CC) to achieve more performance benefits, in particular, with the bidirectional traffic [2]–[5].
received simultaneously from the two end nodes [7]. Compared with CNC, PNC has advantage in reducing the number of transmission phases and thus helps to increase the end-to-end throughput as well as to reduce the delay [8]–[10].
Most of recent researches on the bidirectional communication simply focused on combining PNC and the cooperative relaying [10]–[14]. In [10] Shiqiang et al. have proved that the PNC-based medium access control (MAC) protocol, namely PNC-MAC, has more advantages than the CNC-based MAC one in terms of the end-to-end throughput and delay. However, the drawback of this protocol is that it does not have a proper mechanism for reducing problems of hidden nodes in the network. Compared with the PNC-MAC protocol, the ANC-ARA protocol proposed in [14] has difference in that it does not need to know the queue status information of the neighboring nodes. Instead, it uses a special mechanism to avoid the problem of hidden nodes. The proposed cross-layer protocol in [15] uses PNC to support the bidirectional traffic efficiently. Compared with the protocols in [10] and [14], this protocol considers the protocol overheads as well as the contending time duration among optimal relay nodes in the design to increase the network performance. However, this PNC supported protocol still faces a problem of collisions during optimal relay selection. Clearly, a collision avoidance solution will help to increase further network performance in terms of end-to-end throughput or delay.
Motivated by the above problem, in this paper we propose an improved cross-layer cooperative MAC protocol which can support PNC and avoid the problem of collisions happened during the optimal relay selection process. The proposed protocol is designed to work in three modes: directional transmission, cooperative transmission for the unidirectional traffic, and cooperative relaying based on PNC for the bidirectional traffic. However, in this paper we will focus mainly on the last one. Compared with the protocols in [10]–[15], our proposed protocol has the following advantages:
• The physical-layer design of the protocol can be adapted to various cooperative diversity schemes depending on the channel conditions. In our protocol, more than one optimal relay node can be selected and partitioned in one or two relaying groups. Thanks to this arrangement, the process of cooperative relaying node selection can be implemented easily. Especially, in case there are two cooperative relaying groups, we can use the spatial diversity scheme based on the Alamouti distributed spatial-time block code (DSTBC) [16] to improve the transmission reliability.
• By letting the optimal relays in the same priority group send a signaling pulse of the same format the relay contending collision is avoided. As a result, the relay-contending time duration is reduced and the system throughput is thus improved.
• The MAC layer of the proposed protocol is designed to support two main functions: (i) adaptive relay selection mechanism supporting the bidirectional traffic; (ii) PNC is initiated by the cooperative relay nodes only if the bidirectional traffic is occurred. By this design, the proposed protocol can adapt itself flexibly to network environment variations to increase the end-to-end bidirectional throughput.
Our main contributions can be summarized as follows:
• A cooperative diversity transmission model based on optimal relay groups with the improved transmission reliability is proposed for cooperative wireless networks.
• The MAC layer protocol supporting PNC with the improved overall performance of network is introduced for multi-rate cooperative wireless networks.
The remainder of the paper is organized as follows. Sect. 2 presents the network model under consideration. Sect. 3 describes the proposed protocol. The performance analysis of the proposed protocol is presented in Sect. 4. Simulation results are shown in Sect. 5. Finally, conclusions are drawn in Sect. 6.
2. System model
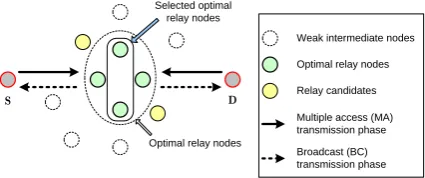
We consider a cooperative wireless network as illustrated in Fig. 1. The network consists of a source (S), a destination (D) placed apart at a distance of d, and a set ofN intermediate nodes which are distributed randomly between S and D. All network nodes are equipped with only one single antenna and have limited transmitting power. The two end nodes are assumed to exchange data with each other in the bidirectional mode using the basic rate of R0 = 2Mbps. Channels between each pair of nodes are assumed independent and affected by flat slow Rayleigh fading plus log-normal shadowing.
S D
Optimal relay nodes
Weak intermediate nodes Optimal relay nodes Relay candidates Multiple access (MA) transmission phase Broadcast (BC) transmission phase Selected optimal
relay nodes
Fig. 1. Network model of the cooperative wireless network.
It is further assumed that among N
intermediate nodes, only those capable nodes, referred to as relay candidates, will participate in the relay selection process. Those intermediate nodes with weak channel gain to S and D, referred to as weak intermediate nodes, will not participate into the relaying process. The optimal relay nodes are those relay candidates which have the same maximal cooperative rate. Moreover, the selected optimal relay nodes are the optimal relay nodes which are selected after the contention period. As shown in Fig. 1, several intermediate nodes can be selected as the optimal relays and the selected optimal relays.
3. Proposed PNC-supported PHY-MAC cross-layer cooperative protocol
3.1. Operations at the PHY layer
Assume that the PHY layer can support L
different data ratesr1,r2, ..,rL (for example,L =
8 in the IEEE 802.11a standard). Each network node uses a certain data rate if its estimated SNR is above a corresponding thresholdγl, γl ∈(γ1 <
γ2 < · · · < γL). Similar to the analysis of the
cross-layer PHY-MAC protocol for unidirectional traffic in [17], we define the MAC cooperation region (CR) as a set of triple rates, C := (R1,RC1,RC2) ⊆ R3, such that the bidirectional
effective payload transmission rate (EPTR) in relaying transmission is always larger than that in direct transmission. HereR1,RC1,RC2denotes the
direct rate, the first hop rate, and the second hop rate, relatively. In generally, the EPTR is given by LP
TO+TP, with LP,TO,TP being the payload length, the overhead time duration, and the payload time duration respectively. Hence, the condition for a relay to belong to the cooperation region is that the transmission delay for the cooperative bidirectional traffic is always less than that without cooperative relaying.
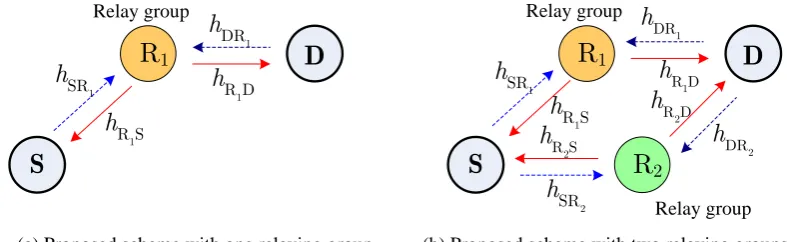
In order to improve the transmission reliability, we propose two cooperative relaying schemes which support bidirectional traffic. These schemes are shown in Fig. 2. In our proposed schemes, depending on the channel conditions each relaying group R1 and R2 can have one or
more optimal relays selected by the MAC layer protocol.
3.1.1. Transmission based on one relaying group
In this case, the transmission scheme is illustrated in Fig. 2-a. In the scheme, bidirectional data exchange between S and D is performed over the multiple access (MA) phase and the broadcast (BC) phase. In the MA phase, the two end nodes S and D transmit simultaneously to R1. The
signal received simultaneously at thei-th relay in the relaying group R1is given by
yRi
1 =hSR
i
1xS+hDR
i
1xD+zR
i
S
D
R
1R
2S
D
R
1 Relay group 1 DRh
1 SRh
2 SRh
1 DRh
1 SRh
(a) Proposed scheme with one relaying group
Relay group Relay group 1 R S
h
1 R Dh
1 R Sh
1 R Dh
2 DRh
2 R Dh
2 R Sh
(b) Proposed scheme with two relaying groups
Fig. 2. Cooperative relaying model supporting bidirectional traffic.
wherexSandxDare the transmitted signals from
S and D, respectively. hSRi
1 and hDR
i
1 are the
fading coefficients of the channels from S and from D to the i-th relay of R1, respectively; zRi
1
is noise at thei-th relay of R1.
In the BC phase, the signals received at S and D are given respectively as follows:
yS=
NR1
X
i=1
hRi
1SCPNC
yRi
1
+zi, (2)
yD= NR1
X
i=1
hRi
1DCPNC
yRi
1
+zi, (3)
whereNR1 is the number of relays of R1;CPNC(·)
is a function of PNC. In this paper, we use the decoding and forwarding (DF) scheme at the relays and the PNC mapping function as in [7].
3.1.2. Transmission based on two relaying groups
The transmission for transmission scheme is drawn as Fig. 2-b. Assume that R1and R2consist
ofNR1 andNR2 optimal relays, whereNR1,NR2 ≥ 1. In order to improve the transmission reliability of this scheme, we apply the Alamouti DSTBC scheme [16] to our considered transmission scheme. Similar to the case of one relaying group, the bidirectional data exchange between S and D also takes place over two phases (MA and BC). However, each phase uses two time slots for transmission. In two consecutive time slots of the MA phase, S and D send simultaneously their data vectors: xS = [x1S,x2S] and xD = [x1D,x2D], respectively to relays. The signals received at the
i-th relay of R1in two consecutive time slots are
respectively given by
y1
Ri1 =hSRi1x
1
S+hDRi1x 1
D+z
1
i, (4)
y2
Ri1 =hSRi1x
2 S+hDRi
1x
2
D+z2i, (5)
where, hSRi
1 and hDRi1 are the Rayleigh fading
coefficients of the link from S and D to the i -th relay of R1, respectively. z1i,z2i are the noise
occurred in each time-slot, respectively.
Similarly, the signals received at the j-th relay of R2 during two consecutive time-slots of the
MA phase are denoted by
y1
R2j =hSR2jx 1
S+hDR2jx 1
D+z1j, (6)
y2
R2j =hSR2jx 2
S+hDR2jx 2
D+z2j. (7)
In the BC phase, the selected optimal relays broadcast their PNC encoded signals to both S and D. Since the Alamouti DSTBC scheme is used, the signals received at S during two consecutive time slots are given by
y1S=HS1CPNC
y1
Ri1
+HS2CPNC
y2
R2j
+z1S, (8)
y2S=HS1h−CPNCy2
Ri
1
i∗
+H2ShCPNCy1
R2j
i∗
+z2S,
(9)
where
HS1= NR1
X
i=1
hRi
1S and H
2
S=
NR2
X
j=1
hRj
2S ,
source in each time slot, respectively. We also assume that the links between any two nodes in the network are reversible such that hRi
1S = hSRi
1,hR2jS= hSRj
2
.
Similar to the source, the signals received at the destination during two consecutive time slots of the BC phase are given by
y1D=HD1CPNC
y1
Ri1
+HD2CPNC
y2
R2j
+z1D, (10)
y2D=HD1h−CPNCy2
Ri1
i∗
+HD2hCPNCy1
R2j
i∗
+z2D,
(11)
where
HD1 = NR1
X
i=1
hRi
1D and H
2
D=
NR2
X
j=1
hRj
2D
, (12)
z1D,z2D are the noise at each time slot, respectively. Here, we also assume that
hRi
1D = hDR
i
1,hR
j
2D = hDRj
2. Hence, based on the
estimated channel status information (CSI), the source and destination can estimate the signals received from the optimal relays in two groups R1 and R2, then decodexS andxD based on the
XOR operation.
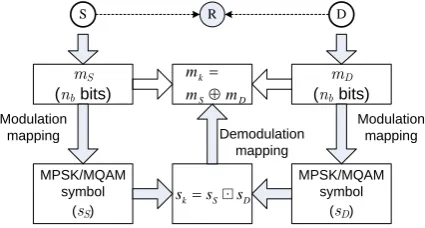
3.1.3. PNC for multirate adaptive modulation
In order to work in the multirate
communication mode, network nodes need to use adaptive modulation. As a result, the PNC scheme needs to be realized appropriately for several modulation types. In this paper, we adopt the PNC modulation–demodulation mapping principle proposed in [7] for the adaptive modulation with set of transmission
S R D
mD
(nbbits)
mS
(nbbits)
MPSK/MQAM symbol
(sD) MPSK/MQAM
symbol (sS)
Modulation mapping Modulation
mapping Demodulation
mapping
k D S
m
m m
k S D
s s s
Fig. 3. The PNC mapping principle.
rates according to the IEEE 802.11a standard [18]. The process of PNC mapping is illustrated in Fig. 3. In the figure, ⊕ denotes the general binary operation for network-coding arithmetic. That is, applying ⊕ on mi, mj ∈ Mb gives mi⊕mj=mk ∈Mb;Mbis a set of potential binary
code-words depending on each modulation type. Assuming that the Ms-ary modulation is used, then Ms is a set of the potential modulation
symbols. Let be the binary combination
operation, then combination of sS, sD ∈ Ms
yields sS sD = sk ∈ M
0
s, where M
0
s is the
domain after the binary operation; each sk ∈ M
0
s
received by the relay node must be mapped to a demodulated symbolmk ∈Mb.
3.2. Operation at the MAC layer
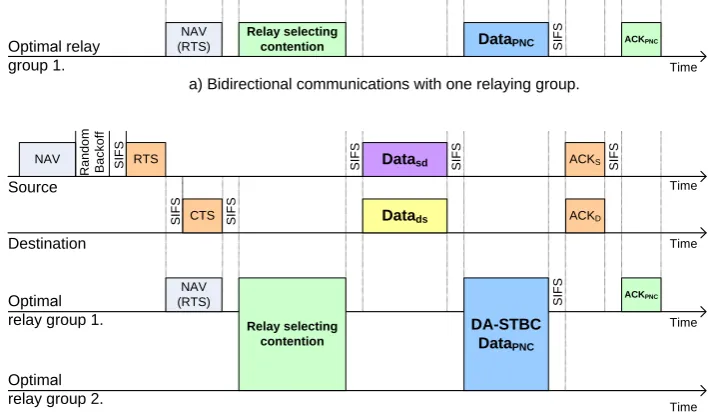
The main goal of designing the MAC layer of the proposed protocol is to minimize the overhead time and the bidirectional payload transmission time while supporting the adaptive relay selection. The operation of the proposed MAC layer scheme is illustrated in Fig. 4.
The operation of the proposed MAC layer is described as follows
• Source Initiation: After a back-offinterval,
the source establishes the link to the destination node using the request-to-send (RTS) and clear-to-send (CTS) exchange handshake. In order to start, the source broadcasts the RTS frame to both the destination and intermediate nodes.
• Destination Response: If the destination
receives the RTS frame correctly, it broadcasts the CTS frame to both the source and intermediate nodes after a SIFS (Short Inter-Frame Spacing) interval. In the case the destination also has its own data to send to the source, the information of the payload length Ldsis included into the CTS frames, if not the lengthLdsis set to null.
• Intermediate Node Processing: When the
NAV RTS
CTS
SI
F
S
Ra
nd
o
m
Bac
koff
SI
F
S
SI
F
S
NAV (RTS)
Relay selecting contention
Source
Destination
Optimal relay group 1.
Datasd
ACKD
Datads
DataPNC
SI
F
S
SI
F
S
SI
FS
Time
Time
Time
ACKPNC
SI
F
S
ACKS
NAV RTS
CTS
SI
FS
R
and
om
Ba
c
k
o
ff
SI
F
S
SI
F
S
NAV (RTS)
Relay selecting contention
Source
Destination
Optimal relay group 1.
Datasd
ACKD
Datads
DA-STBC DataPNC
SIF
S
SIF
S
SIF
S
Time
Time
Time
ACKPNC
SIF
S
ACKS
Optimal
relay group 2. Time
a) Bidirectional communications with one relaying group.
b) Bidirectional communications with two relaying groups.
Fig. 4. The operation of the proposed MAC-layer protocol.
to determine its cooperative rate allocation in the cooperation region CR. If the intermediate node satisfies the condition of CR, it participates in the process of the optimal relay selecting contention.
• Relay Transmission: If a relay node is
selected for the process of bidirectional cooperative communication, it uses transmission operations as in Fig. 2-a or Fig. 2-b. In contrast, it releases the relay contending process, and holds the waiting status.
• Destination Acknowledgement: After
the source and destination have correctly received the data, they simultaneously send their ACKS and ACKD frames to the
optimal relays after a SIFS interval. These relays then broadcast the ACKPNC frame to
both the source and destination.
3.3. Optimal relay selection
As mentioned in Section 3.1, in order to select the optimal relay using the distributed method, the optimal grouping algorithm works as follows. Given the direct transmission rate R1, there exist
M potential cooperative rates Rh. A set of these cooperative rates are partitioned into G
different priority groups, each consists ofngrelay members, where each member can be assigned to a different m priority level according to its identified data rate, so M = PG
g=1ng. Each relay
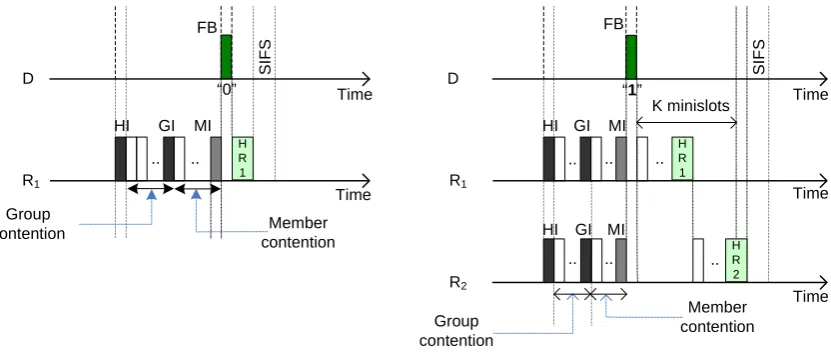
candidate can determine its priority allocation in CR according to the g-th group-priority index and the m-th member-priority index. Based on these parameters, the MAC-layer protocol selects the optimal relay node through control and/or signaling messages. The process of optimal relay selecting contention is shown in Fig. 5 and is described as follows:
H R 1
SIFS
D
R1
HI GI MI
.. ..
Member contention Group
contention
“0” FB
H R 1 D
R1
SIFS
HI GI MI
HI
.. .. ..
Member contention Group
contention
..
H R 2 ..
GI MI
“1”
.. K minislots FB
R2
(a) One optimal relay group selected. (b) Two optimal relay groups selected.
Time
Time
Time
Time
Time
Fig. 5. Relay selection operation.
helper1 indication (HI) signal to inform the source and destination its capability. If not it holds the silent status.
• Step 2: After the HI signal is sent, the relay candidate counts time down, starting from the g-th time-slot to 1, it then broadcasts the group indication (GI) signal to inform its group-priority allocation if overhears no GI signal.
• Step 3: Immediately after sending the GI signal, the relay candidate continues to count time down starting from them-th time-slot to 1, it then broadcasts the helper member (MI) signal to inform its member-priority allocation if no MI signal was overheard. The relay candidates successfully sent the MI signal are called the optimal relays. After the MI signal is sent, the optimal relays wait for the feedback (FB) signal from the destination to determine the number of optimal relays occurred in the network. Without loss of generality, we assume that there exist n optimal relays and in order to estimatenwe use the same method as in (25) of [5].
1Note that in order to keep it consistent with the previous reference, we still use the term “helper” where necessary but its meaning is equivalent to “relay”.
• Step 4: The optimal relay compares the FB signal received with the “000 and “100 logic levels:
In case FB =“0” (meaning that there exists only one optimal relay), it immediately broadcasts a help response pulse HR1 to
indicate the willingness to participate in the cooperative relaying process.
In case FB = “1” (meaning that there exist more than one optimal relay), it randomly selects the k-th time-slot in K mini-slots to send the HR1 signal if it overhears no HR1
signal and remembers its allocation in the relaying group R1, or it sends the HR2signal
if it overhears the HR1 signal but no HR2
signal and remembers its allocation in the relaying group R2.
The optimal relays successfully sent the HR1 or HR2 signal are the optimal
relays selected for cooperative relaying data frames. Immediately after the HR2 signal
is sent, remaining optimal relays release the random contending process.
4. Performance analysis
4.1. Transmission latency
Concentrating on the bidirectional
communication mode, we estimate the time duration for two data packets of two end nodes (the source and the destination) exchanged under the proposed protocol. The overall time for bidirectional transmissions, starting at the initial time of the source until both the source and destination nodes receiving their expected data frames correctly, is determined by
E[Ttotal]=E[Td]+E[TCoop], (13)
where, E[Td] is the average time duration for direct transmissions when there exists no cooperative relay; E[TCoop] is the average time duration for bidirectional cooperative transmissions. Because E[Td] can be calculated easily depending on the network configuration, in this paper we concentrate on deriving the
E[TCoop] formula.
To estimate E[TCoop], we assume that there
exists at least one optimal relay node participating in the bidirectional cooperative relaying process. Firstly, we know that the frame transmission time depends on the frame error probability, which in turn relates to the bit error probability (BEP). Therefore, we denote Pe,sd the BEP
on the channel between the source and the destination, and Pf e1,Pf e2,Pf e3,Pf e4 the event
probabilities that the error occurs in the frames RTS, CTS,DATA and ACK, respectively. These probabilities are given as follows
Pf e1 =1−(1−Pe,sd)LRTS, (14)
Pf e2 =(1−Pe,sd)
LRTS(1−(1−Pe
,sd)LCTS), (15)
Pf e3 =(1−Pe,sd)LRTS+LCTSPDATA, (16)
Pf e4 =(1−Pe,sd)
LRTS+LCTS(1−
PDATA)PACK,
(17)
where LRTS and LCTS is the length of the
frames RTS,CTS respectively; PDATA,PACK are the average transmission error probabilities of the frames DATA and ACK.
Let P(DATA,E2E) be the end-to-end BEP at the
end nodes (the source and the destination). Then, we obtain
PDATA=1−
1−P(DATA, E2E)
2LDATA ,
with LDATA denoting the data frame length sent
by the source and the destination.
Because the transmission scheme of the frames ACK and DATA is the same, we also can obtain the transmission error probability of the frame ACK asPACK=1−1−P(ACK,E2E)
2LACK
, where
LACK is the ACK length sent by the source and
the destination, and P(ACK,E2E) is the end-to-end
average BEP that a bit in the ACK frame is not received correctly at the end nodes.
Hence, the transmission error probability in the case of the bidirectional cooperative relaying is
Pce = P4
i=1Pf ei, and the successful transmission probability for the case of the bidirectional cooperative relaying is Pcs = (1−Pce). The time duration for the above probability events is given by
Tf e1 =TRTS+TCTS+2TSIFS+2tprop, (18)
Tf e2 =TRTS+TCTS+2TSIFS+2tprop, (19)
Tf e3 =Tf e2+Tcont+TDATA+TACK, (20)
Tf e4 =Tf e3, (21)
where a frame is considered successfully transmitted only when it and all its previous frames were also successfully transmitted.
TRTS, TCTS, and tprop is the time duration of
the frames RTS,CTS and the propagation time, respectively. TDATA,TACK are the time duration for the bidirectional data transmission and the bidirectional transmission of frames ACK;TSIFS
is the SIFS time duration; Tcont is the time duration for the relay selecting contention, and is calculated by
Tcont=THI+(g−1)tslot+TGI
+(m−1)tslot+TMI+TFB+E[T(n,k)], (22)
E[T(n,k)] denotes the average time duration for the random contending process to send the signals HR1and HR2, and is calculated as follows
E[T(n,k)]=
THR1 +TSIFS, ifn=1; P1PKk=1
h
(k−1)tslot+THR1 +(K−k)tslot+TSIFS
i
+P2PkK=−11
PK v=k+1
h
(k−1)tslot+THR1
+(v−k−1)tslot+THR2 +TSIFSi, ifn≥2 (23)
where P1 is the probability that all n optimal
relays select the same k-th time slot in K mini-slots, andP2is the probability that more than one of n the optimal relays select two different k-th time-slots in K mini-slots. Given K andn ≥ 2, these probabilities are determined byP1 = K1n, and soP2=1−P1.
Through the above analysis, the average time duration for retransmission in the case of the bidirectional cooperative relaying is obtained as follows
E[Tec]=
4
X
i=1
Pf eiTf ei. (24)
Therefore, the overall average time duration is determined by
E[TCoop]=PcsE[TP]+E[TO]
+E[Tec], (25)
where E[TP] is the bidirectional payload
transmission time, E[TP] = E
2W
min(RC1,RC2)
, and
RC1 andRC2 are the transmission rates from the source and destination to the optimal relaying groups, respectively. E[TO] is the overhead time, E[TO] = Th + Tcont+ 2TDO + 2TSIFS + TACK.
Here Th is the time duration for the
handshake process, and is determined by
Th=TRTS+TCTS+2TSIFS+2tprop;TDOis the data
overhead time. TACKis the time duration for the
frames ACK, andTACK= 2LACK
Ro +2TSIFS+2tprop.
4.2. The throughput formula
The cooperative throughput of the system can be defined as the average payload account transmitted successfully at the bidirectional
relaying mode per the overall time, and is calculated as follows
QCoop=
E[Payload]
E[TCoop]
= Pcs(2W)
Pcs
E[TP]+E[TO]+E[Tec]
, (26)
whereWis the payload length of the end nodes (the source and the destination). In this paper, to simplify the analysis we assume that both the source and the destination have the same payload length.
4.3. Analytical model for energy efficiency
The average consumed energy for the
bidirectional communication is determined by the average consumed energy for the successful cooperative relaying E[εs] plus the
average consumed energy for the number of re-transmissionE[εr]:
E[εCoop]=E[εs]+E[εr]. (27)
In order to clarify the above equation, we try to compute each term analytically. We consider three different modes: (i) the transmission mode: when the node is transmitting data/control packets; (ii) reception mode: when the node is receiving data/control packets; (iii) idle mode: when the node is sensing the medium without performing any action. The power levels associated to each mode are PT,PR,PI,
respectively. Furthermore, the relationship between energy and power is given byε = P·t, where the terms ε,P,t represent the energy, the power and the time, respectively.
With the network model under consideration presented in Section 2, the average energy consumption for the successful transmission is determined as follows
E[εs]= E[εh]+E[εcont]+E[εD]+E[εACK],
(28)
where the energy E[εh] consumed for the
handshake process is:
E[εh]=[PT +(N+1)PR]TRTS+(N+2)PITSIFS +[PT+(N+1)PR]TCTS+(N+2)PITSIFS.
E[εcont]
=
McPT+2PR+(N−Mc+2)PITHI+(N+2)PI(g−1)tslot+
ngPT+(Mc−ng+2)PR+(N−Mc)PITGI
+(N+2)PI(m−1)tslot+
nPT +(ng−n+2)PR+(N−ng)PITMI+
PT +(n+1)PR+(N−n)PITFB
+F(n=1)
PT+2PR+(N−1)PITHR1+(N+2)PITSIFS
+F(n≥2)
P1
K
X
k=1
h
(N+2)PI(k−1)tslot
+
NR1PT +2PR+(N−NR1)PI
THR1+(N+2)PI
(K−k)tslot+TSIFS
i
+P2
K−1
X
k=1
K
X
v=k+1
h
(N+2)PI(k−1)tslot+
NR1PT+(n−NR1 +2)PR+(N−n)PITHR1
+(N+2)PI(v−k−1)tslot+
NR2PT +(n−NR2+2)PR+(N−n)PITHR2+(N+2)PITSIFS
i
,
(30)
E[εcont] consumed for the process of the
optimal relay contention is calculated by (30). Note that Mc is a set of cooperative relay
candidates. F(n=1) and F(n≥2) are the logic
functions, which return value 1 if the condition ofnis satisfied, otherwise 0, NR1 andNR2 is the
number of optimal relay members belonging to the group R1and R2, respectively.
The energy consumption of the data
transmission process is calculated as:
E[εD]=
h
2PT+(NR1 +NR2)PR
+(N−NR1−NR2)PI
i
TDATA
+(N+2)PITSIFS+
h
(NR1 +NR2)PT+2PR
+(N−NR1−NR2)PIiTDATA+(N+2)PITSIFS.
(31)
The ACK frame transmission process
consumes the energy
E[εACK]=
h
2PT+(NR1 +NR2)PR
+(N−NR1 −NR2)PI
i
TACK
+(N+2)PITSIFS+
h
(NR1 +NR2)PT +2PR
+(N−NR1 −NR2)PIiTACK+(N+2)PITSIFS.
(32)
In order to estimate the energy consumption for the retransmissionE[εr], the analysis is based
on the event probabilities occurred in equation (14)–(17), and the time duration in equation (18)– (21). LetE1,E2,E3andE4be the average energy consumption according to the frame error events. We can calculate these terms as follows
E1=[PT+(N+1)PR]TRTS +(N+2)PI(TSIFS+TCTS);
E2=[PT+(N+1)PR]TRTS+(N+2)PITSIFS +[PT +(N+1)PR]TCTS+(N+2)PITSIFS;
E3= Eh+E[εcont]+E[εD]+(N+2)PITACK;
E4= Eh+E[εcont]+E[εD]+E[εACK].
(33)
Hence,E[εr] is determined by:
E[εr]=
4
X
i=1
Pf eiEi. (34)
The energy efficiency, measured in [bits/Joule], can be defined as the amount of delivered useful data per energy unit. Considering the proposed protocol operation, the energy efficiencyηfor the bidirectional communication mode can be written as follows
E[η]= E[Payload]
E[εCoop] =
Pcs(2W)
E[εs]+E[εr]
5. Simulation results
In order to evaluate the performance of the proposed protocol, we implement the Monte Carlo simulation for some scenarios. Further, all simulations are set up for the bidirectional traffic.
5.1. BER performance
In order to obtain the BER performance the two schemes in Fig. 2-a and Fig. 2-b are employed for simulation. In these schemes R1 consists of
NR1 optimal relay nodes, and R2 consists of NR2
optimal relay nodes. The link between each node pair are assumed to be independent and affected by slowly varying flat Rayleigh fading. Noise power is set to unity, i.e., N0 = 1. In case of the scheme in Fig. 2-a, we set the power of the source Ps, the destination Pd, and the relay Pr
equal, i.e. Ps = Pd = Pr = P. In case of the
scheme in Fig. 2-b, Ps = Pd = PandPr = P/2. BER performance is evaluated versus P/N0. For
simplicity, we use the BPSK modulation for all the schemes. Simulation results are shown in Fig. 6.
0 5 10 15 20 25 30
10−4
10−3
10−2
10−1
100
P/N0 [dB]
BER
COMPARISON OF PNC BASED TWO−WAY TRANSMISSIONS
14 15 16
10−2
One single relay One three−relay group
A−DSTBC w. 2 relays
A−DSTBC w. 2 groups (2x1 relay)
A−DSTBC w. 2 groups (3x1 relay)
A−DSTBC w. 2 groups (2x2 relay)
A−DSTBC w. 2 groups (3x2 relay)
Fig. 6. BER performance comparison of different schemes.
We can observe clearly from Fig. 6 that the performance of the schemes with two relay groups is better than that with one relay group. It can be explained using the fact that the schemes with two relay groups employ the Alamouti DSTBC with the maximal ratio combining (MRC) reception, so they can achieve more power gain to improve transmission reliability. Furthermore, the performance of the scheme with
one relay group is improved when the number of optimal relay members of the group increases. This is because the destination receives more power from different relaying paths, so the SNR value is increased leading to the reduced BER.
5.2. Throughput and delay evaluation
In order to evaluate the throughput and delay through simulation, we use the system model
in Fig. 1 with N = 40 immediate nodes
between the source and the destination. The links between each node pair are assumed to be independent and affected by slowly varying flat Rayleigh fading with the log-normal shadowing effects, and the path loss with the loss coefficient 3,5. The transmission power is set to 1 W.
The payload length is W = 1500 Bytes.
In addition, the adaptive modulation scheme employs either BPSK, 4-QAM, 16-QAM, or 64-QAM depending on the channel quality. This is equivalent to the instantaneous SNR thresholds of 6, 15, 21, and 27 dB, respectively. In order to evaluate the throughput and delay, it is required that BEP needs to be estimated. This can be done based on the average SNR of the transmission links. With the two-phase data transmission scheme, under the assumption that the CSI is perfectly known, the end-to-end average BEP can be estimated from the average BEP of the first hop transmission (MA phase) and the second hop transmission (BC phase). However, to simplify the simulation, we assume that P(DATA, E2E) is
to 8 transmission rates (6, 9, 12, 18, 24, 36, 48, and 54 Mbps) we choose 8 corresponding SNR thresholds (6, 12, 15, 18, 21, 24, 27, and 30 dB). Depending on the received SNR, the cooperative transmission rates RC1 andRC2 from S and D to each intermediate node take one of the 8 given rates. As the resulted cooperative rates relate with
TP, TO and Tec, the transmission delay can be obtained with the varying network radius via (25), while givenW the cooperative throughputQCoop
can be obtained via (26). Similarly, the energy efficiency can be obtained via εs and εr, which
in turn depend onεDvia (28), (33) and (34), and
thus onTDATA via (31). AsTDATA is decided by
the two given cooperative rates, we can obtain the energy efficiency versus the network radius accordingly.
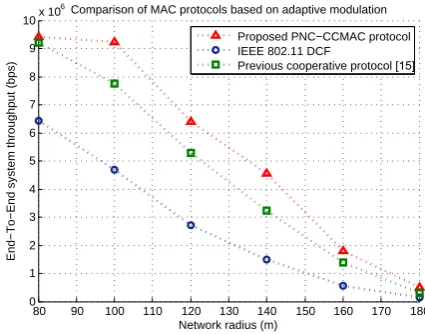
80 90 100 110 120 130 140 150 160 170 180 0
1 2 3 4 5 6 7 8 9 10x 10
6
Network radius (m)
End−To−End system throughput (bps)
Comparison of MAC protocols based on adaptive modulation
Proposed PNC−CCMAC protocol IEEE 802.11 DCF
Previous cooperative protocol [15]
Fig. 7. Throughput performance.
80 90 100 110 120 130 140 150 160 170 180 0
0.01 0.02 0.03 0.04 0.05 0.06
Network radius (m)
End−To−End average latency (s)
Proposed PNC−CCMAC protocol IEEE 802.11 DCF
Previous cooperative protocol [15]
115 120 125
0 2 4 6
x 10−3
Fig. 8. Delay performance.
Simulation results for the throughput and delay performance are shown in Fig. 7 and Fig. 8, respectively. Observing Fig. 7 we can see that the throughput of all three protocols decreases rapidly when the network radius increases. This is because when the network radius increases the distance between network nodes also increases, leading to the drop in channel quality as well as the data transmission rates and thus the end-to-end throughput. To be more detailed, because the term E[TP] in (26) is the inverse function of the data transmission rates as analyzed in 4.1, when these rates decrease the term E[TP]
will increase and the throughput decreases. However, the proposed protocol still achieves the best throughput performance, followed by the previous cooperative MAC protocol [15], and finally, the traditional protocol 802.11 DCF. It is interestingly noted that at the radius range from 80 m to 100 m, the throughput of the proposed scheme decreases more slowly compared to other ones. This can be explained by using the fact that our scheme uses adaptive modulation. Within this certain network radius, the channel quality is good and thus high modulation level is used leading to higher throughput. As the radius increases due to increase in the path loss and transmission error, lower modulation level is required and thus the throughput decreases more rapidly.
Fig. 8 shows that the end-to-end latency of the three above mentioned protocols increases with the network radius. This is because the throughput decreases with the network radius as explained above leading to increase in the transmission time and also the end-to-end latency. However, it can be clearly seen that our proposed protocol exhibits better delay performance than other protocols. This is due to the fact that the proposed protocol uses the short signaling pulses (HR1 and HR2) instead of the
two time slots. This causes E[TO] in equation (25) to be neglected. In addition, by using these signaling pulses, the receiver does not need to decode each bit correctly. As a result, the retransmission timeE[Tec] in equation (25) is also reduced. Therefore, E[TCoop] in equation (25) decreases for the proposed protocol. Moreover, the proposed protocol uses a more effective relay contention mechanism as well as adaptive relay selection leading to significant reduction in the protocol overhead.
5.3. Energy efficient performance
To evaluate the energy efficiency of the proposed protocol we use the same simulation model in Section 5.2. However, the transmission power is now set to PT = 1.000 mW, and the received and idle power is PR = PI = 700 mW. The simulation results are shown in Fig. 9.
80 90 100 110 120 130 140 150 160 170 180 0
0.5 1 1.5 2 2.5 3 3.5 4 4.5x 10
5
Network radius (m)
Energy efficiency (b/J)
Proposed PNC−CCMAC protocol IEEE 802.11 DCF
Fig. 9. Energy efficient performance.
We can see from Fig. 9 that the energy efficiency of the protocols decreases gradually when the network radius increases. This is because BER increases when the network radius increases, leading to the increase in the number of re-transmissions. As a result the operating time of the network nodes is increased or the energy consumption for the re-transmission E[εr] in equation (35) is increased, leading to
the decreased energy efficiency. However, the proposed protocol always achieves better energy efficiency than the IEEE 802.11 DCF over all network radius. Noted interestingly at the
network radius of 100 m that the energy efficiency is even higher than at 80 m. The reason is that the scheme(1,0) occurs more frequently than the others and with this scheme there will be no random contention 2. This means that only one optimal relay is selected to send the HR1 signal
right after the MI signal a TFB interval. The
data transmission phase is then activated and thus energy consumption is reduced for this scheme. As a result, the average consumed energy at the network radius 100 m is reduced, and thus the energy efficiency is higher.
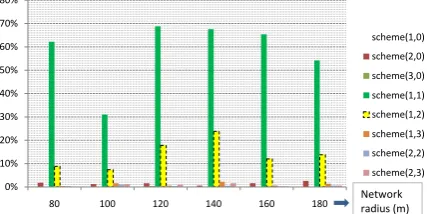
Further, Fig. 10 illustrates the dependence of transmission scheme distribution on the network radius as well as the network configuration. The transmission scheme can be varied upon the channel conditions according to the network radius. Using simulation we can show that the scheme with two separated relays, scheme(1,1), occurs more frequently, followed by the one with one relay, scheme(1,0), and then the one with two relay groups, scheme(1,2). These three schemes can support bidirectional communication with higher power gain while the energy consumption is lower because the number of selected optimal relay members are not many compared with the number optimal relays occurred in the network. The remaining schemes with larger a and/or b
occur at very low density. This observation also confirms the effectiveness of the relay selection method.
scheme(10) 0.268 0.558 0.096 0.036 0.202 0.268
scheme(20) 0.018 0.012 0.016 0.006 0.016 0.026
scheme(30) 0 0 0.004 0 0 0
scheme(11) 0.622 0.31 0.688 0.676 0.654 0.542
scheme(12) 0.088 0.074 0.178 0.238 0.12 0.138
scheme(13) 0.004 0.016 0.006 0.022 0.006 0.014
scheme(22) 0.003 0.011 0.004 0.005 0.002 0.006
scheme(23) 0 0.012 0.01 0.016 0.002 0.006
Network radius (m) 80 100 120 140 160 180
Bảng mô tả tỷ lệ hoạt động của các dạng sơ đồ truyền dẫn.
0% 10% 20% 30% 40% 50% 60% 70% 80%
80 100 120 140 160 180
scheme(1,0) scheme(2,0) scheme(3,0) scheme(1,1) scheme(1,2) scheme(1,3) scheme(2,2) scheme(2,3) Network radius (m)
Fig. 10. Distribution of transmission schemes.
2We use the notation “scheme(a,b)” to denote each type of the transmission schemes presented in Fig. 2, whereais the number of the optimal relays in the relay group R1, and
6. Conclusions
In this paper, we have proposed a PHY-MAC cross-layer cooperative protocol which can support PNC for cooperative wireless networks with bidirectional traffic. The proposed cross-layer protocol considers both the MAC cross-layer and the PHY layer operation. We have shown by simulation that the proposed protocol can work flexibly in realistic channel conditions and achieve better performance than the previous protocol as well as the traditional protocol in terms of the system throughput, end-to-end latency, and the energy efficiency. With the above advantages, the proposed protocol can be employed in various ad hoc cooperative wireless networks.
Appendix A. Derivation ofE[T(n,k)] [B.1]
Based on the relay selection operation in Fig. 5, we can calculate E[T(n,k)] for the following two cases:
Case 1: n=1
Since there is only one optimal relay, it sends HR1 to inform S and D its willingness
to participate in the cooperative transmission process. After an SIFS interval, the data transmission process is initiated. Hence,
E[T(n,k)] is given by
E[T(n,k)]=THR1+TSIFS. (A.1)
Case 2: n≥2
In this case, since more than one optimal relay participate in the random contending process, there are two possibilities: (i) All optimal relays select the samek-th time-slot in theKmini-slots. These optimal relays broadcast the HR1signal at
thek-th time slot. In the remaining (K−k) time slots, the network nodes stay at the waiting state. After an SIFS interval, the data transmission process is initiated. LetP1be the probability that
allnoptimal relays select the samek-th time slot
inKmini-slots. Then,E[T(n,k)] is calculated as
E[T(n,k)]=P1 K
X
k=1
h
(k−1)tslot+THR1
+(K−k)tslot+TSIFS
i
.
(A.2)
(ii) Two optimal relay groups select two different time slotskandν, respectively. The first optimal relay group sends the HR1signal after (k−1) time
slots and the second optimal relay group sends the HR2signal after (ν−k−1) time slots. After
an SIFS interval, the data transmission process is initiated. LetP2be the probability that more than
one of n the optimal relays select two different time slots (the first group selects the k-th time-slot and the second selects the ν-th time-slot) in
Kmini-slots. Then,E[T(n,k)] is calculated as
E[T(n,k)]=P2
K
X
k=1
K
X
ν=k+1
h
(k−1)tslot+THR1
+(ν−k−1)tslot+THR2+TSIFS
i
.
(A.3)
References
[1] S. K. Sarkar, T. G. Basavaraju, C. Puttamadappa, Ad Hoc Mobile Wireless Networks: Principles, Protocols, and Applications, Auerbach Publications, (2008). [2] A. Antonopoulos, C. Verikoukis, C. Skianis, O. B.
Akan, Energy Efficient Network Coding-based MAC for Cooperative ARQ Wireless Networks. Ad Hoc Networks vol. 11, no. 1, pp. 190–200, (2013). [3] A. Antonopoulos, A. Lalos, M. Di Renzo, C.
Verikoukis, Cross-layer Theoretical Analysis of NC-aided Cooperative ARQ Protocols in Correlated Shadowed Environments. IEEE Transactions on Vehicular Technology, vol. PP, no. 99, pp. 1–13, (2014).
[4] D. An, H. Woo, H. Yoon, I. Yeomc, Enhanced Cooperative Communication MAC for Mobile Wireless Networks. Computer Networks, vol. 57, no. 1, pp. 99–116, (2013).
[5] W. Xiaoyan, L. Jie, Network Coding Aware Cooperative MAC Protocol for Wireless Ad Hoc Networks. IEEE Transactions on Parallel and Distributed Systems, vol. 25, no. 1, pp. 167–179, (2014).
[7] S. Zhang, S. C. Liew, and P. P. Lam, Hot topic: physical-layer network coding. Proceedings of the 12th annual international conference on Mobile computing and networking, New York, USA, pp. 358– 365, (2006).
[8] F. Rossetto, M. Zorzi, On the design of practical asynchronous physical layer network coding, IEEE 10th Workshop on Signal Processing Advances in Wireless Communications (SPAWC’09), Perugia, pp.469–473, (2009).
[9] L. Lu, S. C. Liew, S. Zhang, Optimal Decoding Algorithm for Asynchronous Physical-Layer Network Coding. 2011 IEEE International Conference on Communications (ICC), Kyoto, pp. 1–6, (2011). [10] W. Shiqiang, S. Qingyang, W. Xingwei, A.
Jamalipour, Distributed MAC Protocol Supporting Physical-Layer Network Coding. IEEE Transactions on Mobile Computing, vol. 12, no. 5, pp. 1023–1036, (2013).
[11] A. Argyriou, Wireless network coding with improved opportunistic listening. IEEE Transactions on Wireless Communications, vol. 8, no. 4, pp. 2014–2023, (2009). [12] A. Argyriou, A. Pandharipande, Cooperative Protocol for Analog Network Coding in Distributed Wireless Networks. IEEE Transactions on Wireless Communications, vol. 9, no. 10, pp. 3112–3119, (2010).
[13] J. MinChul, K. Il-Min, Error Performance Analysis of
BPSK Modulation in Physical-Layer Network-Coded Bidirectional Relay Networks. IEEE Transactions on Communications, vol. 58, no. 10. pp. 2770–2775, (2010).
[14] W. Mao, X. Wang, A. Tang, H. Qian, ANC-ERA: Random Access for Analog Network Coding in Wireless Networks. IEEE Transactions on Mobile Computing, vol. PP, no. 99, pp. 1–16, (2015). [15] Q. T. Hoang, X. N. Tran, L. T. Nguyen, Cross-Layer
Design of Bidirectional-Traffic Supported Cooperative MAC Protocol. 2014 International Conference on Advanced Technologies for Communications (ATC), IEEE, Hanoi, Vietnam, pp. 586–593, (2014).
[16] C. Hucher, G. R. B. Othman, J. C. Belfiore, AF and DF Protocols based on Alamouti ST Code. IEEE International Symposium on Information Theory, Nice, pp. 1526–1530, (2007).
[17] S. Hangguan, C. Ho Ting, Z. Weihua, Cross-Layer Cooperative MAC Protocol in Distributed Wireless Networks. IEEE Transactions on Wireless Communications, vol. 10, no. 8, pp. 2603–2615, (2011).
[18] Wireless Medium Access Control (MAC) and physical layer (PHY) specifications: High Speed Physical Layer in the 5 GHz band. IEEE Std 802.11a-1999, pp. 1–102, (1999).