The handle http://hdl.handle.net/1887/21863holds various files of this Leiden University dissertation.
Author: Fayolle, Edith Carine
Title: From ice to gas : constraining the desorption processes of interstellar ices
From Ice to Gas
From Ice to Gas
Constraining the Desorption
Processes of Interstellar Ices
Proefschrift
ter verkrijging van
de graad van Doctor aan de Universiteit Leiden,
op gezag van de Rector Magnificus prof. mr. C. J. J. M. Stolker, volgens besluit van het College voor Promoties
te verdedigen op dinsdag 1 oktober 2013 klokke 13.45 uur
door
Edith Carine Fayolle
Promotores: Prof. dr. H. V. J. Linnartz
Prof. dr. J.-H. Fillion (Universit´e Pierre et Marie Curie, Paris, France) Co-promotor: Dr. K. I. ¨Oberg (Harvard University, Cambridge, USA)
Overige leden: Prof. dr. A. G. G. M. Tielens Prof. dr. H. J. A. Rottgering
Table of contents vii
Table of contents
Page
Chapter 1. Introduction 1
1.1 Interest for molecules in space . . . 1
1.2 Ices in the interstellar medium . . . 2
1.2.1 The need for an ice - gas connection . . . 2
1.2.2 The presence of ices . . . 2
1.2.3 Ice evolution during star formation - ice sublimation affects the chemistry . . . 5
1.2.4 Testing the ice to gas link . . . 6
1.3 Ice sublimation in the laboratory . . . 7
1.3.1 Thermal desorption of ices . . . 8
1.3.2 Non-thermal desorption induced by UV photons . . . 10
1.4 This Thesis . . . 13
Chapter 2. Laboratory H2O:CO2 ice desorption data: entrapment dependen-cies and its parameterization with an extended three-phase model 17 2.1 Introduction . . . 18
2.2 Desorption Model . . . 20
2.2.1 Basic three-phase model . . . 20
2.2.2 Extended three-phase model . . . 22
2.3 Experiments . . . 24
2.3.1 Experimental parameters . . . 24
2.3.2 Experimental procedures . . . 25
2.4 Experimental analysis . . . 26
2.4.1 Complementarity of RAIRS and QMS . . . 26
2.4.2 Desorption trends . . . 28
Thickness dependency . . . 28
Mixing ratio dependency . . . 29
Molecular dependency . . . 30
Heating rate dependency . . . 30
2.4.3 Tertiary mixtures . . . 31
2.4.4 Ice diffusion mechanisms: pore versus bulk diffusion . . . 32
2.5 Model parametrization and performance . . . 33
2.5.1 Parametrization . . . 33
2.5.2 Model performance . . . 34
Desorption trends modeling . . . 34
Quantitative agreement . . . 36
Predictive power . . . 36
2.7 Conclusions . . . 39
Chapter 3. CO ice photodesorption: a wavelength-dependent study 41 3.1 Introduction . . . 42
3.2 Experimental . . . 43
3.3 Results . . . 44
3.3.1 Absolute photodesorption yields for 1 eV spectral windows . . . . 44
3.3.2 CO photodesorption yield spectrum . . . 45
3.4 Discussion . . . 46
3.4.1 Mechanism . . . 46
3.4.2 Astrophysical implications . . . 47
3.5 Conclusions . . . 48
Chapter 4. UV photodesorption of interstellar CO ice analogues: from sub-surface excitation to sub-surface desorption 51 4.1 Introduction . . . 52
4.2 Methods . . . 53
4.3 Results and discussion . . . 54
4.3.1 Pure CO ice desorption - an exclusive DIET process . . . 54
4.3.2 Subsurface excitation . . . 55
4.3.3 Photodesorption of solid CO on top of H2O ice . . . 58
4.4 Conclusions . . . 61
Chapter 5. Wavelength-dependent UV-photodesorption of pure N2and O2ices 63 5.1 Introduction . . . 64
5.2 Method . . . 65
5.2.1 Experiments . . . 65
5.2.2 Data analysis . . . 66
5.3 Results . . . 67
5.3.1 Nitrogen photodesorption . . . 67
5.3.2 Oxygen photodesorption . . . 70
5.4 Discussion . . . 73
5.4.1 Photodesorption mechanisms for pure ices . . . 73
5.4.2 Astrophysical consequences . . . 75
5.5 Conclusions . . . 76
Chapter 6. Indirect UV photodesorption from CO:N2binary ices - an efficient grain-gas process - 77 6.1 Introduction . . . 78
6.2 Experimental methods . . . 79
6.3 Results . . . 82
6.3.1 Photodesorption from mixed CO:N2 ice . . . 82
6.3.2 Photodesorption from layered N2/CO and CO/N2ices . . . 83
6.4 Discussion and astrophysical implications . . . 84
Table of contents ix
6.4.2 Implications for N2 and CO gas phase abundance in dense cores . 87
6.4.3 Organics desorption through CO photoexcitation? . . . 88
6.5 Summary and conclusions . . . 88
Chapter 7. Linking the ice content and gas abundances of organic molecules in massive young stellar objects 91 7.1 Introduction . . . 92
7.2 Observations and Analysis . . . 94
7.2.1 Observations . . . 94
7.2.2 Spectral extraction and rms . . . 95
7.3 Results . . . 96
7.3.1 Line identification and characterization . . . 96
7.3.2 Spatial origin of the line emission . . . 101
7.3.3 Rotational temperature, and column densities . . . 101
7.3.4 Organics in hot core vs weak-line MYSOs . . . 107
7.3.5 An ice-gas connection? . . . 108
7.4 Discussion . . . 110
7.4.1 Weak line MYSOs versus hot cores . . . 110
7.4.2 The ice-gas connection: Observations vs. Theory . . . 112
7.5 Conclusions . . . 115
Bibliography 117
Nederlandse samenvatting 127
English summary 133
R´esum´e en fran¸cais 139
Curriculum vitae 145
Publication list 147
1
Introduction
Molecules are found throughout the universe.
The discovery of molecules in space opened up a window to the chemical complex-ity of the interstellar medium, enabling us to explore the embedded phases of star and planet formation as well as address the origins of life on Earth and maybe elsewhere in the universe. Indeed, since life as we understand it is molecular in nature, finding or-ganic molecules in space and more specifically in regions where stars and planets form, prompts questions about the development of life elesewhere. The molecular inventory in the interstellar medium, the processes leading to molecule formation, stability and delivery to planetary bodies are thus key questions that astrochemists are answering through a combination of observations, simulations, and laboratory experiments. The presence of icy mantles on interstellar dust grains play a key role in the formation and observation of molecules at every stage of the star-formation process. It is the ice evolution through processes encountered in space and their link with the presence of observed organic species in the gas phase that this thesis addresses.
1.1 Interest for molecules in space
A great diversity of chemical species can be found in the interstellar and circum-stellar media, going from atoms, simple diatomic molecules, to large carbon edifices like fullerenes, radicals and ions1. The first evidence for the presence of molecular
species in space were unidentified optical-UV interstellar lines that had no correspond-ing atomic signature (Merrill 1934). These lines have later been identified as electronic transitions of the CH and CN radicals (Swings & Rosenfeld 1937; McKellar 1940). Since then, more than 200 molecular species, including isotopologues, have been detected in outer space through their rotational, vibrational and/or electronic transitions. Their indentification through their emission and/or absorption features are used by astro-chemists to probe the physics of the environment in which they are found. Temper-ature, density, kinematics and energetic fields all have an impact on the molecular energy levels population and their line shape, making these molecular species useful tracers of conditions encountered in star-forming environments.
Chemicals are used to trace the physics but they also contribute to the physical pro-cesses. Molecules are efficient coolants in the interstellar medium that are necessary to
form stars as we know them. During the gravitational collapse of dense clouds induc-ing the formation of a protostar, the gas pressure increases and the gas temperature should rise due to the frequent collisions of atoms and molecules. The heating of the collapsing cloud poses a dilemma: since the heated gas wants to expand, the cloud col-lapse could be stopped or even reversed. Molecules found in the cloud gas play thus a significant role as they can effectively transport energy outside of the cloud through collisional excitation followed by radiative de-excitation, producing photons that can escape. The photons carry this energy away thus allowing the cloud to collapse. Dom-inant molecular coolants include CO, O2, H2O (e.g. Goldsmith & Langer 1978; Neufeld
et al. 1995; Goldsmith 2001).
From an astrobiological point of view, the discovery of molecules in space, and es-pecially the complex ones has changed society’s view on the origins of life, seeding the idea in people’s mind that life on earth may have emerged from interstellar molecules and that our solar system might not be the only planetary system harboring a rich chemistry in the universe. Molecules are observed at every stages of star formation and complex ones are expected to be present in disks where planets and comet form. It is thus likely that they are incorporated into planetary bodies during their forma-tion (Ciesla & Sandford 2012). Studying the chemical processes in star-forming envi-ronments and understanding the origin of molecular complexity would thus provide clues on the ordinary nature of our life-hospitable solar system.
1.2 Ices in the interstellar medium
1.2.1 The need for an ice - gas connection
Organic molecules are often associated with hot-core/corinos regions observed a-round high and low-mass protostars, respectively. Molecules like CH3OH, CH3CN,
CH3OCH3, CH3CHO, H2CO, HCOOH, CH3CH2OH, or CH3CH2CN are typically
ob-served through their rotational emission in these regions where densities are higher than 107 cm´3 and temperatures above 100 K (e.g. Blake et al. 1987; Cazaux et al. 2003;
Fuente et al. 2005). If ion-neutral reactions can explain the presence of molecules like CO, CS and small hydrocarbon chains in the interstellar medium (Herbst 1997), the high abundance of complex species in core regions around young stellar objects at rel-atively early stage of their formation requires other explanations since reactions rates are too low (Horn et al. 2004; Geppert et al. 2006). In addition, a fraction of these species are deuterated at levels that defy explanations by gas phase reactions alone (e.g. Cec-carelli et al. 2001; Parise et al. 2006). Ice-covered dust grains found in star-forming environments, do allow us to successfully explain these observations however, since they can act as catalyst for surface reactions.
1.2.2 The presence of ices
Section 1.2. Ices in the interstellar medium 3
Figure 1.1: Infrared Space Observatory (ISO) spectrum acquired by the Short Wave-length Spectrometer (SWS) of the star forming region W33A, HH46, and L1014 IRS, covering the 2.5 to 20 microns region. A variety of ice mantle and refractory grain core features are evident.
account for 1% of the cloud composition ; the rest of the matter consists of gas, mainly H2. It is on the surface of these dust grains that most molecules will form or freeze-out
in the cold regions of molecular clouds.
The hypothesis of the dust grains catalyzing molecule formation has been proposed very early on by van de Hulst (1949), who suggested that the molecular abundances should be directly related to the elemental abundances. Even though the gas grain in-terplay induces a more complex chemical inventory, the contribution of molecule for-mation mediated by the grains has been confirmed and adopted with the observation of condensed molecules along the lines of sight towards protostellar environments. The first observational evidence was the detections of solid H2O, identified through
its O-H stretching vibration at 3.08 microns (Gillett & Forrest 1973; Merrill et al. 1976). During the following decades, careful observations of ice features have been successful in identifying NH3, CO, OCN´, CH4, CH3OH among others as well as the presence of
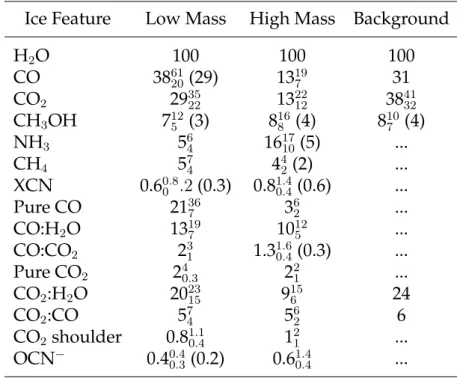
compo-Table 1.1. Abundance mediansaand lower and upper quartile values of ices and individual ice components with respect to H2O ice ( ¨Oberg et al. 2011a).
Ice Feature Low Mass High Mass Background
H2O 100 100 100
CO 3861
20(29) 13197 31
CO2 293522 132212 384132
CH3OH 7125 (3) 8168 (4) 8107 (4)
NH3 564 161710(5) ...
CH4 574 442 (2) ...
XCN 0.60.8
0 .2(0.3) 0.810..44 (0.6) ...
Pure CO 2136
7 362 ...
CO:H2O 13197 10125 ...
CO:CO2 231 1.310..64 (0.3) ...
Pure CO2 240.3 221 ...
CO2:H2O 202315 9156 24
CO2:CO 574 562 6
CO2 shoulder 0.810..14 121 ...
OCN´ 0.40.4
0.3 (0.2) 0.610..44 ...
Note. — a Values in parentheses include upper limits in the median calculation using survival analysis.
sitions have been obtained with the space-based Infrared Space Observatory (ISO) and its Short-Wavelength Spectrometer (SWS) instrument, allowing for spectral acquisition in the entire 2.5 - 45 microns window where vibrations of condensed molecules are in-tense. This survey investigated in a comprehensive way the ice abundances found along the lines of sight of intermediate to high-mass protostars (Dartois 2005, Gibb et al. 2004, and references therein). Examples of ice spectra are shown in figure 1.1 for three different interstellar regions. The ice composition is derived by subtracting the emission background due to the emitting YSO (or background star) and fitting the ice features with laboratory spectra for which the associated band strength is thus known (available for example in the Leiden data base for ice2). A follow-up ice composition survey around low-mass protostars environments and in pre-stellar cores have been realized using the Spitzer space telescope and its InfraRed Spectrometer (IRS) 5 - 30 microns (Boogert et al. 2008; Pontoppidan et al. 2008; ¨Oberg et al. 2008; Bottinelli et al. 2010; ¨Oberg et al. 2011a).
The typical ice compositions along the line of sight derived from all of the available ice surveys and for the various environments are presented in table 1.1 ( ¨Oberg et al. 2011a). H2O, CO, and CO2 are the main ice components along the line of sight of most
objects. The other ice components generally found are NH3, CH4, CH3OH and XCN.
Interstellar ices are far from simple since some of the molecules are found in pure
Section 1.2. Ices in the interstellar medium 5
phase, in water-dominated (polar) and/or in water-poor (apolar) ice phases. More-over some of the absorption features cannot be unambiguously attributed to a single species due to the intrinsic broadness of vibrational features in the solid phase and be-cause of the overlap in vibrational frequencies of molecules presenting similar chemi-cal functions. Comparing the ice composition variation and abundances between star-formation stages and low- and high-mass protostellar environments provided infor-mation on the forinfor-mation of the ice components and processes accompanying the ice evolution across star-formation. These findings are developed in the following subsec-tion.
1.2.3 Ice evolution during star formation - ice sublimation affects the chemistry
A cartoon depicting the current understanding of ice evolution during star forma-tion is presented in Fig. 1.2. At the prestellar stage, before the star is formed, molecules like H2O, CH4, NH3form at the surface of the grain through atomic and small molecule
collision and diffusion on the grains. The formation of CO2 together with H2O at the
prestellar stage is consistent with CO2 observed mainly in a polar environment (Knez
et al. 2005). When the cloud gravitationally collapses to form the star, the temperature decreases and molecules that were initially in the gas phase freeze-out on top on the H2O-rich layer. Since the main species to deplete at this stage is CO, an apolar layer
will form on top of the already present polar ice mantle (Pontoppidan et al. 2003). At this early stage the dominant chemical reaction occurring on ices is hydrogenation since the regions are cold and deeply-embedded in the dark cloud, preventing efficient UV penetration. The hydrogenation of the CO-rich ice top layers will result in the for-mation of more complex species like H2CO and CH3OH (e.g. Tielens & Hagen 1982;
Watanabe & Kouchi 2002). The observed amount of CH3OH is in good agreement
with model predictions based on CO hydrogenation schemes (Pontoppidan et al. 2003; Cuppen et al. 2011).
At the protostellar stage, the newly formed star will grow from the collapse of its envelope, inducing changes in the ice composition. The heat induced by the star will lead to thermal reactions mainly activated by diffusion within the solid. Moreover the UV radiation resulting from the interaction of cosmic rays with H2 gas will induce in
the ice a very rich chemistry since the radicals created will diffuse and react to form more complex species (Garrod & Herbst 2006; Garrod et al. 2008). In addition to the chemical changes, the icy grains will undergo sublimation induced by the protostar heating and energetic particles, which will affect the chemistry occurring on both the grains and in the gas phase. In warm regions close to the protostar where Tą100 K, most of the ice material on the grains sublimates into the gas phase, leading to a rich gas phase chemistry activated by the higher temperatures and densities (e.g. Charnley et al. 1992).
in ice sublimation, freeze-out cycles, and inducing a complex ice structure and com-position that is yet to be understood. The dust grains in the disk coagulate to form planetesimals and some of the ice material may end up in the planets, satellites, and comets of mature planetary systems (Okuzumi et al. 2012). Understanding the evolu-tion of the icy mantle composievolu-tion and in particular the presence of complex molecules would provide valuable insights into the incorporation of prebiotic molecules during the planet and comet formation process.
1.2.4 Testing the ice to gas link
Molecules observed in the gas phase in star-forming environments are tightly linked to the physical and chemical processes occurring in the solid state. According to Herbst & van Dishoeck (2009), the formation of organics species of 6 or more atoms, so called complex organics, could either result from 1) reactions on grains through atomic bom-bardment during the prestellar stage and early protostellar stage (0th generations of organics), 2) energetic processing and / or heat-activated chemistry creating a the 1st generation of organics, 3) sublimation of the precursor from the ice and formation of 2nd generation of organics in the warm and dense gas-phase through neutral-neutral or ion-neutral reactions (see Fig. 1.2). In all cases, the ice composition should be linked to the observed organics in the gas phase, provided that other factors such as UV-fields are not drastically influencing the organic chemistry in the gas-phase. The presence of an ice - gas link could validate the organic formation scenario presented above but is yet to be confirmed. The small number of sources having both ice observations and phase observation prevented until now the search for correlations between gas-phase organics and parent species in the ice. Chapter 7 presents new insights on how to extend this number of sources and provides tentative ice-gas correlations.
Since part of the ice organic content will end-up in planet forming regions, it is important to understand the details of this organic chemistry and particularly where the different species are formed and how. It is, however, very difficult to observe or-ganics in the solid state due to confusion between their broad vibrational features ; the features cannot thus be unambiguously attributed to a single species. Instead, one must rely on gas phase observations where lines are quite distinct. Spatially resolved observations together with a careful analysis of the molecule excitation conditions can provide good constraints on the classification of organics into 0th, 1st, and 2nd gener-ation as the first two will be found in the cold gas phase due to possible non-thermal desorption and the 2nd generation will only be present in the warm gas phase close to the protostar (see Fig. 1.2).
Section 1.3. Ice sublimation in the laboratory 7
ANRV385-AA47-11 ARI 25 July 2009 0:2
Outflow cone CO freezeout 10 30 CO evaporation 100
H2O evaporation
300
n (cm–3)
T (K)
108 107 106 105 104
Precollapse Collapsing envelope Hot core Disk Grain Complex organics
H2O-rich
Grain
Complex organics
H2O-rich
CO-rich
Grain
H2O-rich CO-rich
Grain
Grain
CH3OH
CH3OH
Grain
H2O-rich
Grain
H2O-rich CO-rich
Radicals H2O-rich
2
1
0
Figure 14
Cartoon representation of the evolution of material from the prestellar core stage through the collapsing envelope (size∼0.05 pc) into a protoplanetary disk. The formation of zeroth- and first-generation organic molecules in the ices is indicated with 0 and 1, and the second-generation molecules in the hot-core/corino region when the envelope temperature reaches 100 K, and even strongly bound ices start to evaporate, are designated 2. The grains are typically 0.1µm and are not drawn to scale. The temperature and density scale
refer to the envelope, not to the disk (see alsoFigure 4). Once material enters the disk, it will rapidly move to the cold midplane where additional freeze-out and grain surface chemistry occur. All ices evaporate inside the (species-dependent) sublimation radius. For H2O and trapped complex organic molecules, this “snow line”
lies around a few astronomical units in a disk around a solar mass star. Figure by E. van Dishoeck & R. Visser.
the protostar and warm up. As in the one-point model of Hassel, Herbst & Garrod (2008), much of the chemistry leading to the synthesis of complex molecules occurs between radicals on the surfaces of warming dust particles. The model is in reasonable agreement with observed gas-phase abundances in the hot corino IRAS 16293–2422 including some complex molecules, and with ice-mantle abundances in the low-mass protostar Elias 29.
Although it does not contain an explicit complex molecule chemistry, an even more recent treatment follows the evolution of matter from a collapsing envelope into a circumstellar disk via a two-dimensional semianalytical model (Visser et al. 2009). The chemical history of material in the disk depends on its location: In the inner disk, weakly bound species like CO have adsorbed and desorbed from the grains multiple times during their journey from cloud to disk, whereas the outer
disk still contains pristine CO ice from the prestellar stage. Strongly bound molecules like H2O
www.annualreviews.org • Complex Interstellar Molecules 471
Annu. Rev. Astro. Astrophys. 2009.47:427-480. Downloaded from arjournals.annualreviews.org
by 82.139.81.51 on 09/29/09. For personal use only.
Figure 1.2: Cartoon representation of the ice evolution from the prestellar stage, through the collapsing envelope, and into a protoplanetary disk. The prestellar stage will see the formation of the first H2O-dominated ice mantle, followed by gas-phase
freeze-out during cloud collapse, forming a CO-rich mantle. The icy-grains will un-dergo hydrogenation, heat and UV activated reactions in the protostellar phase while flowing towards the star. Most of the icy mantle will sublimates when grains reach the 100 K region, giving rise to an active hot-core chemistry. Alternatively some of the icy grains will flow in the mid-plane of protoplanetary disks where planets and comets are formed, and the grains will be incorporated into their composition. Stages where 0th, 1st, and 2nd generation of organic molecules form are indicated. Credit E. van Dishoeck and R. Visser.
1.3 Ice sublimation in the laboratory
grains or in the gas phase. The state in which molecules are found also provides valu-able information from a physical point of view as it depends on the density, tempera-ture, radiation conditions of the medium. Different kinds of sublimation can be distin-guished: thermally-induced, photon-induced, electron-induced, high-energy particle induced (sputtering) and chemically-induced. If all of theses mechanisms can trigger ice desorption to a certain extent, some of them will dominate in different regions of the ISM. The thermally-induced and UV-photon induced desorption are developed in this thesis.
1.3.1 Thermal desorption of ices
Thermal desorption of ices is the sublimation process that dominates the gas-grain interactions during the protostellar stage where the envelope collapses onto the newly formed star. The icy grains flow towards the young star and the ice mantles are warmed up. This will induce thermal desorption of the ice into the gas phase accord-ing to the bindaccord-ing energy of the desorbaccord-ing molecules onto the surface. The thermal desorption process depends highly on intermolecular interactions and on the kinds of desorbing sites. Thus one molecular component in mixed interstellar ice is very un-likely to desorb at only one single temperature. It is not straightforward to model the desorption process in astrochemical simulations since ice parameters such as molec-ular composition, ice thickness, internal arrangement, must be taken into account in addition to the physical parameters of the warm-up.
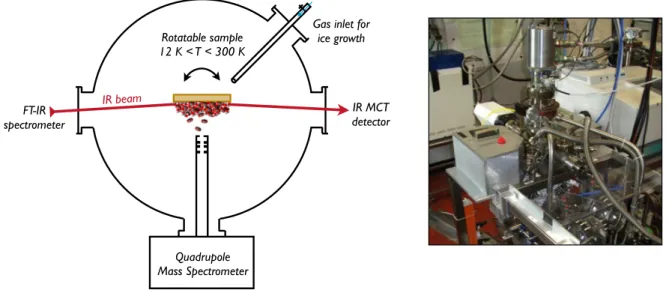
FT-IR spectrometer
IR MCT detector
Quadrupole Mass Spectrometer
Gas inlet for ice growth Rotatable sample
12 K < T < 300 K
IR beam
Figure 1.3: The CRYOPAD experiment from the Sackler Laboratory for Astrophysics used to perform the thermally-induced desorption experiments presented here.
devel-Section 1.3. Ice sublimation in the laboratory 9
oped by Fleur van Broekhuizen in the Sackler Laboratory for Astrophysics in Leiden (See figure 1.3). In this low pressure environment („10´10 mbar, „107 particles per
cm´3), a gold sample cryogenically cooled can reach temperatures as low as „12 K.
Molecular ices can be grown with monolayer precision onto the sample by injecting pure or pre-mixed gas into the chamber through a capillary tube perpendicular to the sample. A heater can regulate the temperature and warm-up the sample. For the study of ice desorption, the Temperature Programmed Desorption (TPD) technique is used and consists of linearly warming-up the ice sample. The rates employed here fall be-tween 0.5 and 5 K min´1 but TPD rates vary from groups to groups according to the
literature. The molecules desorbing from the ice into the gas phase can be detected in CRYOPAD by Quadrupole Mass Spectrometry (QMS, model Balzers QMA 200) and Reflection Absorption InfraRed Spectroscopy (RAIRS) using a Fourier transform in-frared (FTIR) spectrometer over the 4000 - 900 cm´1region. The infrared set-up is also
used to quantify the ice thickness and ice loss during warm-up. Following the desorb-ing molecules from the ice (or the ice loss) with respect to the temperature provides insights on their binding energies and desorption mechanisms. These information are further incorporated into kinetic models that can be run under astrophysical warm-up time-scales, in the order of few Kelvin per century.
QMS
QMS
(i) (ii) (iii) (iv)
Figure 1.4: Desorption of CO from water-rich ice monitored by mass spectrometry. The four CO desorption peaks originate from (i) desorption from CO rich surface, (ii) H2O
rich surface, (iii) desorption during H2O phase change, (iv) co-desorption with H2O.
The cartoons show the QMS detection of CO at low temperature and CO trapped with water. CO is depicted as the red species and H2O as the red species.
(Viti & Williams 1999). Collings, Brown, Barnun, Kimmel, among others, studied the desorption characteristics of such systems through TPD (Burke & Brown 2010). In the case of volatiles species like CO mixed with water (see for example TPD profile in 1.4), desorption of CO molecules mixed in a water matrix can occur from (i) CO sur-face, due to possible diffusion and segregation of volatile component to the top of the ice, (ii) from mixed CO-H2O surface, (iii) volcano desorption during H2O ice phase
change from amorphous to crystalline, and (iv) co-desorption with H2O. The first two
release mechanisms occur around the desorption temperature of pure CO ice (start-ing around 30 K) while the last two occur in temperature regions where H2O desorbs.
There is thus a clear difference between the volatile material that desorbs at low tem-perature and the rest that stays trapped within the water ice until its desorption. This last ”trapped” fraction of molecules will stay longer on the grains and can participate in surface chemical schemes while the species released at lower temperature are avail-able for gas phase reactions (Viti et al. 2004). Quantifying and predicting the amount of volatile material that stays trapped within the water ice under astrophysical condi-tion is thus a crucial for a good estimacondi-tion of the protostellar chemical evolucondi-tion and will be addressed in the chapter 2 of this thesis through laboratory experiments and modeling.
1.3.2 Non-thermal desorption induced by UV photons
In interstellar regions where the temperature is low but UV photons are present, sublimation of molecules can occur through non-thermal processes driven by UV-photons. This non-thermal desorption process can be responsible for the presence of cold gas in environments where molecules should be frozen out onto dust grains. Thus it regulates the ice-gas balance (Hollenbach et al. 2008). In particular, Willacy & Langer (2000); Dominik et al. (2005); Oka et al. (2012) among others showed that this mecha-nism was necessary to explain H2O observation in protoplanetary disks. The photon
distribution in star-forming environments (See Fig. 1.5) has different origins: 1) pho-tons from the InterStellar Radiation Field (ISRF) generated by surrounding stars can penetrate the first layers of molecular clouds depending on their density (Mathis et al. 1983), 2) in inner regions shielded from the ISRF, it is the interaction of cosmic rays with H2 that generates a local UV field composed of the lyman and werner photon
series (e.g. Gredel et al. 1987), 3) when the protostar turns on, it will also emit UV pho-tons that may reach the ice and 4) in protoplanetary disks, the accretion of material onto the protostar will generate a UV field dominated by Lyman-αand other charac-teristic emission lines (Bergin et al. 2003). These typical profiles will be altered through gas absorption and dust scattering as the photons travel to the ice regions and radiative transfer codes are necessary to predict the exact UV profiles inducing photodesorption (Guzm´an et al. 2011; Fogel et al. 2011).
The photodesorption process has been studied in the laboratory and efficiencies for the main ice components have been quantified. The first detailed study that pro-vided photodesorption rates for the interstellar medium was published by Westley et al (1995a,b) on pure H2O ice. They found a strong dependence to the ice
Section 1.3. Ice sublimation in the laboratory 11
Figure 1.5: Characteristic UV fields encountered in the ISM. The dense cores spectrum is derived by Gredel et al (1987), the ISRF by Mathis et al (1983) and the protoplanetary disk TW Hydrae by Herczeg et al (2002), Valenti et al (2003) and Johns Krull & Herczeg (2007). The integrated area of each spectrum is normalized to 1 and offsets are used for clarity.
H2 discharge lamp as the UV source, emitting mainly at lyman alpha and a quartz
microbalance to follow the ice loss. Their derived photodesorption rates are in the 10´3molecules desorbed per incoming photons range, assuming that H
2O is the main
species desorbing from the ice. Following studies on H2O/D2O (Watanabe et al. 2000,
Yabushita et al. 2009, ¨Oberg et al. 2009b), CO ( ¨Oberg et al. 2007, 2009, Mu ˜noz Caro et al. 2010), N2( ¨Oberg et al. 2009), CO2( ¨Oberg et al. 2009, Baragiola et al. 2012, Yuan & Yates
2013) confirmed the high photodesorption rates and investigated the various depen-dencies to the experimental parameters and the impact of photochemistry. Molecular dynamics simulations have also contributed to the microscopic understanding of the photodesorption process (Andersson et al. 2005, 2006, 2008, Arasa et al. 2010, 2011). For the case of CO ice, both ¨Oberg et al. (2007, 2009) and Mu ˜noz Caro et al. (2010) derived efficiencies that are temperature dependent but thickness and dose indepen-dent, hinting for a surface mechanism. For the absolute photodesorption values, the first study derived a rate in the 10´3molecules photon´1range while the other derived
a higher efficiency in the 10´2molecules photon´1. These values are still under debate
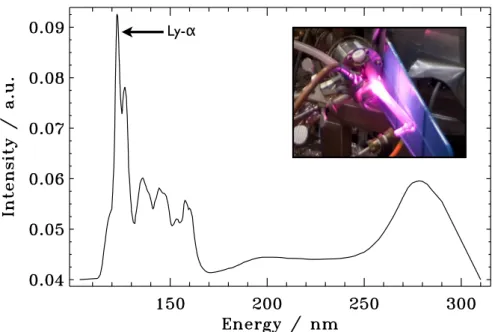
Ly-α
Figure 1.6: The emission profile of a broadband H2 discharge lamp peaking at lyman
alpha (Mu ˜noz Caro & Schutte 2003).
Quadrupole Mass Spectrometer
Figure 1.7: Schematic view of the set-up SPICES from the LPMAA used for the monochromatic irradiation of interstellar ice analogues at the SOLEIL synchrotron on the DESIRS beamline.
pho-Section 1.4. This Thesis 13
todesorption of interstellar ice analogues is traditionally studied in the laboratory us-ing an H2 microwave discharge lamp as source of UV photons. The set-up CRYOPAD
described in the previous section is dedicated to the study of photo-processes using an H2 lamp. Such a UV source, based on the excitation of H atoms, presents a flux
high enough to induce processes that can be monitored on experimental time-scales. Figure 1.6 presents the spectrum of one of these lamps. It peaks at lyman-αbut other radiative features, in particular at 160 nm can come from the de-excitation of H2. The
spectrum profile is very sensitive to the conditions in which the lamp is used, namely H2 pressure, microwave power, residual vacuum. Thus, a comparison of
photodes-orption efficiencies between experiments set-ups requires the knowledge of the lamp spectrum used for irradiation.
As an alternative to H2lamps, the impact of the photon energy on the ice
photodes-orption efficiencies and photodesphotodes-orption mechanism are investigated using a tunable monochromatic light source in the VUV. The outcome of these frequency-resolved studies is presented in chapters 3 to 6 of this thesis. Successful proposals for beamtime on the DESIRS beamline at the SOLEIL synchrotron allowed us to study the photodes-orption mechanism of CO, N2, and O2 ices using the set-up SPICES developed at the
LPMAA in Paris (depicted in Fig. 1.7). The ultra-high vacuum chamber is equipped with a cryostat that can cool down a rotatable 3-face sample to temperatures as low as 10 K. Ices are grown on a polycrystalline gold surface or on Highly Oriented Py-rolitic Graphite (HOPG) at submonolayer precision using a retractable dosing line. The changes in the solid state can be monitored using RAIRS and desorbing species can be probed using a QMS. The set-up is directly coupled to the undulator-based DE-SIRS beamline and photon fluxes measured by calibrated photodiodes reach the 1014
photon s´1 range without the use of a monochromator and reach the 1012photon s´1
range with the monochromator. Only photons in the 7 - 13.6 eV spectral range are used since a minimum of about 7 eV is required to induce electronic transition in the species studied here and photons above 13.6 eV are absorbed by hydrogen in the ISM. It is the acquisition of calibrated photodesorption spectra that allows for the derivation of photodesorption rates with respect to the UV fields encountered in space and that pro-vides insight into the photodesorption mechanisms of pure ices (chapters 3 to 5) and binary mixtures (chapter 6).
1.4 This Thesis
around massive protostars is presented in the last chapter.
– Chapter 2 addresses the question of how volatile molecules like CO2 and CO
desorb from the water-rich icy mantle when the are warmed-up as it would be the case during protostellar envelope collapse onto a protostar. Most models includ-ing this process assumed that each ice component would desorb at its own des-orption temperature but when interacting with water, some of the volatile content can stay trapped within the water ice and desorb together with the water molecules at higher temperature. Temperature programmed desorption experiments are per-formed on ices of different thicknesses, volatile concentration, for different volatiles components in water and for various heating rates in order to parameterize a model reproducing the volatile trapped fraction. The gas-grain model distinguishes three-phases: gas, ice surface and bulk. The desorption process occurs from the surface only and the surface is replenished by the mantle molecules, according to the en-hanced diffusion of volatiles compared to water.
– Chapter 3presents the first wavelength-dependent investigation of ice photodes-orption. The photodesorption of thin CO ice films is induced by VUV monochro-matic light and the resulting photodesorption spectrum is obtained by monitoring through mass-spectrometry the desorbing molecules versus the photon energy. The photodesorption profile is tightly linked to the absorption spectrum of the ice, hint-ing for a Desorption Induced by Electronic Transition (DIET) process which does not involve the substrate.
– Chapter 4investigates in more detail the CO photodesorption mechanism. There, the photodesorption spectrum of CO is analyzed for different ice thicknesses and on different substrates, which confirms the ice-only related process and the indepen-dence to the ice thickness proposed in chapter 3. This implies a mechanism occur-ring in the top-most layers of the ice. The use of isotopically labeled ice layers of CO (12CO/13CO) unveiled the indirect character of photodesorption: it is the excitation
of the sub-surface molecules that triggers the desorption of the surface species. The photodesorption of CO on water is also investigated and reveals that the H2O
inter-nal structure can highly quench the photodesorption of top CO layers.
– Chapter 5 focuses on the photodesorption of N2 and O2, two diatomic species
that are infrared inactive. N2 photodesorption occurs in the same fashion as CO
photodesorption : it is the electronic excitation that induces the desorption. For O2,
the photodesorption mechanism is less straightforward since the UV irradiation can induce dissociation. The formation of oxygen radicals and ozone can lead to pho-todesorption in addition to the indirect process of importance for CO and N2.
– Chapter 6 investigates the UV irradiation of CO:N2 binary ice, which presents
a first step in understanding the photodesorption of more astrophysically relevant ices. There the photodesorption of both species is investigated for the case of mixed and layered ices. The indirect mechanism found in the case of pure CO and N2ices is
Section 1.4. This Thesis 15
same photodesorption spectrum, which is the co-addition of the single species pho-toabsorption spectra. This indirect mechanism where CO excitation can promote the desorption of N2, even at wavelengths where N2 is transparent, can explain the
observed anti-correlation of cold CO and N2gas in prestellar cores. This study
beau-tifully emphasizes the crucial role of the ice composition and structure, which must be taken into account when modeling photo-induced processes.
2
Laboratory H
2
O:CO
2
ice
desorption data
Entrapment dependencies and its parameterization with an
extended three-phase model
Abstract. Ice desorption affects the evolution of the gas-phase chemistry during the protostellar stage, and also determines the chemical composition of comets forming in circumstellar disks. From observations, most volatile species are found in H2O-dominated ices.
The aim of this study is first to experimentally determine how entrapment of volatiles in H2O ice depends on ice thickness, mixture ratio and heating rate, and second,
to introduce an extended three-phase model (gas, ice surface and ice mantle) to describe ice mixture desorption with a minimum number of free parameters. Thermal H2O:CO2ice desorption is investigated in temperature programmed
des-orption experiments of thin (10 – 40 ML) ice mixtures under ultra-high vacuum conditions. Desorption is simultaneously monitored by mass spectrometry and reflection-absorption infrared spectroscopy. The H2O:CO2 experiments are
com-plemented with selected H2O:CO, and H2O:CO2:CO experiments. The results are
modeled with rate equations that connect the gas, ice surface and ice mantle phases through surface desorption and mantle-surface diffusion.
The fraction of trapped CO2increases with ice thickness (10–32 ML) and H2O:CO2
mixing ratio (5:1 – 10:1), but not with one order of magnitude different heating rates. The fraction of trapped CO2 is 44 – 84 % with respect to the initial CO2
content for the investigated experimental conditions. This is reproduced quanti-tatively by the extended three-phase model that is introduced here. The H2O:CO
and H2O:CO2:CO experiments are consistent with the H2O:CO2desorption trends,
suggesting that the model can be used for other ice species found in the interstellar medium to significantly improve the parameterization of ice desorption.
2.1 Introduction
In pre-stellar cores, cold outer protostellar envelopes and protoplanetary disk mid-planes, most molecules, except for H2, are frozen out on dust grains, forming ice
man-tles. The main ice component in most lines of sight is H2O, followed by CO and CO2,
with a typical abundance ofp0.5´1.5q ˆ10´4 for H2O ice with respect to H2 around
solar-type protostars (van Dishoeck 2006). Infrared observations of pre-stellar cores show that most CO2 ice and some of the CO ice is mixed with H2O (Knez et al. 2005).
The remaining CO and CO2 are found in separate ice layers. Based on these
observa-tions, H2O and CO2are thought to form simultaneously on the grain surface during the
early stage of cloud formation. When the cloud becomes denser, gas phase CO freezes out on top of the water-rich ice, resulting in a bi-layered ice mantle, as described in Pontoppidan et al. (2008).
Once the pre-stellar core starts collapsing into a protostar, it heats its environment, including the icy grains. This results in the desorption of the CO-rich layer into the gas phase, in structural changes in the water-rich ice layer, and eventually in the desorp-tion of the water-rich layer (Pontoppidan et al. 2008). Such an ice desorpdesorp-tion scheme provides most of the gas phase reactants for the chemistry taking place at later stages in these warm regions (Doty et al. 2004). It is therefore crucial to understand ice mix-ture desorption and to effectively implement it in astrochemical networks. The aim of this study is to provide a laboratory basis for this process and to demonstrate how it can be modeled both in the laboratory and in space.
Laboratory experiments have provided most of the current knowledge about ice thermal desorption, including desorption energies for most pure simple ices (Sand-ford & Allamandola 1988, 1990; Fraser et al. 2001; Collings et al. 2004; ¨Oberg et al. 2005; Brown & Bolina 2007; Burke & Brown 2010). Desorption from ice mixtures differs from pure ice desorption because of different binding energies between the mixture com-ponents (e.g., the CO binding energy increases from 830 K in pure ice to 1180K in H2O-dominated ice mixtures (Collings et al. 2003)) and because of trapping of volatile
species in the H2O hydrogen-bonding ices (Collings et al. 2004). Volatile components
therefore desorb from H2O-rich ice mixtures at a minimum of two different
tempera-tures, corresponding to the desorption of the species from the surface of the H2O ice
and from molecules trapped inside the bulk of the H2O ice, which only start desorbing
at the onset of H2O desorption. Additional desorption is sometimes observed at the
temperature for pure volatile ice desorption and during ice re-structuring, e.g., at the H2O phase change from amorphous to crystalline (Viti et al. 2004). This H2O
restructur-ing occurs at„140 K in the laboratory (for astrophysical timescales the re-structuring temperature and desorption temperature decrease), which is close to the onset of H2O
desorption (Collings et al. 2004).
Of the different ice mixture desorption features, the entrapment of volatile species in H2O ice is astrochemically the most important to quantify. The trapping of CO in
Section 2.1. Introduction 19
AU if trapped in H2O ice (Aikawa et al. 2008; Visser et al. 2009). Efficient ice trapping
may therefore allow some volatiles to stay frozen on the dust grains during accretion of envelope material onto the forming protoplanetary disk (Visser et al. 2009).
There are only a few models that have incorporated the effects of ice mixture des-orption. Collings et al. (2004) investigated the desorption of 16 astrophysically relevant species from H2O:X 20:1 ice mixtures. Viti et al. (2004) and Visser et al. (2009) used the
results of Collings et al. (2004) to split up the abundance of volatiles in up to four differ-ent flavors, with differdiffer-ent desorption temperatures. These correspond to the fraction of each ice desorbing at the pure ice desorption temperature, from a H2O surface, during
H2O ice restructuring and with H2O, respectively. This approach has provided
infor-mation on the potential importance of ice trapping for the chemical evolution during star formation. However, this model does not take into account specific ice characteris-tics such as ice thickness, volatile concentration and heating rate, on which the amount of trapped volatiles in the water ice may also depend (Sandford & Allamandola 1988). These characteristics need to be determined experimentally to correctly parameterize step models, where such are sufficient to model ice desorption. Strong dependencies on e.g. ice thickness or concentration would however warrant the development of a more continuous parameterization of ice desorption than the assignment of flavors.
These dependencies are naturally included in a few ice mixture desorption mod-els of specific binary ices (Collings et al. 2003; Bisschop et al. 2006). The molecular specificity of these models, together with a large number of fitting parameters has, however, prevented their incorporation into larger astrochemical models. Therefore, in most gas-grain networks, desorption is still treated as if ices were pure, disregard-ing volatile entrapment in the water matrix (e.g. Aikawa et al. 2008).
Another problem with current gas-grain codes is that evaporation is often incor-porated as a first-order process, while it is experimentally found to be a zeroth-order process with respect to the total ice abundance for ices thicker than one monolayer. Desorption models from the last decades have shown the necessity of using a zeroth order kinetics (Fraser et al. 2001; Collings et al. 2003). Incorporating ice desorption as a first-order process with respect to the total ice abundance effectively means that molecules throughout the whole ice are allowed to desorb at the same time, which is non-physical (Fraser et al. 2001; Bisschop et al. 2006). This can be solved by treating the bulk and surface of the ice as separate phases as it has been done by Pontoppi-dan et al. (2003) and PontoppiPontoppi-dan et al. (2008) for CO ice desorption and by Collings et al. (2005) for H2O desorption and crystallization. Its successful use in astrochemical
been generally used for ice mixture desorption, nor has it been further developed, pre-sumably because it did not correctly reproduce the experimentally observed amount of volatiles trapped in the water ice.
The goals of the present study are first to experimentally characterize how the trap-ping efficiency of CO2 in H2O ice depends on different ice characteristics (with
com-plementary experiments on CO and tertiary mixtures) and second to use these exper-iments as a guide to improve our understanding of the trapping process within the three-phase model framework. The description of the extended three-phase model is explained in Section 2.2. The experiments used to get information on the volatile en-trapment and to calibrate the model are described in Section 2.3. Laboratory results on H2O:CO2 ices, complemented by H2O:CO and H2O:CO2:CO ice desorption results, are
presented in Section 2.4. Section 2.5 presents the model fitting parameters and model results. Finally, the consequences of treating ice mixture desorption with the extended three-phase model under astrophysical conditions are discussed in Section 2.6.
2.2 Desorption Model
This study addresses the desorption of volatiles mixed with water and how to pre-dict the fractions of volatiles in the ice and gas phase during a warm-up of the ice. The model is a system of rate equations based on the Hasegawa & Herbst (1993) model, but with the addition of diffusion. It aims at providing a solution for the amount of volatiles trapped in water with respect to the ice characteristics that can be directly in-cluded into astrochemical models, as used by Viti et al. (2004) and Visser et al. (2009). The model applies to species in the water-rich ice layer; the interface with an upper CO-rich ice layer is not treated here.
2.2.1 Basic three-phase model
a) b)
Figure 2.1: Cartoon defining the ice mantle (white), ice surface (gray), and gas phase (black) according to the Hasegawa & Herbst (1993) three-phase model. Panels a) and b) show the different phases before and after a desorption event.
Section 2.2. Desorption Model 21
presented here. The model is based on the principle that molecules can only desorb from the surface into the gas phase and that the mantle molecules can only migrate to the surface following the desorption of a surface molecule. The time-dependent gas abundance of speciesiis given by
dngi
dt “Revap (2.1)
where,
Revap“`νe´Ei{T˘ns
i (2.2)
with ngi and ns
i the gas phase and surface abundance of species i, respectively, Ei its binding energy in K, andν a pre-exponential factor taken equal to1012s´1, which is a
standard value for physisorbed species (Biham et al. 2001). The surface abundance of speciesican be written as:
dns
i
dt “ ´Revap`Rrepl (2.3)
where,
Rrepl“α
« ÿ
j `
νe´Ej{T˘ns
j ff nm i ř j
nmj (2.4)
wherenmi is the mantle abundance of speciesi, řnmj the total number of molecules in the mantle and α is the ice coverage on the surface, which is set to 2 ML to account for surface roughness. The first term in Eq. 2.3 represents the loss of moleculesifrom the surface by thermal desorption. The second term is related to the replenishment of the surface sites by mantle molecules: the empty sites created by the desorption of any type of species from the surface, ř
j `
νe´Ej{T˘ns
j, are statistically filled by molecules
coming from the mantle. The probability for these molecules to be species of type i
is equal to its mantle fraction, nmi
ř nm
j. The mantle abundance, n m
i , of speciesi changes according to
dnm
i
dt “ ´Rrepl. (2.5)
Because of the term nmi
ř nm
j , the replenishment of the surface phase by the mantle
molecules during ice mixture desorption depends only on the mixing ratio of each species in this model,e.g., for a H2O:CO2 1:1 ice mixture, a molecule that desorbs into
to be replaced by a CO2 molecule. This results in desorption of some volatile species
around the pure ice desorption temperature and the rest remains trapped in the water ice since water molecules quickly saturate the surface phase.
The ice abundancesnsiandnmi are all in cm´3, a unit directly related to the gas phase
abundance. The abundance of speciesion the surface is defined via the relation
nsi “Nisnd (2.6)
whereNisis the average number of moleculesion the grain surface, andnd is the dust abundance. The same relation applies for the mantle abundance.
2.2.2 Extended three-phase model
The original three-phase model does not account for the preferred replenishment of the surface phase by volatile mantle species or that volatile species may diffuse more easily in the ice compared to water. ¨Oberg et al. (2009b) showed that this diffusion can result in segregation of the ice components, which is important for temperatures well below the desorption energy of most volatile species in an ice mixture. This demix-ing mechanism changes the surface replenishment probabilities proposed in the orig-inal three-phase model by Hasegawa & Herbst (1993). Our proposed extension of the three-phase model accounts for this by introducing a mantle-surface diffusion term. Trapping of volatiles still occurs, but the surface-mantle diffusion of volatiles is en-hanced compared to the original model, resulting in that more than 50 % of the empty sites are filled by volatiles species. Quantitatively, this changes the surface and mantle abundancesnsi andnmi as follows:
dnsi
dt “ ´Revap`Rrepl`R diff
i , (2.7)
and
dnm
i
dt “ ´Rrepl´R diff
i (2.8)
with
Rdiffi “fiν »
— –n
s H2O
nmi
ř
j
nm
j
e´Ediff{T ´ns
i
nm H2O
ř
j
nm
j
e´Ediff{T
fi
ffi
fl, (2.9)
and
Ediff“
ˆ
swapH 2O´i´
EH2O´Ei 2
˙
Section 2.2. Desorption Model 23
fori‰H2O, and whereswapH2O´i is the energy barrier for a volatile moleculeiand a wa-ter molecule to swap ( i.e. change position) within the ice and fi a fraction between 0 and 1 that is described below. The expression for the gas phase abundance remains unchanged (see Eq. 2.1). The diffusion term Rdiffi is added to the surface abundance (subtracted from the mantle abundance) to enhance the mantle to surface circulation for a volatile speciesi at the expense of the water, thus, Rdiff
i is expressed differently for volatile and water molecules. The volatile ice diffusion rate depends on the bal-ance of the probability of volatile molecules to move from the mantle to the surface at the expense of a water molecule and on the probability of the reverse process. This swapping process probability depends on the energy barrierswapH
2O´i of the process and
on the energy difference before and after the swap, equal toEH2O´Ei. The diffusion
rate for the water molecules is the negative sum of the diffusion rates for the volatiles,
RHdiff 2O“ ´
ř
iRdiffi , since the total abundance of molecules in the mantle and in the sur-face is not affected by the diffusion process. A similar formalism was used to describe H2O:CO2 segregation in ¨Oberg et al. (2009b); an exchange of a surface H2O molecule
and a mantle volatile is generally energetically favorable because H2O forms stronger
bonds than volatile species and a mantle H2O molecule can form more bonds
com-pared to a surface H2O molecule.
From segregation studies of binary ices, it has become clear that only a limited frac-tion of the mantle participates in the mantle–surface circulafrac-tion and that this fracfrac-tion depends on the initial ice mixture ratio ( ¨Oberg et al. 2009b). This is represented by the fractionfi
fi“1´
nmi ,ini´cipxinii qβ
nm
i
(2.11)
where nmi ,ini is the number of mantle molecules i initially in the ice, ci an empirical factor determined for each volatilei, andxini
i the initial mixing ratio of volatilesiwith respect to water. The expression cipxinii qβ describes the number of mantle molecules available for segregation for a particular ice mixture before the onset of desorption and follows the form found by ¨Oberg et al. (2009b) in ice segregation experiments when β is set equal to 2. The termnmi ,ini´cipxinii qβ is the number of mantle molecules protected from segregation. When the later expression exceeds the current number of volatile mantle moleculesnmi ,fireaches zero and segregation stops,i.e., the diffusion of volatile mantle molecules to the surface stops. Thus this definition results in a gradual slowdown of the ’upward’ mantle-surface diffusion of volatile species, regulating the trapping characteristics of H2O ice for different volatiles.
We have tested the performance of this extended three-phase model on the desorp-tion of mixed H2O:CO2 ices by comparing model and experimental TPD experiments,
TPD experiments of pure ices are performed to determine the binding energiesEi. The other free parameters that are used to optimize the model are the swapping en-ergies swapH
2O´i between H2O molecules and volatilesi and the empirical factor ci used to parameterize the diffusion of volatilesi from the mantle to the surface. These two parameters are determined by performing TPD experiments of binary ice mixtures of H2O:CO2 with different mixing ratios, thicknesses and heating rates and by
compar-ing the output of the model with the experimental trends, i.e., the amount of volatile species that remains trapped in the water ice at temperatures higher than the desorp-tion temperature of the volatile species.
It is important to note that the model does not include the finite pumping speed during experiments. This will affect the derived desorption barriers and these are therefore not meant to replace the ones derived from more detailed pure ice exper-iments in the literature. As long as the pumping rate is constant with temperature, excluding the pumping rate will not affect the determined ice fraction that desorbs at a low temperatures versus the fraction that desorbs with H2O. This is a reasonable
as-sumption above the pure volatile ice desorption temperatures, where cryopumping is no longer efficient. The derivation ofci and
swap
H2O´i should therefore not be affected by
this simplification.
2.3 Experiments
2.3.1 Experimental parameters
The experiments in this study are chosen to simultaneously provide data directly relevant to ice desorption in different astrophysical environments (with different ices) and to construct a proof-of-concept model for ice mixture desorption. The focus is on CO2desorption from H2O ice mixtures, one of the most important ice systems around
protostars, with supporting experiments on CO desorption. While interstellar ices are expected to be complex mixtures, it is still useful to investigate desorption from binary H2O:volatile ice mixtures since the H2O:volatile interactions are expected to dominate
the desorption process in space, both because H2O is the major ice constituent and
be-cause H2O generally forms stronger bonds with itself and with volatiles than volatiles
do. This hypothesis has been further tested by performing TPD experiments of two tertiary H2O:CO2:CO ice mixtures.
The ice thickness and structure in the experiments are chosen to be as similar as possible to the existing observational constraints on interstellar ices. Interstellar ices are estimated to be less than 100 monolayers (ML) thick from the maximum amount of oxygen available for ice formation. The experimentally grown ices are between 10 and 40 ML, since it is only possible to quantify ice thicknesses up to a certain limit (40 ML in our case) using reflection-absorption infrared spectroscopy (Teolis et al. 2007). Infor-mation on ice structure in space is limited, but the lack of a water dangling vibration at 3700 cm´1 suggests a less porous ice than typically produced in the laboratory. We
Section 2.3. Experiments 25
2.3.2 Experimental procedures
All desorption experiments are performed with CRYOPAD. This set-up has been described in detail elsewhere (Fuchs et al. 2006). The set-up consists of an ultra high vacuum (UHV) chamber with a base pressure of „10´10mbar at room temperature.
Ices are grown on a gold-coated substrate situated at the center of the chamber that can be cooled down to 16K by a close cycle He cryostat. The relative sample tem-perature is controlled with a precision of0.1K using a resistive heating element and a temperature control unit. The absolute sample temperature is given with a2K uncer-tainty. The system temperature is monitored with two thermocouples, one mounted on the substrate face, the other on the heater element.
A fourier transform spectrometer is used for reflection-absorption infrared spec-troscopy (FT-RAIRS) to record vibrational absorption signatures of molecules con-densed on the gold surface. The spectrometer covers 700´4000cm´1 with a typical
resolution of 1cm´1 and an averaged spectrum consists of a total of 256 scans. Ice
evaporation is induced by linear heating of the substrate (and ice) in TPD experiments. RAIR spectra are acquired simultaneously to monitor the ice composition during the TPD. A quadrupole mass spectrometer (QMS) is positioned at4cm, facing the ice sam-ple to continuously analyze the gas-phase composition mass-selectively and to obtain desorption curves of evaporating molecules during the TPD experiments.
Mixtures and pure gas samples are prepared from 13CO
2 (Indugas, min 99% of 13C), CO
2 (Praxair, 99% purity), 13CO (Cambridge Isotope Laboratories, 98% purity)
and from gaseous water at the saturation pressure of a de-ionized liquid sample at room temperature. The de-ionized water is purified by three freeze-pump-thaw cycles. The samples are prepared separately, then injected in the chamber via an inlet pipe directed along the normal of the gold surface. In all gas samples, an isotopologue of CO was used to separate the QMS signal from background CO and N2. Similarly, an
isotopologue of CO2 was used to minimize the overlap in RAIR spectra between CO2
ice and atmospheric CO2 gas outside the UHV chamber.
H2O and CO2ice amounts are determined directly using the RAIRS band strengths
provided by ¨Oberg et al. (2009,a) for CRYOPAD. From these measurements the abso-lute ice thicknesses are known within 50%. The relative ice abundance uncertainties are smaller,„20%, and due to small band strength variations with ice composition and temperature.
Table 2.1 lists the set of TPD experiments performed to calibrate and test the desorp-tion model presented in Secdesorp-tion 2.2. The TPD experiments begin with the deposidesorp-tion of pure or mixed ice samples on the gold substrate cooled to16´19K, and continue with a slow heating of the ices at a constant specified rate until the desorption of the molecules from the surface is complete. The evaporated gas phase molecules are con-tinuously monitored by the QMS. RAIR spectra of the ices are acquired before heating to determine ice thicknesses and mixture ratios as described above. Spectra are also recorded during the warm-up as a second independent way to determine the ice com-position and to monitor eventual structure modifications.
species present in the background for each mass channel. Absolute yields cannot be di-rectly obtained by the QMS since it is situated away from the ice sample (4cm) and thus some of the desorbing molecules may get pumped away before detection. All QMS desorption rate curves are therefore normalized in such a way that the time-integrated desorption rate from the various species corresponds to their infrared spectrally mea-sured ice abundance at the beginning of each experiment.
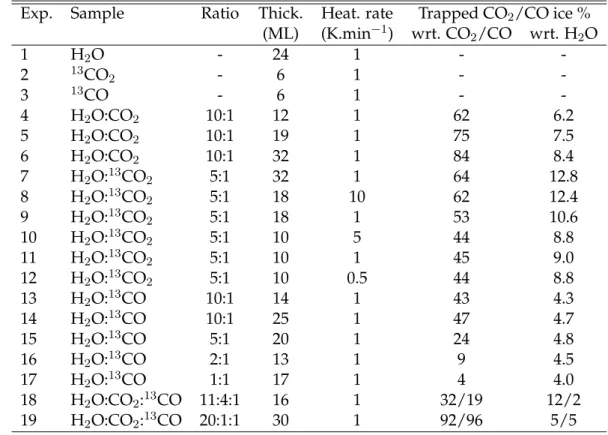
Table 2.1: Overview of the desorption experiments
Exp. Sample Ratio Thick. Heat. rate Trapped CO2/CO ice %
(ML) (K.min´1) wrt. CO
2/CO wrt. H2O
1 H2O - 24 1 -
-2 13CO2 - 6 1 -
-3 13CO - 6 1 -
-4 H2O:CO2 10:1 12 1 62 6.2
5 H2O:CO2 10:1 19 1 75 7.5
6 H2O:CO2 10:1 32 1 84 8.4
7 H2O:13CO2 5:1 32 1 64 12.8
8 H2O:13CO2 5:1 18 10 62 12.4
9 H2O:13CO2 5:1 18 1 53 10.6
10 H2O:13CO2 5:1 10 5 44 8.8
11 H2O:13CO2 5:1 10 1 45 9.0
12 H2O:13CO2 5:1 10 0.5 44 8.8
13 H2O:13CO 10:1 14 1 43 4.3
14 H2O:13CO 10:1 25 1 47 4.7
15 H2O:13CO 5:1 20 1 24 4.8
16 H2O:13CO 2:1 13 1 9 4.5
17 H2O:13CO 1:1 17 1 4 4.0
18 H2O:CO2:13CO 11:4:1 16 1 32/19 12/2
19 H2O:CO2:13CO 20:1:1 30 1 92/96 5/5
2.4 Experimental analysis
2.4.1 Complementarity of RAIRS and QMS
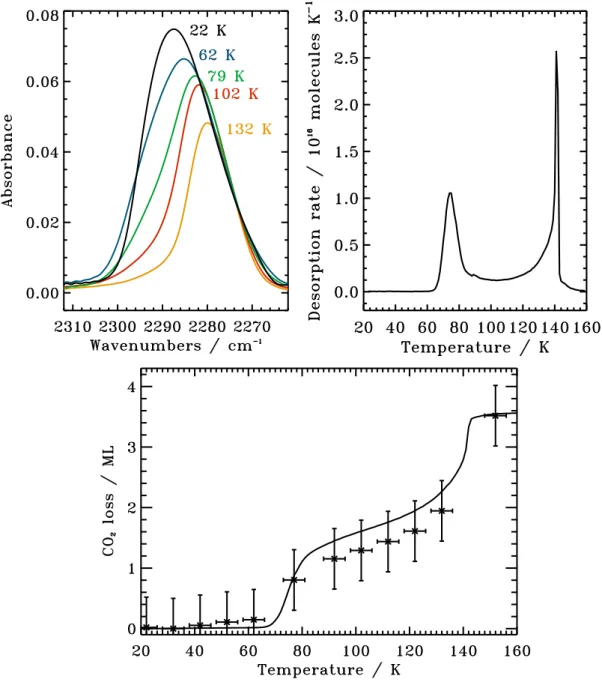
Figure 2.2 illustrates the agreement between desorption curves derived from QMS and RAIRS data for CO2 in a 5:1 water-dominated H2O:CO2 ice, 18 ML thick and
heated at 1 K.min´1 rate (Exp. 11). The upper left panel in Fig. 2.2 shows the CO 2
stretching band recorded at different temperatures during warm-up: after ice deposi-tion at 22K, at 62 K where segregation is known to be efficient ( ¨Oberg et al. 2009b), during the first ice desorption peak around 79 K, in the temperature interval between pure CO2 desorption and H2O desorption, and during desorption of the trapped CO2.
The right panel shows the desorption rate of CO2 derived from the same experiment
by mass spectrometry. The bottom panel presents the cumulative ice loss versus tem-perature for this experiment, obtained both by integrating the CO2 mass signal with
spe-Section 2.4. Experimental analysis 27
Figure 2.2: The upper left panel presents the infrared CO2stretching features at specific
temperatures during the warm-up of 18 ML of a H2O:CO2 5:1 ice heated at 1 K.min´1.
The right upper panel presents the desorption rate of CO2for the same experiment
ob-tained by mass spectrometry. The bottom panel shows the ice loss for this experiment obtained by infrared measurements (crosses) and mass spectrometry (solid line).
Figure 2.2 also shows that there is evidence for some ice loss between the two main desorption peaks. The cumulative QMS and infrared spectroscopy signals match each other at these intermediate temperatures, which points to that the measurements trace actual ice desorption in between the pure ice desorption event and the desorption of trapped volatiles. The implications of this ice desorption process is discussed below, but it is important to note that this is not incorporated into the model framework and this may be a limitation to step-wise desorption models, whether using our parame-terization or any of the previously published ones. Quantifying this process would re-quire an additional set of experiments where the mass spectrometer is mounted closer to the substrate to allow for the detection of very low desorption rates.
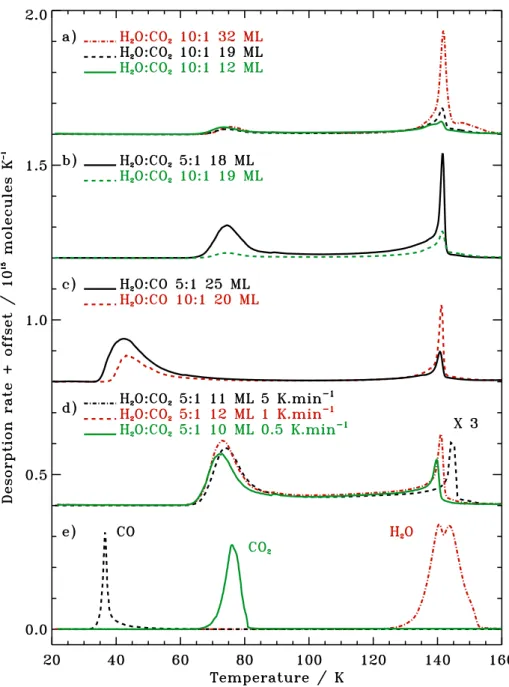
2.4.2 Desorption trends
Figure 2.3 shows the desorption of CO2 from H2O:CO2 ice mixtures of different
thicknesses (a), with different CO2concentrations (b), and heated at different rates (d).
In addition there are two CO TPD curves from H2O:CO mixtures with different CO
concentrations (c). For reference, Fig. 2.3e) presents the TPD curves of pure CO, CO2,
and H2O ice heated at 1 K min´1. The fraction of trapped volatile is obtained by
in-tegrating the QMS signal for temperatures above 110K and dividing it by the QMS signal integrated over the entire 20–160 K range. The chosen temperature of 110 K is well below the onset of the second desorption peak and the volatiles that desorbed during the first CO2 or CO desorption peak are (almost) entirely pumped, though as
discussed above there seems to be a low-level type of desorption occurring between the main desorption peaks. Whether due to finite pumping or actual desorption this results in a 10–20% uncertainty in the determination of the trapped fraction, i.e., the choice of temperature integration limits affects the estimated amount of trapped ice by ă 20%. The trapped percentage of volatiles in each experiment, defined with re-spect to the initial volatile ice content, is reported in the second last column of Table 2.1.The last column of Table 2.1 presents the trapped abundance of volatiles species with respect to the initial H2O abundance. This value is less variable compared to the
trapped amount of CO/CO2 with respect to the initial CO/CO2abundance presented
in the preceding column. Both Table 2.1 and Fig. 2.3 show that for CO2 and CO the
percentage of trapped volatile species in the H2O ice is highly dependent on the
exper-imental conditions; the CO2 trapping fraction varies between 44 and 84% with respect
to the initial volatile content. In the following subsections, we report and discuss these dependencies.
Thickness dependency
Figure 2.3a presents the desorption of a H2O:CO210:1 ice mixture for different
ini-tial ice thicknesses and shows that the amount of trapped CO2 (desorption around
140 K) increases with ice thickness. In contrast the amount of CO2 desorbing around
70 K is independent of ice thickness in the experimentally investigated range. This im-plies that only CO2 molecules from the top part of the ice are available for desorption
at the CO2 desorption temperature. This can be explained by either a highly porous
Section 2.4. Experimental analysis 29
Figure 2.3: Experimental CO and CO2 desorption curves a-d) during warm up of ice
mixtures (offset for visibility) together with pure CO, CO2 and H2O ice TPD curves e).
The heating rate is 1 K.min´1 except for when specified otherwise in a), the total ice
thickness and mixing ratio are listed in for each experiment.
layers of the mantle phase to the surface. In both cases the surface is eventually totally saturated by water molecules, trapping the rest of the volatiles in the ice mantle.
Mixing ratio dependency