PHYSICIAN EVALUATION AMONG DENTAL PATIENTS WHO SCREEN HIGH-RISK FOR SLEEP APNEA
Kristin D. Dillow
A thesis submitted to the faculty at the University of North Carolina at Chapel Hill in partial fulfillment of the requirements for the degree of Master of Science in the Department of
Dental Ecology (Dental Hygiene Education).
Chapel Hill 2014
ABSTRACT
Kristin D. Dillow: Physician evaluation among dental patients who screen high-risk for sleep apnea.
(Under the direction of Gregory K. Essick)
TABLE OF CONTENTS
LIST OF TABLES………...……….vi
LIST OF FIGURES………...………..vii
LIST OF ABBREVIATIONS……….…...……viii
CHAPTER 1. Introduction………...1
2. Review of the Literature………...3
2.1 Classifications of Sleep Apnea………....3
2.2 Obstructive Sleep Apnea……….………...3
2.3 Polysomnography………4
2.4 STOP: A Screening Questionnaire………..5
2.5 STOP-Bang………..5
2.6 Epworth Sleepiness Scale………6
2.7 Pulse Oximetry………6
2.8 Significance to Dental Professionals………...8
2.9 Study Purpose………..9
3. Introduction and Review of the Literature………..………10
4. Materials and Methods………12
4.1 Study Population………12
4.2 Data Collection………..12
4.4 Follow-Up Procedures………...………13
4.5 Statistical Analysis……….…14
5. Results……….16
5.1 Feasibility of Screening……….16
5.2 Demographics of Subjects who Screened High-Risk………....16
5.3 Concordance Among Screening Measures………17
5.4 Pulse Oximetry Results………..18
5.5 Calculation of Risk Status Based on STOP-Bang………...19
5.6 Physician-Consulting Behavior………...………..19
6. Discussion………...20
6.1 Physician Follow-Up in Other Studies...………...…….20
6.2 Factors Associated with High-Risk……….………...……...21
6.3 Implication to Screening Recommendations………...……..23
6.4 Representativeness of the Study Sample………...………24
6.5 OSA Screening in the Dental Practice…………..……….24
7. Conclusion………...………...27
APPENDIX………..35
Appendix A- Screening Questionnaire………35
Appendix B- Instructions for Overnight Pulse Oximetry………....…36
Appendix C- Follow-up Letter to Participants……….37
LIST OF TABLES
Table 1: Percentage of study subjects who screened high-risk for obstructive sleep apnea based on the STOP questionnaire,
pulse oximetry, both instruments, and neither instrument………...30
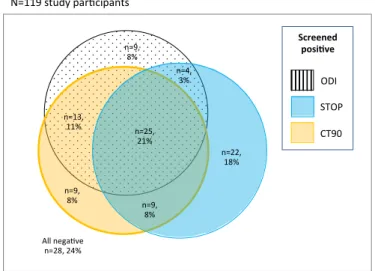
Table 2: Summary statistics for the relationship of CT90 and ODI3
with STOP questionnaire risk categories……….31 Table 3: Prevalence ratios (PR) and 95% confidence limits (CL)
for consulting a physician about obstructive sleep apnea following
OSA risk screening initiated in a dental clinic (n=111)………...32 Supplementary Table 1: Sensitivity and Specificity of STOP and STOP-Bang……….33 Supplementary Table 2: Sensitivity and Specificity of
LIST OF FIGURES
Figures 1A- 1D: Predicted probabilities of screening high risk for OSA.
Probabilities are from a logistic regression model that adjusts for sex and BMI (1A) or sex and age (1B, 1C, 1D). 1A plots probability based on STOP questions and pulse oximeter across age groups. 1B plots probability based on the STOP and pulse oximeter across BMI categories. 1C plots probability based on STOP and the two parameters of pulse oximetry (ODI3, CT90).
1D plots conditional probability of CT90 given low risk on STOP, ODI3 given
low risk on STOP, and ODI3 given high risk on CT90………28
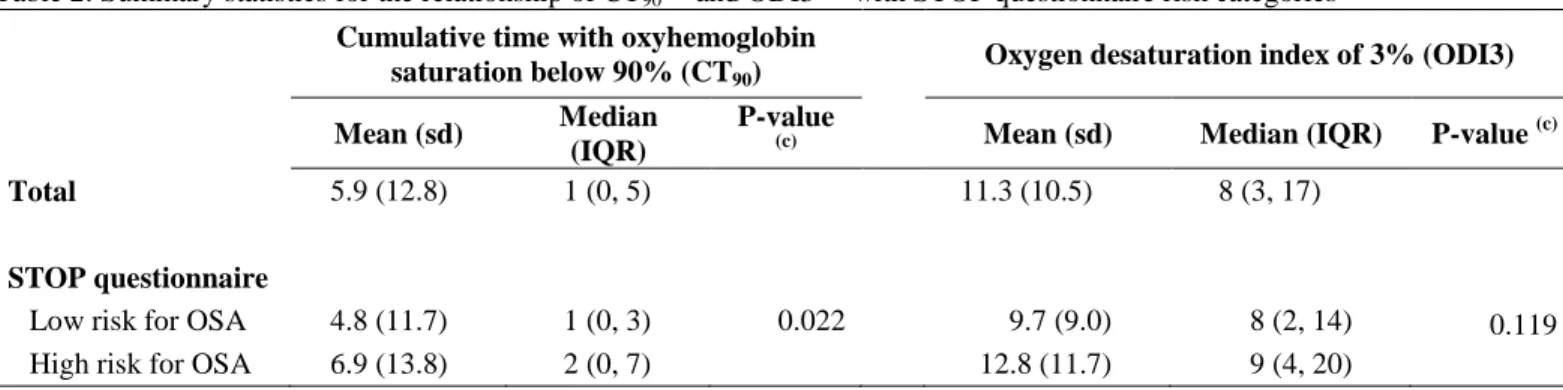
Figure 2: Venn diagram of numbers of subjects who responded high-risk on none or each of the three screening measures,
LIST OF ABBREVIATIONS AHI Apnea-hypopnea index
BMI Body mass index
CT90 Cumulative time spent below 90% saturation
ESS Epworth Sleepiness Scale ODI Oxygen desaturation index
OHS Obesity hypoventilation syndrome OSA Obstructive sleep apnea
PSG Polysomnography
1. INTRODUCTION
Obstructive sleep apnea (OSA) is increasing in prevalence, widely undiagnosed, and a precursor of significant pathology. Marked by a lapse in breathing or a significant reduction of airflow during sleep, moderate OSA is estimated to affect 10% of men and 3% of women aged 30-49 years and 17% and 9% of men and women, respectively, aged 50-70 years.1 Additionally, more than 80% of moderate to severe OSA cases remain undiagnosed.2,3 The percentage of OSA among American adults is steadily increasing with the rising rate of obesity. Young et al. found that obesity is the strongest contributing factor to OSA, which strengthens the assumption that the increasing prevalence of OSA parallels that of obesity.4 OSA is the leading cause of excessive daytime sleepiness and is associated with the development of hypertension,5 cardiovascular disease,6 metabolic syndrome,7 stroke,8 and depression.9 When left untreated, OSA is a significant medical condition that can impair quality of life.
At present, polysomnography (PSG) provides formal diagnosis of sleep apnea; however, insufficient numbers of sleep laboratories and the prohibitive cost of their services may discourage this type of evaluation.10 As disease awareness increases, so does the demand for convenient and economical methods of diagnosing patients with OSA and of screening individuals to identify those at risk for OSA.
questionnaires have been shown to have the highest methodological validity, reasonable accuracy, and simplicity.10 Likewise, home sleep testing devices measuring pulse oximetry provide objective data and often comparable diagnostic outcomes as those yielded with conventional PSG, particularly for patients with more severe disease.11-13
As with many systemic diseases, OSA may have an association with periodontitis. Ahmad et al. found that dental patients who screened high-risk for OSA were four times more likely to have moderate or severe periodontitis than those who screened low-risk (95% CI: 1.5, 11.4).14 Similarly, a study conducted by Gunaratnam et al. suggests that the prevalence of periodontitis is greater in patients with OSA.15 The high prevalence of undiagnosed sleep apnea and its potential relationship with chronic periodontitis suggest that dentists and dental hygienists could provide a valuable service to patients by
incorporating sleep apnea screening into their practice.16 This is especially important for dental patients who do not regularly access general health care. An estimated 23% of adults who visit their dentist regularly do not have contact with a physician.17 By
2. REVIEW OF THE LITERATURE
2.1 Classifications of Sleep Apnea
Sleep apnea is defined by events of complete cessation of breathing (apnea) or a marked reduction in airflow (hypopnea) during sleep.18 Hypopneas result from a decrease of ≥30% in respiratory effort accompanied by ≥4% oxygen desaturation,19 although alternative definitions are often reported in the literature. Apneas and hypopneas that last at least 10 seconds are considered clinically significant. In some individuals, these reductions in airflow may persist for 30-60 seconds.12 Sleep apnea is further classified as central, obstructive, or mixed. Central apneas result from a lack of neural output from the brainstem respiratory centers, which leads to a lack of inspiratory effort.20 In short, the brain temporarily stops sending signals to the muscles that control breathing. Obstructive apneas result from a closure or collapse of the upper airway during sleep, preventing airflow into the lungs. Mixed apneas are a combination of central and obstructive apneas. Mixed apneas typically start out as central; however, the apnea persists after respiratory effort commences due to collapse of the upper airway, resulting in obstruction to airflow.12
2.2 Obstructive Sleep Apnea
daytime sleepiness and is associated with the development of hypertension,5cardiovascular disease,6 metabolic syndrome,7 stroke, and death.8 In addition, OSA is reported to increase depression by at least twofold in patients who suffer from the disease.9
2.3 Polysomnography
In order to determine if a person has sleep apnea, a diagnostic test must be performed. Polysomnography (PSG) is considered the “gold standard” for diagnosing sleep apnea. During the overnight stay in a sleep laboratory, respiratory parameters are measured to determine a person’s apnea-hypopnea index (AHI).19
The AHI, or number of obstructive events per hourof sleep, is the key measure for OSA severity:AHI >5 is interpreted as mild OSA; AHI >15 as moderate OSA; AHI >30 as severe OSA. Although PSG is the formal method of clinically diagnosing sleep apnea, the number of sleep laboratories in the country is insufficient for the increasing population prevalence of the disease.10 Furthermore, the high cost and inconvenience of PSG sleep studies often discourage individuals from seeking this type of evaluation. Recent clinical guidelines suggest unattended home testing, in conjunction with a comprehensive sleep evaluation, is an option for patients with a high pretest probability of moderate to severe apnea when initiation of treatment is urgent and PSG is not readily available.22 The National Institute for Health and Clinical Excellence (NICE) also states moderate to severe OSA can be diagnosed from patient history and a sleep study using oximetry or other monitoring devices unattended in the patient’s home.23
2.4 STOP: A Screening Questionnaire
Reliable screening tools, such as the 4-item STOP questionnaire, are useful in identifying a patient’s probability of having sleep apnea. The STOP questionnaire was originally developed as a pre-surgical screening tool for OSA and represents a simple and efficient method of identifying patients at risk for the disorder.24 The questionnaire, using the acronym STOP, has patients report loud snoring, tiredness during the daytime,
observed gaps in breathing, and a history of high blood pressure. Patients with two or more affirmative responses are classified as high-risk for OSA, while patients with scores of <2 are classified as low-risk. Sensitivity and specificity values for the STOP
questionnaire are summarized in Supplementary Table 1. The study by Chung et al. found sensitivity and specificity of the STOP questionnaire to be 66% and 60%, respectively, for detecting patients with mild OSA.24 The same study also suggests the STOP questionnaire may have a greater sensitivity for detecting patients with moderate and severe forms of OSA, with values of 74% and 80%, respectively.24 Specificity for detecting patients with moderate and severe forms of OSA was estimated to be 53% and 49%, respectively. In comparison with other screening tools, the STOP questionnaire has been shown to have the highest methodological validity and reasonable accuracy when identifying patients at risk for OSA.10
2.5 STOP-Bang
As a continuation of the STOP questionnaire, the STOP-Bang screening method includes additional measures of body mass index (BMI), age, neck circumference, and gender. Clinical characteristics of BMI >35 kg/m2, over 50 years of age, neck
STOP-Bang score of ≥3 is classified high-risk for OSA, while scores of <3 are classified low-risk. Chung et al. estimate that the STOP-Bang has a higher sensitivity than the STOP for
detecting moderate and severe cases of OSA: 93% and 100%, respectively.24 However, the specificity is lower: 43% and 37% for moderate and severe OSA, respectively, resulting in high false negative rate. Therefore, in this research study, we considered an individual at high-risk for OSA if STOP ≥2 in order to achieve a reasonably high level of sensitivity and acceptable level of specificity in detecting moderate or severe cases of OSA.
2.6 Epworth Sleepiness Scale
Excessive daytime sleepiness is a cardinal feature of OSA. The Epworth Sleepiness Scale (ESS) is a screening tool used to measure an individual’s daytime
sleepiness. This 8-item questionnaire asks subjects to rate how likely they are to doze in a variety of daytime situations using the following criteria: 0=would never doze; 1=slight chance of dozing; 2=moderate chance of dozing; 3=high chance of dozing. A score of ≥11 indicates a high risk of excessive daytime sleepiness and a score of <11 is considered low risk. However, Gottlieb et al. found that a score >11 is present in only 35% of patients with severe OSA based on AHI.25Although ESS is not a strong indicator of OSA on its own, it can be helpful in identifying persons at risk when used in conjunction with other methods. In this study, ESS was used to assess the relationship between OSA risk status and self-reported degree of daytime sleepiness.
2.7 Pulse Oximetry
sleep and can detect a fall in SpO2 caused by respiratory events.26 Oxygen saturation levels
and heart rate are recorded simultaneously and the pulse oximetry device can provide the following information: oxygen desaturation index of 2% (ODI2), 3% (ODI3), or 4% (ODI4) and cumulative time spent below 90% oxygen saturation (CT90). ODI refers to the
number of events per hour of 2%, 3%, or 4% or greater decrease in oxygen saturation from the baseline level, typically determined during the first few minutes of recording while the patient is awake. Cooper et al. determined that the sensitivity and specificity of pulse oximetry as a single predictor for identifying OSA was dependent on the AHI, concluding that pulse oximetry is more effective for screening patients with moderate to severe sleep apnea than for milder severity.27 The study found sensitivity was 100% and specificity 95% for patients with an AHI of ≥25 events per hour, but both sensitivity and specificity
decreased as AHI decreased. Other studies reveal a broad range of sensitivity and specificity values.28 Overall, the body of evidence concludes that the combination of a screening questionnaire with pulse oximetry improves the specificity of oximetry as a screening tool for sleep apnea.29Oeverland et al. found ODI3 to be the optimal measurement for determining OSA risk, which resulted in 91% sensitivity and 67% specificity in individuals with at least mild OSA, and 86% and 88% in moderate to severe cases (Supplementary Table 2).30Furthermore, Niijima et al. concluded that a threshold of ODI3 ≥10 reduced the number of undetected OSA due to false negatives.26
Similarly, Nigro et al. noted sensitivity and specificity to be 88% and 94%, respectively, in moderate OSA cases at a threshold of ODI3 >10.5.31The diagnostic usefulness of CT90 ≥1% has also
been evaluated. Gyulay et al. found that CT90 ≥1% identified patients with at least
suggest that oximetry data should be analyzed by calculating both CT90 and ODI in order
to obtain the highest sensitivity and specificity for detecting OSA.32 Therefore, in this research study an individual was considered high-risk for OSA if ODI3 ≥10 events per hour or CT90 ≥1% of the recording period.
2.8 Significance to Dental Professionals
OSA is one of the most common undiagnosed chronic diseases. Dental
professionals represent an important resource for identifying individuals at risk for OSA due to the frequency of examinations. Furthermore, many adults do not visit their primary care physician on a frequent basis. Recent research suggests approximately 23% of the adult population who did not have contact with a physician did see their dentist on a regular basis.17 This relationship gives the dental practitioner the opportunity to closely monitor the patient’s medical health.2
2.9 Study Purpose
OSA is increasing in prevalence, widely undiagnosed, and a precursor of significant pathology.1-9 Collectively, these features point to the salience of OSA screening. Therefore, the purpose of this study was to investigate the feasibility of
3. INTRODUCTION AND REVIEW OF THE LITERATURE
Obstructive sleep apnea (OSA) is increasing in prevalence, widely undiagnosed, and a precursor of significant pathology. Marked by a lapse in breathing or a significant reduction of airflow during sleep, moderate OSA is estimated to affect 10% of men and 3% of women aged 30-49 years and 17% and 9% of men and women, respectively, aged 50-70 years.1 Additionally, more than 80% of moderate to severe OSA cases remain undiagnosed.2,3 The percentage of OSA among American adults is steadily increasing with the rising rate of obesity. Young et al. found that obesity is the strongest contributing factor to OSA, which strengthens the assumption that the increasing prevalence of OSA parallels that of obesity.4 OSA is the leading cause of excessive daytime sleepiness and is associated with the development of hypertension,5 cardiovascular disease,6 metabolic syndrome,7 stroke,8 and depression.9 When left untreated, OSA is a significant medical condition that can impair quality of life.
At present, polysomnography (PSG) provides formal diagnosis of sleep apnea; however, insufficient numbers of sleep laboratories and the prohibitive cost of their services may discourage this type of evaluation.10 As disease awareness increases, so does the demand for convenient and economical methods of diagnosing patients with OSA and of screening individuals to identify those at risk for OSA.
questionnaires have been shown to have the highest methodological validity, reasonable accuracy, and simplicity.10 Likewise, home sleep testing devices measuring pulse oximetry provide objective data and often comparable diagnostic outcomes as those yielded with conventional PSG particularly for patients with more severe disease.11-13
As with many systemic diseases, OSA may have an association with periodontitis. Ahmad et al. found that dental patients who screened high-risk for OSA were four times more likely to have moderate or severe periodontitis than those who screened low-risk (95% CI: 1.5, 11.4).14 Similarly, a study conducted by Gunaratnam et al. suggests that the prevalence of periodontitis is greater in patients with OSA.15 The high prevalence of undiagnosed sleep apnea and its potential relationship with chronic periodontitis suggest that dentists and dental hygienists could provide a valuable service to patients by
incorporating sleep apnea screening into their practice.16 This is especially important for dental patients who do not regularly access general health care. An estimated 23% of adults who visit their dentist regularly do not have contact with a physician.17 By
4. MATERIALS AND METHODS
4.1 Study Population
The setting for this cross-sectional study was a community-based dental practice located in Raleigh, NC, USA. The study population was sampled using a non-probability convenience sampling method where subjects were selected on the basis of their
accessibility and proximity to the investigator.
All patients scheduled for preventive dental care from April through September 2013 received an informational email prior to their scheduled visit that described the study. Upon presenting for their visit, potential subjects were presented with written details of the study and description of the incentive for participation. Participation incentive was a $10 gift card. Interested volunteers aged 18 years or older who were not pregnant and had not previously been diagnosed with OSA were eligible for enrollment. The study was
approved by the Institutional Review Board at the University of North Carolina at Chapel Hill and all subjects gave written informed consent.
4.2 Data Collection
circumference with a tape measure at the location just below the laryngeal prominence and recorded this measurement on the screening questionnaire.
In addition, a portable pulse oximetry device (VirtuOx VPOD-Ultra) for overnight monitoring of SpO2 was issued to each subject. This was accompanied by detailed written recommendations (Appendix B) and verbal instructions to wear the device overnight on a single night while asleep for a minimum of four hours. Subjects were asked to return the completed questionnaire and device to the dental practice in a sealed envelope. A numerical reference number recorded at the top of the screening questionnaire identified subjects. No personal identifying data were included on the study materials.
Questionnaire data were transcribed by hand to a Microsoft Excel spreadsheet, and stored data from the pulse oximeter were uploaded into the device’s web-based computer
program by the investigator.
4.3 Risk Assessment
(1) The validated 4-item STOP screening questions classified subjects high-risk for OSA in the presence of ≥2 of: loud snoring; daytime tiredness; witnessed apnea;
hypertension.24
(2) Consistent with guidelines in the literature, overnight pulse oximetry classified high-risk for OSA as the presence of either: oxyhemoglobin saturation below 90% (CT90)
for ≥1% cumulative recording time; or oxygen desaturation index (ODI3) ≥10 events/hour in which oxyhemoglobin saturation decreased ≥3% from baseline.26,30,32
4.4 Follow-up Procedures
instruments were advised to seek physician evaluation within three months. All subjects were contacted via telephone two weeks after mailing the letter to discuss screening results and inquire about the likelihood of physician consultation. Subjects were phoned again three months later to determine whether or not they had sought evaluation.
4.5 Statistical Analysis
Data from the spreadsheet were imported into Stata 13.1 (StataCorp. 2013. Stata Statistical Software: Release 13. College Station, TX: StataCorp LP) for statistical analysis. To address the study aim, analysis compared the physician-consulting behavior of subjects according to OSA risk status. The binary dependent variable classified these subjects as either having had a physician consultation about the OSA screening results within three months, or not having had a consultation. In univariate analysis examining the relationship of subjects’ characteristics and OSA risk status, Pearson’s chi-square test was used for categorical variables. The two-sample Wilcoxon rank-sum (Mann-Whitney) test for non-parametric continuous variables was used to compare components of the STOP questionnaire with the components of pulse oximetry: CT90 and ODI3. In
5. RESULTS
5.1. Feasibility of Screening
A total of 124 subjects enrolled in the study. All subjects responded to all four STOP questions. A pulse oximetry recording of four or more hours was obtained from 119 (96%) of the subjects. No recording was obtained from one subject and for four subjects, a recording was obtained but it was less than four hours. Because these five subjects did not comply with the instructions for the screening protocol, their data were omitted from analysis. The mean duration of the recordings from the 119 subjects who completed the screening protocol as instructed was 7.0 hours (sd: 1.5 hours).
5.2 Demographics of Subjects who Screened High-Risk
Of the 119 subjects, the mean age was 51 years, 47.9% was male, and 24.4% was obese. Fifty percent (50.4%) screened high-risk based on the STOP questionnaire, 58% screened high-risk based on pulse oximetry, and 31.9% screened high-risk on both
instruments. Seventy-seven percent (76.5%) of subjects screened high-risk on at least one instrument.
Men were significantly more likely than women to screen high-risk on the STOP questions (Table 1). An inverted U-shaped relationship observed between age and OSA risk using the STOP questions differed notably from the monotonic increase in OSA risk across age groups observed for pulse oximetry (Table 1, Figure 1A). However, the
pulse oximetry (CT90 and ODI3) were assessed individually across BMI categories, both
parameters were closely aligned (± 0.2) with probabilities determined by the STOP (Figure 1C).
Subjects whose neck circumference exceeded established thresholds for risk of OSA were significantly more likely to screen high-risk based on the STOP questions but not based on pulse oximetry (Table 1). Overall, 17.7% of adults reported excessive daytime sleepiness, a cardinal symptom of OSA. Yet no significant relationship was observed between daytime sleepiness and risk for OSA on either instrument (Table 1).
5.3 Concordance Among Screening Measures
The STOP questionnaire identified the highest percentage of patients at high-risk (50%) followed by the CT90 parameter (47%) and then the ODI3 parameter (43%; Figure
2). There was greater dissimilarity than similarity in the screening results from the instruments. Specifically, of those subjects who screened high-risk on at least one instrument (n=91; 76.5% of total), only 42% screened high-risk on both the STOP and pulse oximetry; whereas, 24% screened high-risk on the STOP alone and 34% on oximetry alone. Of subjects who screened high-risk on pulse oximetry (n= 69), there was
dissimilarity in the results from the two oximetry parameters. Only 55% screened high-risk on both CT90 and ODI3; whereas, 26% screened high-risk on the CT90 parameter
alone, and 19% of subjects screened high-risk on the ODI3 parameter alone. Of the total number of subjects (n=119), only 21% (n=25) screened high-risk on the STOP
questionnaire and both sleep parameters assessed by pulse oximetry.
Likewise, 37% (n=22) of subjects who were low-risk on the STOP were high-risk on the ODI3 measure. Being overweight or obese increased the likelihood of screening high-risk on the oximetry parameters for subjects who screened low-risk on the STOP (Figure 1D). To illustrate, for normal weight adults who screened low-risk based on the STOP
questionnaire, the probability of screening high-risk based on CT90 and ODI3
approximated 0.30. The probabilities were higher and similar for obese I adults, approximating 0.8. That is, an obese adult who screened low-risk on the STOP questionnaire still had an 80% chance of screening high-risk on either pulse oximetry parameter. Subjects in the obese II/III category (n=8) had a 50% chance of screening high-risk on the CT90 given low-risk based on STOP questions; however, no subjects in this
category were identified at risk based on the ODI3 parameter alone.
Whether subjects who screened high-risk on the CT90 also screened high-risk on
the ODI3 sleep parameter was also determined, in part, by BMI. For obese adults who screened high-risk based on the CT90 parameter, the probability of also screening high-risk
based on ODI3 approximated 0.8 (Figure 1D). However, the probability was lower for normal weight adults, approximating 0.4. That is, normal weight adults who screened high-risk on the CT90 parameter had only half the likelihood of also screening high-risk on
the ODI3 parameter compared to subjects who were obese.
5.4 Pulse Oximetry Results
Consistent with the high percentage of subjects who screened high-risk on pulse oximetry (58%), the mean values of CT90 and ODI3 were substantially above zero and the
respectively. A greater cumulative time with oxyhemoglobin saturation below 90% (CT90)
tended to be associated with high-risk for OSA based on the STOP questionnaire (P=0.022, Table 2).
5.5 Calculation of Risk Status Based on the STOP-Bang
Although the STOP-Bang questionnaire was not used to advise subjects on their risk for OSA, it was determined that 80 subjects (67%) were at high-risk based on this instrument. As such, the STOP-Bang identified 17% of the subjects at high-risk who were not identified by the STOP alone.
5.6 Physician-Consulting Behavior
Physician consultation information was obtained from 111 of the 119 subjects (93.3%). Of those who screened high-risk for OSA by any instrument and were advised to consult with their physician about their risk of sleep apnea, 47.1% (n=40) sought physician evaluation within three months of screening. Of the 20 subjects at risk based on STOP questions alone, seven (35.0%) sought physician consultation. On the other hand, of the 30 subjects screening at risk based on pulse oximetry alone, 43.3% (n=13) consulted their physician.
6. DISCUSSION
This study sought to investigate the feasibility of OSA screening in a dental practice setting, and to examine patient response to a recommendation for physician evaluation. Overall, 47.1 % (n=40) of individuals who screened high-risk for OSA on either instrument sought physician evaluation. Hence, screening motivated almost half of those at elevated risk for OSA to consult a physician. Although it was expected that subjects who screened high-risk on both questionnaire and pulse oximetry would be more likely to seek evaluation than those who screened high-risk on one measure alone, this finding was not supported by the current study. Rather, subjects were just as likely to seek evaluation when screened high-risk on one instrument versus both. However, it remains unknown if similar results would have been obtained if only one instrument had been used with separate groups of subjects.
6.1 Physician Follow-Up in Other Studies
account for those patients who followed-up after the 3-month period, which may result in a response rate comparable to hypertension screening over a 3-year period.
An objective of Healthy People 2020 is to “increase the proportion of persons with symptoms of obstructive sleep apnea who seek medical evaluation” to 28%.36 Based on the 2005-2006 and 2007-2008 National Health and Nutrition Examination Survey cycles, 25.5% of patients with symptoms seek medical evaluation. Thus, it is encouraging that a substantially higher percentage of individuals, about 35%, sought medical evaluation when made aware of symptoms of OSA through screening administered by the dental office.
6.2 Factors Associated with High-Risk
reasons for the gender difference, men tend to have higher prevalence of OSA than women.
The relationship of OSA risk and age differed between the STOP questionnaire and pulse oximetry. The probability of screening high-risk based on STOP questions alone increased with age until approximately 55 years of age and then decreased. Individuals aged 45-54 had approximately 65% chance of screening high-risk for OSA compared to 50% in subjects 55-64 years old and 45% of subjects 65 and older (Fig. 1A). This result follows a similar trend reported by Young et al. which suggests prevalence of OSA may not continually increase with age.37 The finding suggests that age may not be a strong risk factor for OSA after the middle age or that the survival of individuals is poorer in older individuals who are not treated. While probability of risk based on STOP questions did not consistently increase with age, OSA risk based on pulse oximetry followed a
monotonic increase across all age groups, suggesting that factors other than the presence of OSA may have contributed to these positive screening results in the oldest individuals studied.
Oeverland et al. report optimal agreement between PSG and pulse oximetry based on the ODI3 in identifying individuals with OSA.30 Although both sleep parameters from the oximetry in the present study identified subjects at risk who were not identified by the STOP questionnaire, positive results on CT90 and ODI3 were not in strong concordance:
Only about half of the patients who screened risk on one measure also screened high-risk on the other. In addition, CT90 identified a greater percentage (7% more) of the
The dependency of high-risk status based on the oximetry parameters on BMI suggests their potential relationship with obesity hypoventilation syndrome (OHS). OHS, a form of sleep disordered breathing, is defined by excessively slow or shallow breathing resulting from nighttime hypoxia.41 Therefore, high-risk status based on CT90 could reflect OHS in
overweight subjects. This could also account for the high percentage of subjects (58%) that screened high-risk on one or both pulse oximetry parameters in the present study.
6.3 Implication to Screening Recommendations
The concurrent administration of two screening instruments yielded a large pool of subjects at risk for OSA. Specifically, 77% screened high-risk for OSA on at least one instrument. This percentage exceeds national prevalence estimates almost fourfold for mild or more severe OSA in the adult population.1, 37 Clearly this protocol is unsuitable for screening in a dental practice as its limited capacity to identify those without disease places additional burden on the healthcare system, while misdirecting scarce healthcare resources away from people with genuine medical need. Concurrent administration of three
screening measures increases sensitivity at the expense of specificity. These values can be predicted from the sensitivities and specificities of the individual measures and
approximate 0.10 and 0.33, respectively, for detecting moderate to severe OSA using the protocol of this study.42
found at high-risk using dual administration (Figure 2). This percentage is notably lower than that from use of any of the three screening measures individually. The predicted sensitivity and specificity of the sequential protocol both approximate 0.74 for detecting moderate to severe OSA.
An alternative sequential protocol is to screen subjects first with the STOP-Bang questionnaire, then administer pulse oximetry to only those individuals who screened positive. Based on the available estimates published in the literature, the predicted sensitivity is 0.92 and specificity is 0.69 for detecting moderate to severe OSA using this protocol. Although the STOP-Bang identifies a high proportion of false high-risk cases, the subsequent administration of pulse oximetry to those who screen high-risk would eliminate many of these from unnecessary physician referral.
6.4 Representativeness of the Study Sample
The study population was comprised of 124 dental patients selected by non-probability sampling from a community-based dental practice. Of these, 119 provided adequate data for analysis. Self-selection bias is highly likely. For example, only subjects who perceived themselves at risk were motivated to participate in the study. Alternatively, only those patients who had received care from the investigator dental hygienist were prompted to volunteer for screening. However, such bias is not unique to this study.
6.5 OSA Screening in the Dental Practice
valuable screening tool in busy clinical settings.24 Further, the mnemonics STOP and STOP-Bang may serve as a useful reminder to clinicians when utilizing the
questionnaires.24 The pulse oximetry device used in the current study was also well
accepted among patients for its ease of use. Simple written instructions guided patients on the correct placement of the finger probe and powering the device on and off. Moreover, patients reported the device was comfortable to wear, and 96% (n=119) were able to wear the oximeter for the recommended minimum of four hours during sleep. Portable pulse oximetry devices offer some advantage to more elaborate home sleep testing devices when determining individuals at risk for OSA. For instance, portable pulse oximeters typically require fewer electrode or signal leads and are less costly than traditional type III home sleep testing devices.11
The potential value of OSA screening in dental practices has been noted in only a few studies. In Levendowski et al., 67% of men and 28% of women were predicted to be at risk for at least mild OSA by the Apnea Risk Evaluation System (ARES™).16 The results were similar to the current study, which predicted 61% and 40% of men and women, respectively, to be at high risk for OSA by the STOP questionnaire. Moreover, the previous study found a high concordance between predicted risk of OSA by
questionnaire and the degree of OSA determined by overnight sleep study.16 This finding suggests that dental practitioners can provide a valuable service to patients by
incorporating OSA screening into practice.
Screening for undiagnosed medical conditions in the dental office has been
million over a one-year period.44 The same study suggests that oral health professionals can play a role in detecting chronic disease such as diabetes and hypertension, which have also been linked to OSA. For this reason, OSA screening in the dental office can not only lead to early detection of the disease, but may also result in substantial health care savings.
7. Conclusion
The findings of this study have implications for the establishment of a protocol for OSA screening in the dental office. The simplicity of the screening instruments makes it feasible for dental practitioners to incorporate into clinical practice. Although the
Figures 1A to 1D depict predicted probabilities of screening high risk for OSA. Probabilities are from a logistic regression model that adjusts for sex and BMI (1A) or sex and age (1B, 1C, 1D). 1A plots probability based on STOP questions and pulse oximeter across age groups. 1B plots probability based on the STOP and pulse oximeter across BMI categories. 1C plots probability based on STOP and the two parameters of pulse oximetry (ODI, CT90). 1D plots conditional probability of CT90 given low risk on STOP, ODI given low risk on STOP, and ODI given high risk on CT90.
<35 35-44 45-54 55-64 65 0.0 0.2 0.4 0.6 0.8 1.0 STOP questionnaire Pulse oximeter Screening instrument [A] Pr o b ab ili ty ( s. e .) o f sc re e n in g h ig h r is k o f O SA
Normal Overweight Obese I Obese II/III 0.0 0.2 0.4 0.6 0.8 1.0 STOP questionnaire Pulse oximeter Screening instrument [B] Pr o b ab ili ty ( s. e .) o f sc re e n in g h ig h r is k o f O SA
Normal Overweight Obese I Obese II/III 0.0 0.2 0.4 0.6 0.8 1.0 STOP questionnaire
Cumulative time <90% 02 saturation
3% oxygen desaturation index
[C] Pr o b ab ili ty ( s. e .) o f sc re e n in g h ig h r is k o f O SA
Normal Overweight Obese I Obese II/III 0.0 0.2 0.4 0.6 0.8 1.0
CT<90 given low risk based on STOP ODI3 given low risk based on STOP ODI3 given high risk based on CT<90
Figure 2: Venn diagram of numbers of subjects who responded at high risk on none or each of the three screening measures, alone or in combination.
CT90 ODI
Screened posi ve N=119 study par cipants
All nega ve n=28, 24%
n=13, 11%
n=9, 8%
n=22, 18% n=4,
3%
n=25, 21% n=9,
8%
STOP
Table 1: Percentage of study subjects (a) who screened high-risk for OSA based on the STOP questionnaire (b), pulse oximetry (b), both instruments and neither instrument. N (%) STOP questionnaire (c)
P-value Pulse
oximetry (d) P-value
Both
instruments P-value
Neither
instrument P-value
Total 119 (100.0) 50.4 58.0 31.9 23.5
Sex
Female 62 (52.1) 40.3 0.022 53.2 0.273 25.8 0.135 32.3 0.019
Male 57 (47.9) 61.4 63.2 38.6 14.0
Age (years)
<35 20 (16.8) 25.0 0.041 10.0 <0.001 5.0 0.005 70.0 <0.001
35–44 23 (19.3) 56.5 34.8 17.4 26.1
45–54 24 (20.2) 66.7 50.0 37.5 20.8
55–64 27 (22.7) 59.3 85.2 51.9 7.4
≥65 25 (21.0) 40.0 96.0 40.0 4.0
Body mass index (kg/m2) (e)
Normal (18.5-24.9) 47 (39.5) 34.0 0.010 51.1 0.059 19.2 0.012 34.0 0.023
Overweight (25.0-29.9) 43 (36.1) 53.5 51.2 30.2 25.6
Obese Class I (30.0-34.9) 21 (17.7) 76.2 76.2 57.1 4.8
Obese Class II/III (≥35.0) 8 (6.7) 62.5 87.5 50.0 0.0
Neck circumference (cm) (f)
Low risk (<40) 60 (50.4) 33.3 <0.001 50.0 0.075 18.3 0.001 35.0 0.003
High risk (≥40) 59 (49.6) 67.8 66.1 45.8 11.9
Excessive daytime sleepiness (g)
No excess sleepiness (≤10) 98 (82.4) 49.0 0.497 60.2 0.289 31.6 0.879 22.5 0.548
Excessive sleepiness (>10) 21 (17.7) 57.1 47.6 33.3 28.6
(a) Values are row percentages. The percentage of subjects who screened at low risk for OSA according to each screening device is not reported.
(b) These are not mutually exclusivecategories
(c) Classifies high risk for obstructive sleep apnea (OSA) as the presence of ≥2 of: loud snoring; daytime tiredness; witnessed apnea; hypertension
(d) Classifies high risk for OSA as cumulative percentage of recording time with oxyhemoglobin saturation below 90% (CT
90) and/or the oxygen desaturation index (ODI) defined as ≥10 events per hour in which the oxyhemoglobin saturation is decreased by ≥3% from baseline
Table 2: Summary statistics for the relationship of CT90 (a) and ODI3 (b) with STOP questionnaire risk categories
Cumulative time with oxyhemoglobin
saturation below 90% (CT90)
Oxygen desaturation index of 3% (ODI3)
Mean (sd) Median
(IQR)
P-value
(c) Mean (sd) Median (IQR) P-value (c)
Total 5.9 (12.8) 1 (0, 5) 11.3 (10.5) 8 (3, 17)
STOP questionnaire
Low risk for OSA 4.8 (11.7) 1 (0, 3) 0.022 9.7 (9.0) 8 (2, 14) 0.119
High risk for OSA 6.9 (13.8) 2 (0, 7) 12.8 (11.7) 9 (4, 20)
(a) Cumulative percentage of recording time with oxyhemoglobin saturation below 90%
(b) Number of events per hour in which the oxyhemoglobin saturation is decreased by ≥3% from baseline
Table 3: Prevalence ratios (PR) and 95% confidence limits (CL) for consulting a physician about obstructive sleep apnea following OSA risk screening initiated in a dental clinic (n=111)
PR 95% CL for PR P-value
Low risk for OSA on both instruments 0.19 0.04, 0.95 0.043
High risk on STOP, low risk on pulse oximetry [referent]
High risk on pulse oximetry, low risk on STOP 1.42 0.51, 3.94 0.502
High risk for OSA on both screening instruments 1.91 0.73, 4.99 0.188
Age per decade 0.91 0.70, 1.19 0.487
Female sex [referent]
Male sex 0.72 0.39, 1.33 0.287
Body mass index 0.99 0.94, 1.05 0.856
Supplementary Table 1: Sensitivity and specificity of STOP and STOP-Bang22
Sensitivity (%) Specificity (%) AHI >5
STOP 65.6 60.0
STOP-Bang 83.6 56.4
AHI >15
STOP 74.3 53.3
STOP-Bang 92.9 43.0
AHI >30
STOP 79.5 48.6
STOP-Bang 100.0 37.0
AHI= apnea-hypopnea index
STOP= snoring, tiredness, observed apnea, and high blood pressure
Supplementary Table 2: Sensitivity and specificity of the Oxygen Desaturation Index (ODI)28
Sensitivity (%) Specificity (%) AHI >5
ODI3 0.91 0.67
ODI4 0.73 1.00
AHI >15
ODI3 0.86 0.88
ODI4 0.64 1.00
AHI= apnea-hypopnea index
APPENDIX A- SCREENING QUESTIONNAIRE
SLEEP APNEA SCREENING QUESTIONNAIRE Participant #______
DATE: __________ GENDER (M/F): __________ AGE: __________ WEIGHT: _________ lbs
HEIGHT: ______ feet ______ inches NECK CIRCUMFERENCE: _________ inches
Answer No or Yes to the following four questions by checking the box that applies.
Do you snore loudly (louder than talking or loud enough to be heard through closed doors)?
No Yes
0 1
Do you often feel tired, fatigued, or sleepy during the daytime? No0 Yes1
Has anyone observed you stop breathing during your sleep? No0 Yes1
Do you have, or are you being treated for, high blood pressure? No0 Yes1
Check the box that describes how likely are you to doze off or fall asleep in the following situations, in contrast to feeling just tired. This refers to your usual way of life in recent times. Even if you have not done some of these things recently, try to work out how they would have affected you.
Sitting and reading
Never doze Slight chance of dozing Moderate chance of dozing High chance of dozing
0 1 2 3
Watching television Never doze Slight chance of dozing Moderate chance of dozing High chance of dozing
0 1 2 3
Sitting inactive in a public place (e.g. a theater or a meeting) Never doze Slight chance of dozing Moderate chance of dozing High chance of dozing
0 1 2 3
As a passenger in a car for an hour without a break Never doze Slight chance of dozing Moderate chance of dozing High chance of dozing
0 1 2 3
Lying down to rest in the afternoon
Never doze Slight chance of dozing Moderate chance of dozing High chance of dozing
0 1 2 3
Sitting and talking to someone
Never doze Slight chance of dozing Moderate chance of dozing High chance of dozing
0 1 2 3
Sitting quietly after lunch when you’ve had no alcohol Never doze Slight chance of dozing Moderate chance of dozing High chance of dozing
0 1 2 3
In a car, while stopped for a few minutes in traffic Never doze Slight chance of dozing Moderate chance of dozing High chance of dozing
APPENDIX C- FOLLOW-UP LETTER TO PARTICIPANTS
(Date)
Dear (participant),
This letter is to inform you of the results from your recent sleep apnea screening. Our screening methods are not meant to diagnose, but rather to inform you of your risk for having sleep apnea. Your results indicated the following:
(High or Low) risk based on the validated screening questionnaire
(High or Low) risk based on overnight pulse oximetry
The only way to clinically diagnose and treat sleep apnea is through a laboratory sleep study; therefore, we suggest you discuss these results with your primary physician for further evaluation. You should expect a phone call from us within the next two weeks to answer any questions you may have.
Thank you for your participation in this study.
Sincerely,
Kristin Dillow, RDH
Master’s Candidate in Dental Hygiene Education University of North Carolina at Chapel Hill School of Dentistry
REFERENCES
1. Peppard PE, Young T, Barnet JH, Palta M, Hagen EW, Hia KM. Increased prevalence of sleep-disordered breathing in adults. Am J Epidemiol 2013 doi: 10.1093/aje/kws342. 2. Barsh L. The recognition and management of sleep-breathing disorders: a mandate for
dentistry. Sleep Breath 2009;13(1):1-2.
3. Young T, Evans L, Finn L, Palta M. Estimation of the clinically diagnosed proportion of sleep apnea syndrome in middle-aged me and women. Sleep 1997;20(9):705-6.
4. Young P, Peppard TE, Taheri S. Excess weight and sleep disordered breathing. J Appl Physiol 2005;99(4):1592-9.
5. Ohayon MM, Guilleminault C, Priest RG, Zulley J, Smime S. Is sleep-disordered breathing an independent risk factor for hypertension in the general population? J Psychosom Res 2000;48(6):593-601.
6. Somers VK, White DP, Amin R, et al. Sleep apnea and cardiovascular disease: expert consensus document. J Am Coll Cardiol 2008;52(8):686-717.
7. Punjabi NM, Sorkin JD, Katzel LI, Goldberg AP, Schwartz AR, Smith PL. Sleep disordered breathing and insulin resistance in middle-aged and overweight men. Am J Respir Crit Care Med 2002;165(5):677-82.
8. Yaggi HK, Concato J, Kernan WN, Lichtman JH, Brass LM, Mohsenin V. Obstructive sleep apnea as a risk factor for stroke and death. N Engl J Med 2005;353(19):2034-41. 9. Peppard PE, Szklo-Coxe M, Hla KM, Young T. Longitudinal association of sleep-related
breathing disorder and depression. Arch Intern Med 2006;166(16):1709-15.
10.Abrishami A, Khajehdehi A, Chung F. A systematic review of screening questionnaires for obstructive sleep apnea. Can J Anesth/J Can Anesth 2010;57(5):423-38.
11.Barak-Shinar D, Amos Y, Bogan RK. Sleep disordered breathing analysis in a general population using standard pulse oximeter signals. Sleep Breath 2013;17(3):1109-15. 12.Chen H, Lowe AA, Bai Y, Hamilton P, Fleetham JA, Almeida FR. Evaluation of a
portable recording device (ApneaLink) for case selection of obstructive sleep apnea.
Sleep Breath 2009; 13(3):213-9.
13.Polese JF, Santos-Silva R, de Oliveira Ferrari PM, Sartori DE, Tufik S, Bittencourt L. Is portable monitoring for diagnosing obstructive sleep apnea syndrome suitable in elderly population? Sleep Breath 2013;17(2):679-86.
15.Gunaratnam K, Taylor B, Curtis B, Cistulli P. Obstructive sleep apnoea and periodontitis: a novel association? Sleep Breath 2009;13(3)233-9.
16.Levendowski DJ, Morgan T, Montague J, Melzer V, Berka C, Westbrook PR. Prevalence of probable sleep apnea risk and severity in a population of dental patients. Sleep Breath
2009;13(3):299-300.
17.Strauss SM, Alfano MC, Shelley D, Fulmer T. Identifying unaddressed systemic health conditions at dental visits: patients who visited dental practices but not general health care providers in 2008. Am J Pub Health 2012;102(2):253-5.
18.Flemons WW, McNicholas WT. Clinical prediction of the sleep apnea syndrome. Sleep Med Rev 1997;1(1):19-32.
19.Mehta V, Subramanyam R, Shapiro C, Chung F. Health effects of identifying patients with undiagnosed obstructive sleep apnea in the preoperative clinic: a follow-up study.
Can J Anaesth 2012;59(6):544-55.
20.Bradley TD, Phillipson EA. Central sleep apnea. Clin Chest Med 1992;13:493-505. 21.Young T, Peppard PE, Gottlieb DJ. Epidemiology of obstructive sleep apnea: a
population health perspective. Am J Respir Crit Care Med 2002;165(9):1217-39. 22.Institute for Clinical Systems Improvement 2008. Accessed 12 March 2014.
<https://www.icsi.org/>
23.National Institute for Health and Care Excellence 2010. Accessed 12 March 2014. <http://www.nice.org.uk/>
24.Chung F, Yegneswaran B, Liao P, et al. STOP questionnaire: a tool to screen patients for obstructive sleep apnea. Anesthesiology 2008;108(5):812-21.
25.Gottlieb DJ, Whitney CW, Bonekat WH, et al. Relation of sleepiness to respiratory disturbance index: the Sleep Heart Health Study. Am J Respir Crit Care Med
1999;159(2):502-7.
26.Niijima K, Enta K, Hori H, et al. The Usefulness of Sleep Apnea Screening using a Portable Pulse Oximeter in the Workplace. J Occup Health 2007;49(1):1-8.
27.Cooper BG, Veale D, Griffiths CJ, et al. Value of nocturnal oxygen saturation as a screening test for sleep apnoea. Thorax 1991;46(8);586-8.
29.Nuber R, Varvrina J, Karrer W. Predictive value of nocturnal pulse oximetry in sleep apnea screening. Schweiz Med Wochenschr Supp 2000;116:120S-122S.
30.Oeverland B, Skatvedt O, et al. Pulseoximetry: sufficient to diagnose severe sleep apnea.
Sleep Med 2002;3(2):133-8.
31.Nigro CA, Aimaretti S, Gonzalez S, Rhodius E. Validation of the WristOx 3100TM oximeter for the diagnosis of sleep apnea/hypopnea syndrome. Sleep Breath
2009;13(2):127-36.
32.Gyulay S, Olson LG, Hensley MJ, et al. A comparison of clinical assessment and home oximetry in the diagnosis of obstructive sleep apnea. Am Rev Respir Dis 1993;147(1):50-3.
33.Barsh LI. Responsibilities of the dental profession in the recognition and treatment of sleep breathing disorders. Sleep Breath 1997;2(2):41-4.
34.Creanor S, Millward BA, Demaine A, Price L, Smith W, Brown N, Creanor SL. Patients’ attitudes towards screening for diabetes and other medical conditions in the dental
setting. Br Dent J 2014;216(1).
35.Engstrom S, Berne C, Gahnberg L, Svardsudd K. Efficacy of screening for high blood pressure in dental health care. BMC Public Health 2011;11:194.
36.Healthy People 2013. U.S. Department of Health and Human Services. Accessed 12 March 2014. <http://www.healthypeople.gov>
37.Young T, Palta M, Dempsey J, Skatrud J, Weber S, Badr S. The occurrence of sleep-disordered breathing among middle-aged adults. N Engl J Med 1993;328(17):1230-5. 38.Dancey DR, Hanly PJ, Soong C, Lee B, Shepard J Jr, Hoffstein V. Gender differences in
sleep apnea: the role of neck circumference. Chest 2003;123(5):1544-50.
39.Millman RP, Carlisle CC, McGarvey ST, Eveloff SE, Levinson PD. Body fat distribution and sleep apnea severity in women. Chest 1995;107(2):362-6.
40.O'Connor C, Thornley KS, Hanly PJ. Gender differences in the polysomnographic features of obstructive sleep apnea. Am J Respir Crit Care Med 2000;161(5):1465-72. 41.Olson AL, Zwillich C. The obesity hypoventilation syndrome. Am J Med
2005;118(9):948-56.
43.Iglesias C, Torgerson D. Does length of questionnaire matter? A randomised trial of response rates to a mailed questionnaire. J Health Serv Res Policy 2000;5(4):219-21. 44.Nasseh K, Greenberg B, Vujicic M, Glick M. The effect of chairside chronic disease
screenings by oral health professionals on health care costs. Am J Public Health