Copyright © 2016 Vilnius Gediminas Technical University (VGTU) Press Technika http://www.bjrbe.vgtu.lt
doi:10.3846/bjrbe.2016.30 OF ROAD AND BRIDGE ENGINEERING
ISSN 1822-427X / eISSN 1822-4288 2016 Volume 11(4): 259–265
1. Introduction
During the last decade different traffic calming measures (TCM) have been implemented in Estonian cities and built-up areas. Today there are plenty of different mea-sures being introduced, however it is unknown which of them are more efficient. Respective studies are compli-cated due to significant differences in geometrical char-acteristics and layout of TCM of the same type. It means that the same TCM implemented in similar conditions potentially have different impact and efficiency. As a re-sult, estimated efficiency is applicable only to the exact TCM studied. For the same reason results of surveys held abroad could not be applicable to Estonian conditions or the impacts might be different from the originals. Au-thors of this paper set a goal to develop and to test meth-odology for estimating efficiency of TCM, which could be used as a unified methodology for respective studies in Estonia. This could be taken as a first step to under-stand efficiency of TCM of different shape, size and lay-out, standardizing TCM and drawing recommendations to use the most effective TCM under certain conditions. Respective interest groups are local authorities and traffic management specialists.
2. Literature analysis
The Institute of Transportation Engineers (USA) in Guide for Achieving Flexibility in Highway Design defines traffic calming as the combination of mainly physical measures that reduce the negative effects of motor vehicle use, al-ter driver behaviour and improve conditions for non-mo-torized street users. According to Estonian standard EVS 843:2003 Town Streets traffic calming assumes that drivers should feel themselves being in an area where safe speed limit is 50 km/h and where is a higher probability to meet a pedestrian. Sometimes it is said that traffic calming mea-sures are used to replace enforcement. They place physical rather than legal restrictions on the actions of citizens and can be argued to provide a more socially equitable and effi-cient solution than regulation (Garrod et al. 2002).
There are various types of TCM depending on their character. For instance, there are distinguished vertical and horizontal TCM. Vertical TCM include any measure that alters the vertical profile of the carriageway such as road humps and speed cushions. Horizontal TCM include measures that alter the horizontal alignment of the car-riageway such as mini-roundabouts, build outs and chi-canes (Mountain et al. 2005).
UNIFIED METHODOLOGY FOR ESTIMATING EFFICIENCY
OF TRAFFIC CALMING MEASURES
–
EXAMPLE OF ESTONIA
Juri Ess1, Dago Antov2
Faculty of Mechanical Engineering, Tallinn University of Technology, Ehitajate tee 5, 19086 Tallinn, Estonia E-mails: 1[email protected]; 2[email protected]
Abstract. Traffic calming is an integral part of contemporary traffic planning and traffic management being used for fulfilling different tasks such as reducing vehicle speed and traffic volume, and in final terms reducing number of acci-dents. Traffic calming measures are notstandardized internationally and have significant differences in geometric shape and layout in different countries, as well as in Estonia. At the same time impacts of different calming measures are un-studied well, and often the surveys are incomparable to each other. There are also no certain recommendation which measures should be implemented under different conditions. One of the reasons for that is lack of tested methodol-ogy for estimating the effectiveness of calming measures. This paper describes research that aimed at developing such a methodology and conducting a pilot study to test it. Effectiveness of traffic calming measures is estimated from the perspectives of vehicle speed and public acceptance. The new methodology assumes conducting an experiment. It al-lows comparing efficiency of two or more measures of the same type. The pilot study was conducted in Tallinn with a sample of 30 drivers. Results of this study proved that the new methodology is suitable for estimating effectiveness of traffic calming measures.
How can one understand TCM efficiency? Literature analysis shows that there is no widespread or common-ly accepted definition of TCM efficiency. However, many sources connect efficiency to the goals of the traffic calm-ing project. For instance, Corkle et al. (2002) state that to estimate efficiency of traffic calming measures one should set exact and measurable goals and base oneself on the fact whether these goals have been achieved or not.
There are many efficiency parameters being used in studies aimed at estimating TCM impacts. Among the dif-ferent speed-related parameters known in the literature, mean speed is very often used as measure for safe driv-ing, mainly because elevated crash risk and severity have been related to an increase in mean speed (Ariën et al. 2013). Other speed related efficiency parameters are 85th percentile speed, standard deviation of longitudinal accel-eration and decelaccel-eration, percentage of drivers exceeding the speed limit, the highest speeds, 10 mph pace (Ariën et al. 2013, 2014; Corkle et al. 2002; Mountain et al. 2005). Among other commonly used TCM efficiency parameters are reduction of traffic volume, change in the number of fatal and injury accidents, traffic noise level, vehicle emis-sion and public health impact (Čygaitė et al. 2014; Huang, Cynecki 2001; Lee et al. 2013). Some authors measure TCM efficiency as a delay per TCM during emergency transport (Berthod 2011), or delay time for crossing the road (Garrod et al. 2002), cost of traffic calming proj-ect and maintenance costs (Garrod et al. 2002, Langdon 2003). Other authors estimate such effeciency parameters as private expenditures in fuel and vehicle maintenance (Jazcilevich et al. 2015), impact on public transport (Ban-ister 2009) and cyclists (Pinkerton et al. 2013). Literature analysis shows that public acceptance has become an im-portant TCM efficiency component (Čygaitė et al. 2014; El-Basyouny, El-Bassiouni 2013; Garrod et al. 2002). Nev-ertheless the most common efficiency parameters of TCM are connected to speed, traffic volume and number of ac-cidents.
Analysis shows that the most common method used to determine efficiency of TCM is a before-and-after study. It assumes that a road is divided into road sections each of them having a TCM implemented on it. Selected effi-ciency parameters are measured on each road section be-fore implementing TCM and after that. Afterwards these parameters for each road sections are compared to each other and respective conclusions are made. However, de-spite its popularity, a before-and-after study can give mis-leading conclusions. It happens because of lack in control for regression-to-the-mean (or long-term trends in acci-dent occurrence) or because of ignoring the presence of potentially important confounding factors such as change in traffic volume and modifications in land use (Granà et al. 2010).
Among the other common TCM efficiency research methods are interviews, microscopic traffic simulation as well as comparison analysis. Another research method is the meta-analysis method. It assumes collecting and
examining data from different studies on a specific theme in order to identify the common effect of a treatment, when this is consistent from one study to the next. On the contrary, the meta-analysis can be applied to explain the variation when the effect size is a little bit different in all the studies (Granà et al. 2010).
TCM efficiency study methods assume acquisition of different efficiency parameters. Some of them can be gath-ered from databases, for instance the statistic of accidents, while other parameters such traffic volume and vehicle speed should be measured by researchers. In respect of the latter parameter, it is recommended to hide the pres-ence of the data acquisition devices and to avoid possible alterations of natural behaviour of drivers (i.e. reductions of speed), which often occur when devices (such as pneu-matic tubes or radar placed on a tripod, etc.) are clearly visible at the side of the street or on it (Pau, Angius 2001). In this context a good option is using GPS trackers placed in the car, but it assumes working conducting experiments with focus groups.
To sum up, according to literature the main goals of traffic calming can be set as improvement of safety of street users and reduction of negative effects of motor vehicles. There is unclear definition of traffic calming efficiency. The latter is mostly measured by means of parameters connect-ed to speconnect-eds, traffic volumes and number of accidents. The most widespread method of measuring traffic calming effi-ciency is before-and-after study, but it sometimes give un-truthful results. Other common TCM efficiency research methods are interviews, microscopic traffic simulation and comparison analysis.
3. The new methodology for studies in Estonia
Authors of this paper set a goal to develop and to test a unified methodology that would be suitable for estimat-ing efficiency of TCM implemented in Estonia. Under the term efficiency authors understand practical value of the implemented TCM, i.e. whether they perform their task (for example, reduce speed to desired limit) or not. It should be noted that the goal of researchers was to intro-duce methodology for studying isolated TCM, not their combinations or traffic calming schemes.
In their work authors based on international practice, particularities of traffic management in Estonia and avai-lability of data. These facts were also considered when cho-osing TCM efficiency parameters. Further the developed methodology is described in detail, starting with efficiency parameters to be measured, proceeding with description of the study method and finishing with the pilot study held in Tallinn to test the methodology.
3.1. Efficiency parameters
Efficiency parameters have been chosen based on results of literature analysis as well as on availability of data. Analysis has shown that the most common TCM efficiency param-eters are connected to vehicle speed, traffic volume and ac-cident. Another important parameter is public acceptance. However, incomplete data is available for researchers. For instance, in Estonia there is unreliable traffic incident data for calmed roads. At the same time some parameters such as traffic calming impact on traffic volume can be adequately measured only by means of before-and-after studies. Unfortunately, such studies are untaken in Estonia and as a result there is no “before” data for existing TCM. Unlike the other parameters, researchers can successfully estimate drivers’ speed behaviour and public acceptance. The chosen efficiency parameters are described in deeper detail further on.
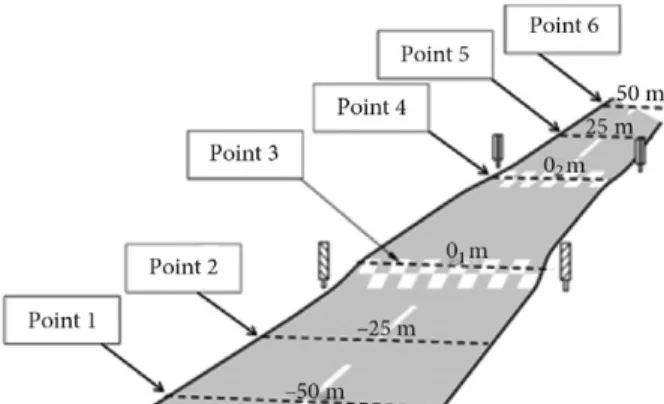
85th percentile location speed. When estimating drivers’ speed behaviour, it makes sense to proceed from the fact that traffic calming aims at choosing safe speed. Safe speed is usually shown by respective traffic signs. Wherein, it is assumed that drivers choose safe speed in-particular when crossing a TCM, but on the whole calmed road section. Therefore, drivers’ speed behaviour is esti-mated in different locations (points). These points have been selected on the basis of based pre-study experiments and are shown on Fig. 1. In Point 1 drivers are approaching the TCM; at this point they have not jet started reacting at it. Speed in Point 3 shows how quickly the first axle of the vehicle runs on the TCM. Speed in the Point 4 shows how quickly the rear axle of the vehicle drives down the obstacle. In Point 6 drives have finished interacting with the TCM. Speeds in Points 2 to 5 are transitional and are used for better understanding of drivers’ speed behavior when crossing TCM. 85th percentile location speeds at the Points 1 and 6 are compared to the established speed limit on particular road section. The closer these speeds are to the speed limit, the more efficient TCM is considered to be. 85th percentile speed is chosen as an efficiency param-eter, as it is inaffected by extremes and characterizes driv-ers’ speed behaviour in the most objective way. Therefore, this speed parameter suits the set purposes the best.
Location speeds can be measured using contempora-ry GNSS (Global Navigation Satellite System) equipment. Contemporary GNSS devices work with frequency of 10– 20 Hz and allow determining position of vehicle with high accuracy. For instance, Vbox-type equipment allows deter-mining position of vehicle with accuracy of 10 cm and de-termining speed with accuracy of 0.01 km/h.
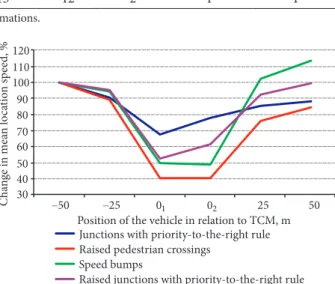
Change in mean location speed. When speaking about speed, there should be considered not only complian-ce with speed limit, but also such parameter as smoothness of traffic flow. Drivers should drive without reducing opera-ting speed considerably in front of TCM, as it is connected to increased risk of rear-end collision, difficulties for emer-gency vehicles as well as excess air pollution and noise le-vel. Therefore, authors propose to estimate change in mean location speeds when running TCM. For these purpose mean speeds are calculated for Points 1–6 (Fig. 1). After that there is calculated change in mean location speeds in relation to mean speed in Points 1 (Fig. 2). The higher is percentage ratio of mean speed in Point 3 to mean speed in Point 1, the more efficient is the TCM. It means that drivers are unnecessary to decelerate operating speed con-siderably in front on the TCM. Mean speeds in Points 2, 4, 5 and 6 are used for better understanding of drivers’ speed behavior when crossing TCM.
Mean speed is chosen here as an efficiency parameter, as it is more informative for the chosen locations than 85th percentile speed. Pre-study showed that extremes unde-form results significantly, as the majority of drivers cross TCM with similar speed.
Public acceptance. Literature analysis has shown that along with other parameters public acceptance is also widely used for estimating efficiency of traffic calming. Under public acceptance authors understand attitude of road users towards the TCM. By its nature traffic calming is connected to certain limitations. Therefore, acceptance of a TCM assumes that people are aware of traffic calming goals and are ready to scarify their comfort to some extent
Fig. 1. Scheme of the speed measurement points
to help these goals achieved. Estimating public acceptance seems to be logical as opinion of the actual road users (al-though it is very subjective) could be also considered along with the other more objective parameters. The authors pro-pose to make a connection between efficiency of TCM and attitude of road users towards them – the better is public at-titude, the more efficient the TCM is considered to be.
Public acceptance is estimated by means of survey with multiple choice questions. Respondents should assess their attitude towards TCMs on bases of five point scale (very poor, poor, fair, good, very good). For each TCM there is calculated the total number of voices for “good” and “very good” and respective rankings is made. The higher is place in this ranking, the more efficient the TCM is. In order to get reliable results, it is highly recommended to accompany questions with pictures of the TCM being studied. The easiest way to get reliable results is to con-duct the survey among drivers who participate in the ex-periment. In such case for logical reasons survey should be conducted after the route is passed.
3.2. Test survey
The proposed method for estimating efficiency of traffic calming measures was tested in an experiment. The experi-ment was conducted with a sample of drivers, which gen-der and age structure corresponds to gengen-der and age struc-ture of all the Estonian drivers. The bigger is sample size, the more precise are the results of the experiment. Selected drivers pass a certain route, which has calmed road sections on it. Each section is being dealt with separately represent-ing one TCM berepresent-ing situated on it. It is essential that drivers should not know the real aim of the experiment.
Experiment is conducted in free-flow traffic con-ditions, i.e. no obstacles like slower moving vehicles or pedestrians crossing the road should influence choice of speed. Ideally, there should be no other vehicles on the route at all. In case of any conditions that affect purity of the experiment, respective data is ignored.
Efficiency of TCM is estimated on the bases of three parameters:
−85th percentile location speed,
−change in mean location speed,
−public acceptance.
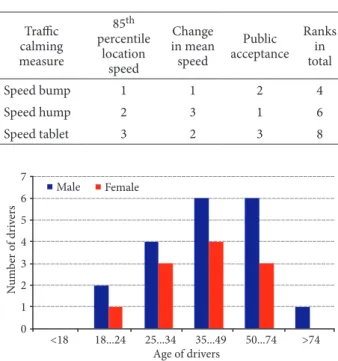
The study method assumes that efficiency parameters are being collected on each road section. For each para-meter the TCM are ranked according to their efficiency. If there are three TCM studied like its shown in Table 1, they are ranked by efficiency from 1 to 3 where “1” is the most efficient TCM and “3” is the least efficient TCM. If there are four TCM studied, there would be four ranks where “1” is the most efficient TCM and “4” is the least efficient TCM and so on.
Ranks are summarized. As “1” stays for the most ef-ficient TCM, the TCM should get as less points in total as possible. In the example given in Table 1 the most efficient TCM would be the speed bump. However, one should take into consideration that ranks are given on an interval scale and, therefore, they do not show, but rather indicate the leaders. Sometimes these leaders should be thoroughly compared to reveal the most effective measure. If effectiv-ness of two or more measures is practically the same, an additional efficiency parameter can be applied such as cost of implementing the TCM. It should be noted, that as TCM are unstandardized respective conclusions are appli-cable only to the TCM studied and to the TCM similar in size, shape and markings.
The experiment for testing the new methodology (pi-lot study) took place in Tallinn in March 2014 and lasted for one month. During a study there was formed a sample of 30 drivers whose age and gender are shown on Fig. 3. As it comes from the methodology the age and gender structure of the sample corresponds to the age and gender structure of all the Estonian drivers.
During the study TCM were grouped by types (num-ber of studied TCMs in each group is given in brackets) – speed bumps (3), raised pedestrian crossings (3), junctions with priority-to-the-right rule (4) and raised junctions with priority-to-the-right rule (6). All the TCM of the same type have the same parameters and markings. As the TCMs were considered in groups, efficiency parameters for the TCM inside each group were averaged.
In order to exclude factors that could affect behaviour of drivers such as slower moving cars, test trips were held outside rash hours, mainly on the weekends. Speed limit on the calmed road sections studied was 30 km/h. All the dri-vers were driving one and the same car. They were told that the aim of the experiment is to estimate mean speeds of male and female drivers of different age in different road condi-tions, so they misunderstand the real aim of the experiment. Table 1. Example of ranking efficiency of traffic calming
measures
Traffic calming measure
85th percentile
location speed
Change in mean speed
Public acceptance
Ranks in total
Speed bump 1 1 2 4
Speed hump 2 3 1 6
Speed tablet 3 2 3 8
Speeds were measured by means of Video Vbox de-vice. Public acceptance was estimated by means of survey held with all the drivers after each trip. Respective efficien-cy parameters for each TCM group are shown on Figs 4–6 and are summed up in Table 2.
Study results are given in Table 5. The best total rank that is possible to get is 3 and raised junction with priori-ty-to-the-right rule has 4. Other TCM are far behind with ranks 7 to 9.
Raised junction with priority-to-the-right rule has the best total rank. However, as it was mentioned before, ranks are given on an interval scale and one cannot make single valued conclusions, but has to pay attention to other circumstances besides the total rank.
Table 2. Mean 85th percentile location speed, km/h
Traffic calming measures –50 m –25 m 01 m 02 m 25 m 50 m
Speed bumps 32.44 29.25 16.98 16.47 30.89 32.60
Raised pedestrian crossings 43.14 37.56 19.90 20.30 33.43 36.70
Junctions with priority-to-the-right rule 46.15 42.18 38.30 39.37 38.76 40.99
Raised junctions with priority-to-the-right rule 37.32 35.94 23.01 23.35 34.01 36.26
Table 3. Mean location speed, km/h
Traffic calming measures –50 m –25 m 01 m 02 m 25 m 50 m
Speed bumps 26.18 24.75 13.11 12.75 26.85 29.77
Raised pedestrian crossings 36.62 32.65 14.76 15.63 27.86 31.07
Junctions with priority-to-the-right rule 38.75 34.75 25.97 29.63 32.62 33.98
Raised junctions with priority-to-the-right rule 32.39 30.86 16.97 19.85 29.87 32.22
Table 4. Public acceptance
Traffic calming measure Very good Good Fair Poor Very poor Do not know
Speed bumps 1 7 12 7 2 1
Raised pedestrian crossings 3 12 12 0 1 2
Junctions with priority-to-the-right rule 1 6 7 8 6 2
Raised junctions with priority-to-the-right rule 2 15 12 2 1 1
Note: numbers correspond to the number of drivers who gave the respective estimations.
Fig. 4. Mean 85th percentile location speed (speed limit 30 km/h) Fig. 5. Change in mean location speed in relation to location speed in Point 1
The study revealed that using raised junction with pri-ority-to-the-right rule and junction with priority-to-the-right rule is connected to traffic hazards. At such junctions drivers have to give way to vehicles approaching from the right. However, vertical visibility before these junctions is severely limited by buildings and fences, so drivers are able to see vehicles on the intersected road only entering the junction (if applied to Fig. 1 drivers start seeing vehicles approaching from the right in point 3). Such junctions are used to calm traffic, because it is assumed that drivers choose low speed when approaching them, otherwise they will not be able to give way. However, study showed that in Point 3 mean speed for junctions with priority-to-the-right rule is 25.97 km/h and mean speed for raised junc-tions with priority-to-the-right rule is 16.97 km/h. In the first case, stopping distance would be 12.3 m and for the second case, stopping distance would be 7.2 m. If driver enters a junction with such a speed and there is a vehicle approaching from the right, he will not have enough room to stop and will not be able to give way. It means that us-ing junctions with priority-to-the-right rule is potentially connected to hazards.
So, taking into account conclusion made above, study results should be specified. Raised junction could be con-sidered to be the most efficient TCM among the other TCMs studied, but it is recommended to step aside from priority-to-the-right rule and to use rather priority signs (“Main road” and “Give way”) or make it a stop-controlled intersection with four-way stops (with “Stop” signs from each direction).
In conclusion, one can state that the pilot study gave trustful results and confirmed that the developed meth-odology is suitable for estimating TCM efficiency in con-temporary Estonian conditions. Although the pilot study aimed at comparing types of TCM, the same method can be used for comparing TCM of the same type. Such a com-parison makes sense, if TCM of the same type have differ-ent parameters and markings.
4. Conclusions
1. The aim of this study was to develop and to test a unified methodology, which could be used for estimation of effi-ciency of traffic calming measures in Estonia. Authors see the unified methodology as the first step to understanding efficiency of traffic calming measures of different shape, size and markings, standardizing traffic calming measures and drawing recommendations to using the most effective traffic calming measures under certain conditions.
2. The developed methodology assumes conducting an experiment. It suits for studying isolated traffic calm-ing measures, not their combinations or traffic calmcalm-ing schemes. The experiment was conducted with a sample of drivers who pass a certain road section, which has traf-fic calming measure. Each road section is being dealt with separately representing one traffic calming measure being situated on it.
3. Effectiveness of traffic calming measures is estimat-ed from the perspectives of vehicles speestimat-ed and public accep-tance. These parameters have been chosen based on results of literature analysis as well as on availability of data. Speeds are determined by means of Global Navigation Satellite Sys-tem equipment such as Video Vbox device situated in the car. Speeds are measured in certain locations and are used to understand how traffic calming measures contribute to compliance with speed limits and to smoothness of traffic flow. The closer is a vehicle speed to the speed limit and the smoother is change in speeds when running a traffic calm-ing measure, the more efficient it is considered to be. Pub-lic acceptance, i.e. road user’s attitude towards the TCM, is estimated by means of survey held with all the drivers after each trip. The higher is rating of traffic calming measures, the more efficient it is considered to be.
4. The traffic calming measures being studied are ranked according to the efficiency parameters. Ranks indi-cate the “leaders” and researchers have to study the results of experiments thoroughly in order to make conclusions. These conclusions are valid only for the traffic calming measures studied and for traffic calming measures having the same shape and markings.
5. In order to test the new methodology, a pilot study with a sample of 30 drivers was conducted in Tallinn. The study gave trustful results and proved that the new meth-odology is suitable for estimating effectiveness of traffic calming measures in Estonia.
References
Ariën, C.; Brijs, K.; Brijs, T.; Ceulemans, W.; Vanroelen, G.; Jon-gena, E. M. M., Stijn, D.; Wets, G. 2014. Does the Effect of Traffic Calming Measures Endure over Time? – A Simulator Study on the Influence of Gates, Transportation Research Part F:Traffic Psychology and Behaviour 22: 63–75.
https://doi.org/10.1016/j.trf.2013.10.010
Ariën, C.; Jongen, E. M. M.; Brijs, K.; Brijs, T.; Stijn, D.; Wetsa, G. 2013. A Simulator Study on the Impact of Traffic Calming Measures in Urban Areas on Driving Behavior and Work-load, Accident Analysis and Prevention 61: 43–53.
https://doi.org/10.1016/j.aap.2012.12.044
Table 5. Results of the pilot study
Traffic calming measure 85location speedth percentile mean speedChange in acceptancePublic in totalRanks
Speed bumps 1 3 3 7
Raised pedestrian crossings 3 4 2 9
Junctions with priority-to-the-right rule 4 2 4 8
Banister, D. 2009. Traffic Calming in the United Kingdom: the Im-plications for the Local Economy. Firenze University Press. 47 p.
http://dx.doi.org/10.13128/Aestimum-7251
Berthod, C. 2011. Traffic Calming – Speed Humps and Speed Cushions, Journal of Civil Engineering and Architecture 7(4): 456–465.
Corkle, J.; Giese, J. L.; Marti, M. M. 2002. Investigating the Effec-tiveness of Traffic Calming Strategies on Driver Behavior, Traf-fic Flow and Speed. Report No. MN/RC –2002-02. Minnesota Local Road Research Board (LRRB). 107 p.
Čygaitė, L.; Lingytė, I.; Strumskys, M. 2014. Analysis of Vertical Traffic Calming Measures in Impacts on Road Safety and Environment in Lithuania State Roads, in Proc. of the 9th In-ternational Conference “Environmental Engineering”. Ed. by D. Čygas; T. Tollazzi, 22–23 May, 2014, Vilnius, Lithuania.
https://doi.org/10.3846/enviro.2014.150
El-Basyouny, K.; El-Bassiouni, Y. M. 2013. Modeling and Ana-lyzing Traffic Safety Perceptions: an Application to the Speed Limit Reduction Pilot Project in Edmonton, Alberta, Acci-dent Analysis and Prevention 51: 156–167.
https://doi.org/10.1016/j.aap.2012.11.009
Garrod, G. D.; Scarpa, R.; Willis, K. G. 2002. Estimating the Ben-efits of Traffic Calming on through Routes: a Choice Experi-ment Approach, Journal of Transport Economics and Policy 36(2): 211–231.
Granà, A.; Giuffrè, T.; Guerrieri, M. 2010. Exploring Effects of Ar-ea-Wide Traffic Calming Measures on Urban Road Sustainable Safety, Journal of Sustainable Development 3(4): 38–49.
https://doi.org/10.5539/jsd.v3n4p38
Huang, F. H.; Cynecki, M. J. 2001. The Effects of Traffic Calm-ing Measures on Pedestrian and Motorist Behavior. Report No. FHWA-RD-00-104. Highway Safety Research Center. Uni-versity of North Carolina. 30 p.
Jazcilevich, A.; Vázquez, J. M. M.; Ramírez, P. L.; Pérez, I. R. 2015. Economic-Environmental Analysis of Traffic-Calming De-vices, Transportation Research Part D 36: 86–95.
https://doi.org/10.1016/j.trd.2015.02.010
Langdon, P. 2003. Calming Rural Roads: How Traffic Calming and Context-Sensitive Design Can Improve Small Towns Bi-sected by State Routes, Planning 69(5): 30–33.
Lee, G.; Joo, S.; Oh, C.; Choi, K. 2013. An Evaluation Framework for Traffic Calming Measures in Residential Areas, Transpor-tation Research Part D: Transport and Environment 25: 68–76.
https://doi.org/10.1016/j.trd.2013.08.002
Mountain, L. J.; Hirst, W. M.; Maher, M. J. 2005. Are Speed En-forcement Cameras More Effective than other Speed Manage-ment Measures? The Impact of Speed ManageManage-ment Schemes on 30 mph Roads, Accident Analysis and Prevention 37(4): 742–754. https://doi.org/10.1016/j.aap.2005.03.017
Pau, M.; Angius, S. 2001. Do Speed Bumps Really Decrease Traf-fic Speed? An Italian Experience, Accident Analysis and Pre-vention 33(5): 585–597.
https://doi.org/10.1016/S0001-4575(00)00070-1
Pinkerton, B.; Rosu, A.; Janssen, I.; Pickett, W. 2013. Active Trans-portation Safety Features Around Schools in Canada, Inter-national Journal of Environmental Research and Public Health 10: 5711–5725. https://doi.org/10.3390/ijerph10115711