Katerina Taškova, Peter Korošec and Jurij Šilc
Computer Systems Department, Jožef Stefan Institute, Ljubljana, Slovenia E-mail: [email protected]
Keywords:ant-colony optimization, distributed computing, mesh partitioning, multilevel approach
Received:May 20, 2008
The paper presents a distributed implementations of an ant colony optimization metaheuristic for the solu-tion of a mesh partisolu-tioning problem. The usefulness and efficiency of the algorithm, in its sequential form, to solve that particular optimization problem has already been shown in previous work. In this paper a straightforward implementations on a distributed architecture is presented and the main algorithmic issues that had to be addressed are discussed. Algorithms are evaluated on a set of well known graph-partitioning problems from the Graph Collection Web page.
Povzetek: V sestavku je predstavljena porazdeljena izvedba metahevristiˇcne optimizacije s kolonijami mravelj, ki je uporabljena pri reševanju problema razdelitve mreže.
1 Introduction
Real engineering problems have complex dynamic behav-ior and one of the widely accepted formalisms for their modeling are partial differential equations (PDEs). The fraction of PDEs that have solutions in a closed analyti-cal form is quite small and in general their solution relies on numerical approximations. Finite-element method is a well known numerical method that efficiently solves com-plex PDEs problems. In order to find an approximation of an unknown solution functionf(x), this method discretizes the underlying domain into a set of geometrical elements consisting of nodes. This process is known as meshing. The value of the functionf(x)is then computed for each of these nodes, and the solutions for the other data points are interpolated from these values [4].
Generated mesh structures can have large number of elements, therefore a common approach would involve a mesh-partitioning task in order to solve the finite-element method using multiple parallel processors. Consequently, the mesh-partitioning task aims to achieve minimal inter-processor communication and at the same time to maintain a processor workload balance.
Mesh-partitioning problem is a combinatorial optimiza-tion problem. Namely, it is a special case of the well-known graph-partitioning problem, which is well-known to be a N P-hard and is defined as follows: If G(V, E) de-notes an undirected graph consisting of a non-empty set V of vertices and a set E ⊆ V ×V of edges, then k-partitionDof Gcompriseskmutually disjointed subsets D1, D2, . . . , Dk (domains) of V whose union is V. The
set of edges that connect the different domains of a par-titionD is called an edge-cut. A partitionD is balanced if the sizes of the domains are roughly the same, i.e., if b(D) = max1≤i≤k|Di| −min1≤i≤k|Di| ≈0. The
graph-partitioning problem is to find a balanced partition with a
minimum edge-cut, denoted byζ(D).
Employing metaheuristic approach in optimization has introduced efficient and practical solution of many complex real-world problems. A variety of heuristic based methods are used for solving the mesh-partitioning problem as well [1, 10, 12]. In spite of being very powerful approach, meta-heuristic can still easily reach the computational time lim-its for large and difficult problems. Moreover, heuristics do not guarantee an optimal solution, and in general their per-formance could depend on the particular problem setting. An important issue that arises here is not only how to de-sign/calibrate the algorithm for a maximum performance, but also how to make it robust in terms of dealing with dif-ferent types of problems and settings. Parallel processing is an straightforward approach that addresses both issues, computational time and robustness.
One relatively new and promising metaheuristic that is competitive with standard mesh-partitioning tools, such as Chaco [9], JOSTLE (that has recently been commercialised and is available under the name of NetWorks), and k-METIS [11], is known asMultilevel Ant-Colony Algorithm
ma-chine architecture. Explicitly, we present and experimen-tally evaluate two distributed versions of MACA, the Semi-Independent Distributed MACA and the Interactive Dis-tributed MACA approach on a set of well known graph-partitioning problems from the Graph Partitioning Archive [8]. Both distributed approaches show comparable or bet-ter (stable) quality performance. Semi-independent dis-tributed approach can obtain same or better quality for less computational time, which is gain on both scales: quality and cost.
The rest of the paper is organized as follows: Section 2 describes the MACA algorithm for solving the mesh-partitioning problem. Section 3 outlines possible parallel strategies and in detail describes the two distributed im-plementations of MACA. The experimental results are pre-sented and discussed in Section 4. Conclusions and possi-ble directions for further work are given in Section 5.
2 The multilevel ant-colony
algorithm
The MACA is an ant-colony algorithm [6] for k-way mesh (graph) partitioning enhanced with a multilevel tech-nique [17] for global improvement of the partitioning method. The MACA is a recursive-like procedure that combines four basic methods: graph partitioning (the basic ant-colony optimization metaheuristic), graph contraction (coarsening), partitioned graph expansion (refinement) and
bucket sorting.
2.1 The basic ant-colony algorithm
The main idea of the ant-colony algorithm fork-way par-titioning [13] is very simple: We havek colonies of ants that are competing for food, which in this case represents the vertices of the graph. Final outcome of ants activities is stored food in their nests, i.e., they partition the mesh into ksubmeshes.
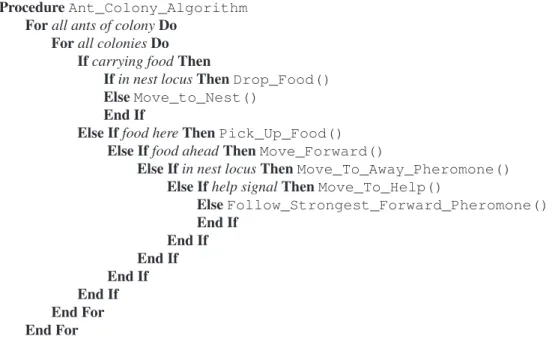
The outline of the core optimization procedure in the MACA pseudocode is given in Algorithm 1. The algo-rithm begins with a initialization procedure that performs a random mapping of the input graph onto a grid, which represents the place where ants can move, locates the nests position on the grid and places the ants initially in their nest locus. While gathering food, the artificial ants per-form probabilistic movements on the grid in three possible directions (forward, left and right), based on the pheromone intensity. When an ant finds food, it picks it up if the quan-tity of the temporarily gathered food in its nest is below a specified limit (the capacity of storage is limited in order to maintain the appropriate balance between domains); other-wise, the ant moves in a randomly selected direction. The weight of the food is calculated from the number of the cut edges created by assigning the selected vertex to the parti-tion associated with the nest of the current ant. If the food is too heavy for one ant to pick it up then an ant sends a
help signal (within a radius of a few cells) to its neighbor coworkers to help it carrying the food to the nest locus. On the way back to the nest locus an ant deposits pheromone on the trail that it is making, so the other ants can follow its trail and gather more food from that, or a nearby, cell. When an ant reaches the nest locus, it drops the food in the first possible place around the nest (in a clockwise direc-tion)and starts a new round of foraging.
Along with foraging food, ants can gather food from other nests as well. In this case when the food is too heavy to be picked up, the ant moves on instead of sending a help signal. In this way the temporary solution is significantly improved. Furthermore, the algorithm tries to maintain a high exploration level by restoring cells pheromone inten-sity to the initial value whenever the pheromone inteninten-sity of a certain cell drops below a fixed value.
2.2 The multilevel framework
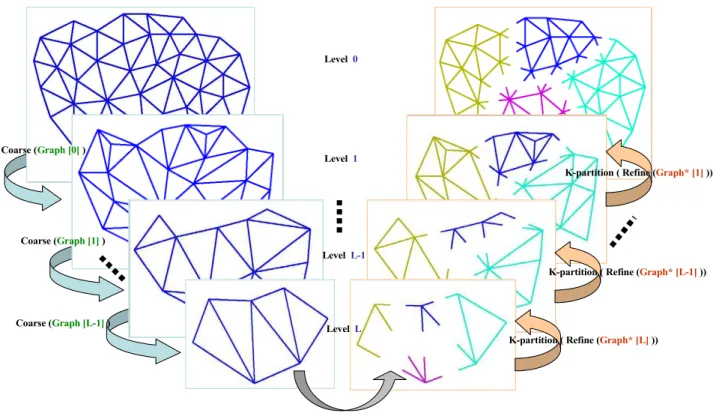
The multilevel framework [2] as presented in Algorithm 2 and Fig. 3 combines a level based coarsening strategy to-gether with a level based refinement method (in reverse order) to promote faster convergence of the optimization metaheuristic and solution to a larger problems.
Coarseningis a graph contraction procedure that is iter-ated Ltimes (on L levels). Adequately, a coarser graph G`+1(V`+1, E`+1) is obtained from a graph G`(V`, E`)
by finding the largest independent subset of graph edges and then collapsing them. Each selected edge is collapsed and the vertices u1, u2 ∈ V` that are at either end of it
are merged into the new vertex v ∈ V`+1 with weight |v| = |u1| +|u2|. The edges that have not been col-lapsed are inherited by the new graphG`+1 and the edges that have become duplicated are merged and their weight summed. Because of the inheritance the total weight of the graph remains the same and the total edge weight is re-duced by an amount equal to the weight of the collapsed edges, which have no impact on the graph balance or the edge-cut.
Refinement is a graph expansion procedure that applies on a partitioned graphG`(partitioned with the ant-colony
algorithm), which interpolates it onto its parent graph G`−1. Because of the simplicity of the coarsening proce-dure, the interpolation itself is a trivial task. Namely, if a vertexv ∈V`belongs to the domainDi, then after the
re-finement the matched pairu1, u2 ∈ V`−1 that represents the vertexv, will also be in the domainDi. In this way we
expand the graph to its original size, and on every level`of our expansion we run our basic ant-colony algorithm.
Large graph problems and the multilevel process by it-self induce rapid increase of the number of vertices in a single cell as the number of levels goes up. To overcome this problem MACA employs a method, based on the basic
ProcedureAnt_Colony_Algorithm Forall ants of colonyDo
Forall coloniesDo Ifcarrying foodThen
Ifin nest locusThenDrop_Food() ElseMove_to_Nest()
End If
Else Iffood hereThenPick_Up_Food() Else Iffood aheadThenMove_Forward()
Else Ifin nest locusThenMove_To_Away_Pheromone() Else Ifhelp signalThenMove_To_Help()
ElseFollow_Strongest_Forward_Pheromone() End If
End If End If End If End If End For End For
EndAnt_Colony_Algorithm.
Figure 1: Basic ant-colony algorithm
ProcedureMultilevel_Framework structure[0] =Initialization() For`= 0ToL−1Do
structure[`+ 1] =Coarsening(structure[`]) End For
For`=LDownto0Do Solver(structure[`])
If` >0Then
structure[`−1] =Refinement(structure[`]) End If
End For
EndMultilevel_Framework.
all nonempty buckets, implemented as double-linked list of vertices, are organized in a 2-3 tree. Additionally, MACA keeps separate2–3tree for each colony on every grid cell that has vertices in order to gain even faster searches.
3 Distributed multilevel ant-colony
approaches
In general, ant-colony optimization algorithms can be par-allelized on four different levels [5, 15, 16], as follows: (i)
parallelism on colony level, (ii) parallelism on ant level, (iii) data level parallelization, and (iv)functional paral-lelization, where each one is differing in granularity and communication overhead between processors. We will in brief, in the first subsection, describe all four paralleliza-tion approaches, making a ground base for introducparalleliza-tion of the proposed Semi-Independent Distributed MACA and In-teractive Distributed MACA approaches in the second, and the third subsection, respectively.
3.1 Parallelization strategies
(i)Parallelism on colony level is the most simple coarse-grained parallelization of the ant-colony optimization al-gorithms, where the problem is instantiated and solved si-multaneously on all available processors. Furthermore, if no communication is required between processors (paral-lel independent algorithms searches, introduced by Stützle [16]), then this approach is refereed to as parallel inde-pendent ant coloniesand it is suitable for algorithms that perform stochastic searches. Otherwise, if colonies, while searching for food, exchange information at a specified iter-ation (requires synchronized communiciter-ation which implies master/slave implementation), then we refer to this ap-proach asparallel interactive ant colonies. The communi-cation cost of the second approach can become very expen-sive due to the required broadcasting of entire pheromone structures.
(ii) Parallelism on ant levelis the first proposed paral-lel implementation [3] of an ant-colony optimization algo-rithm, where each ant (or a group of ants) is assigned a separate processor to build a solution. This means mainte-nance of a separate pheromone structures on every proces-sor and therefore this approach requires a master procesproces-sor that will synchronize the work of the rest (slave proces-sors), including ant-processor scheduling, initializations, global pheromone updates and producing of the final so-lution.
(iii)Data level parallelizationis a suitable approach for solving the multi-objective optimization problems, since it divides the main problem into a number of subproblems (objectives to optimize) and each one is solved by a colony on a separate processor.
(iv)Functional parallelizationis a parallelization that in-troduces a concurrent execution of a specified operations (local search, solution construction, solution evaluation)
performed by a single colony on a master-slave architec-ture. When local heuristic searches are computationally expensive, a so-calledparallel local searchesare the pre-ferred case. In particular, the assignment of a slave proces-sor is to refine the solutions received from the master with local search heuristics, while the master is responsible for a solution construction, pheromone updates and collection of the refined solutions. Theparallel solution constructionis a second approach that organizes the available slave proces-sors in two operational groups. Procesproces-sors in the first one are responsible for a solution construction, while the sec-ond group processors are additionally grouped and sched-uled to refine the corresponding solutions constructed by the first group processors. The last functional paralleliza-tion approach is calledparallel evaluation of solution ele-ments. This approach gives best performance in case of a computationally expensive solution evaluations. Compared to all aforementioned parallel strategies parallel evaluation of solution elements is the only approach that does not ex-ploits parallelism within the metaheuristic algorithm.
An efficient parallelization of a given algorithm depends mainly on the available computing platform, the underlying problem and the algorithm itself. If there is a large com-munication overhead between the processors, then parallel performance can be degraded. When the algorithms uses global structures, such as the pheromone matrix or the grid matrix of2–3trees in MACA case, a shared memory sys-tem would gain on communication (less) over a distributed memory system. On the other hand, the most common and cheaper approach in the same time is a parallelization using distributed memory systems, i.e., MIMD architecture such as cluster of workstations. Our proposed MACA paral-lelization assumes distributed memory system as well and it is implemented on a cluster of workstations.
3.2 The semi-independent distributed
MACA
(refine-K-partition (Graph [L]) = Graph* [L]
K-partition ( Refine (Graph* [L] )) K-partition ( Refine (Graph* [L-1] ))
K-partition ( Refine (Graph* [1] )) Coarse (Graph [0])
Coarse (Graph [1])
Coarse (Graph [L-1])
Level 0
Level 1
Level L-1
Level L
Figure 3: The three phases of multilevelk-way graph partitioning.
ment).
3.3 The interactive distributed MACA
The Interactive Distributed MACA (ItDMACA) is based on the parallel interactive colony approach which, by def-inition, implies master/slave implementation and synchro-nized communication. The information exchange between the colonies across the concurrent processors is initiated every time a piece of food has been taken or dropped on a new position. The information about the specific food, its new position and its owner is part of the message sent to and received from the master processor when picked up or dropped food. The master keeps and updates its own lo-cal grid matrix of temporal food positions (plays the role of shared memory) in order to maintain normal and consistent slaves activities.The master processors is responsible for the synchro-nized work and communication of the slave processors, which includes listening, processing and broadcasting of the incoming clients messages during level optimization. When all slave processors finish level or run, it collects the best-level solution, determines and broadcast the global best-level solution to the slaves and guides them when to start the refinement procedure and all necessary updates in order to perform the next level optimization activities or a new run.
A slave processor executes a single instance of the MACA code. While optimization executing informs the master and waits for master’s confirmation on every
poten-tial drop/pick, signals when finishes the current level opti-mization and send the best partition to the master. In the meantime, while waiting to go on the next level, it listens for an eventual changes send by the unfinished clients and performs the eventual updates on the grid. When the mas-ter signals that the current level is finished, by sending the new best temporal solution, the slave processor has to per-form partition expansion (refinement) in order to start the next level optimization.
4 Experimental evaluation
The proposed distributed versions of MACA were applied on a set of well-known graph problems and the results from their experimental evaluation are presented and discussed in this section. The section is structured in two subsection. The first subsection describes the implementation of the distributed code, the experimental setting and the bench-mark suite, whereas the second subsection presents and dis-cusses the evaluation results.
4.1 Setup
of TCP, UDP and RAW sockets as well as over100higher level protocols).
All experiments were performed on a8-node cluster con-nected via a Giga-bit switch, where each node consists of two AMD OpteronTM1.8-GHz processors,2GB of RAM, and Microsoft°RWindows°RXP operating system.
The benchmark graphs used in the experimental analysis were taken from the Graph Collection Web page [8], and are described in Table 1.
GraphG(V, E) |V| |E|
grid1 252 476
grid2 3296 6432
crack 10240 30380
U1000.05 1000 2394
U1000.10 1000 4696
U1000.20 1000 9339
Table 1: Benchmark graphs
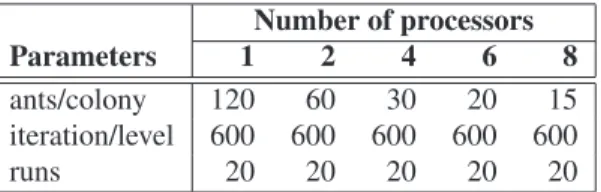
Number of processors
Parameters 1 2 4 6 8
ants/colony 120 60 30 20 15
iteration/level 600 600 600 600 600
runs 20 20 20 20 20
Table 2: Distribution of ants per colonies and number of iterations per level w.r.t the number of processors
The total number of ants per colony was120. As pre-sented in Table 2, the number of ants per sub-colony is dif-ferent and depends on the numberpof processors, i.e., 1
p
of the total number of ants, while the number of total itera-tions per level per colony is constant.
All experiments were run20times on each graph with each algorithm and as final results were presented the mean value (also best and worst values for edge-cut) of the con-sidered evaluation criteria over all performed runs.
4.2 Results
The results presented in the following tables show the per-formance of the introduced DMACA approaches on the2 -partitioning and 4-partitioning graph problem. The qual-ityof the partitioned graph is described with the edge-cut, ζ(D), and the balance,b(D). Balance is defined as the dif-ference (in the number of vertices) between the largest and the smallest domain.
Beside the quality, the second evaluation criteria is the effectiveness of the parallel algorithm which is, in our case, given by thespeed-upmeasure,S, defined as:
S(p) = tS tT(p)
and by therelative speed-upmeasure,Sr, which is defined
as:
Sr(p) =tT(1)
tT(p),
wheretSis the time to solve a problem with the sequential code, tT(1) is time to solve a problem with the parallel code with the one processor, andtT(p)is time to solve the same problem with the parallel code onpprocessors. Note thatS(p)andSr(p)were calculated based on the average
time values of the 20 runs.
By theory, correct speed-up metric should be calculated according to the performance (elapsed computational time) of the best serial code for the underlying algorithm, as de-fined above and denoted withS(p), whereas in practice this is usually translated into calculation of the relative speed-up metricSr(p), since the best serial code is not available
and writing two codes is not acceptable. In our case the serial code is available, and the values of both speed-up metrics are included in the tables with results.
Additionally, for the reason of comparison, in the ta-bles are given the measured CPU time for the computa-tion of the obtained solucomputa-tions, tT, as a triple of the time spent on pure computations, the time for communication with the master processor,tC, and the time for internal up-dates caused by the synchronization,tU. Note thattCand tUare part of thetTspent for communication and updates, respectively.
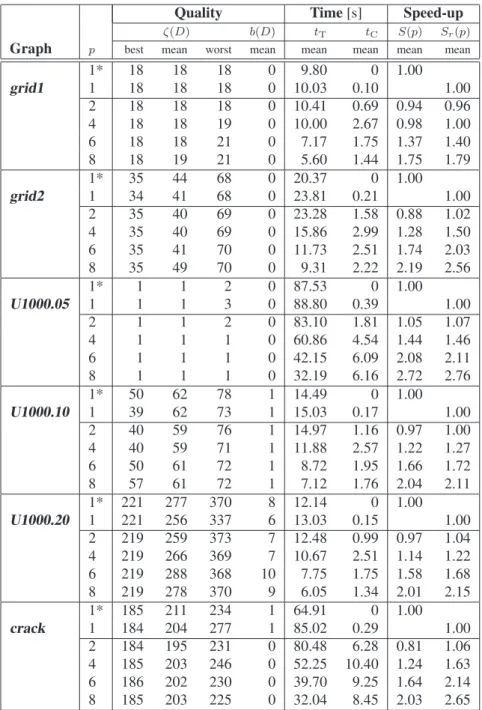
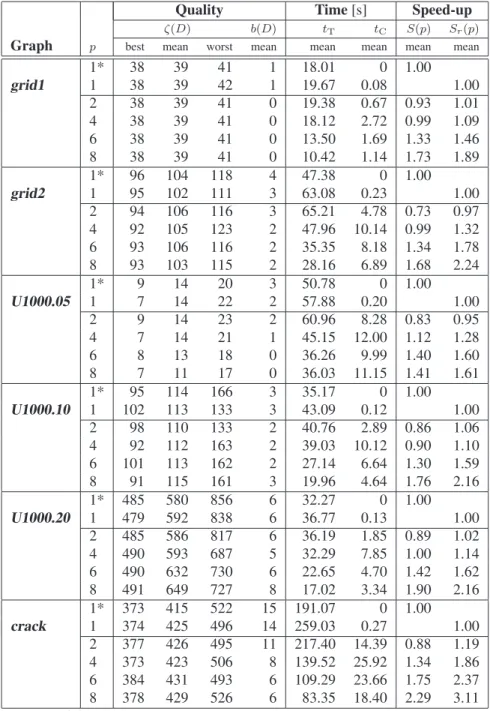
Results in in Table 3 and Table 4 summarize the per-formance of SIDMACA for solving 2-partitioning and 4-partitioning graph problem, respectively, on the given graph set.
General observation is that parallel performance of the system w.r.t speed-up over the serial MACA is poor com-pared to the theoretical expected speed-up ofpwhen used p processors, having maximal speed-up of 2.29 (graph
crack,p= 8) in case of 2-partitioning problem and max-imal speed-up of 2.72 (graphU1000.05,p= 8) in case of 4-partitioning problem overall considered graphs and par-allel scenarios (p = 2,4,6,8). For more then 2 proces-sors employed S > 1 (except for the graph U1000.10, p = 4, k = 4), while for 2-processor parallelization of the problems is evident speed-down up to 27% in case of 4-partitioning of graphgrid2. On the other side, results on SIDMACA show overall comparable/improved quality of the obtained solutions. The best solutions found in case of 2-partitioning are equal or better then the best serial code produced solutions (except for graph U1000.10, p = 4 andcrack,p = 6). Moreover, the worst solutions found by SIDMACA are better than the ones from the MACA on theU1000 graph set and crack graph. When solved the4-partitioning problem, best found solution better than the best ones from the serial code are observed for graphs:
grid2,U1000.05 andU1000.10. The remark on the bet-ter quality of the worst case found solutions is confirmed in case of graphs U1000.10, U1000.10 and partially for graphsgrid2,U1000.05 andcrack.
Quality Time[s] Speed-up
ζ(D) b(D) tT tC S(p) Sr(p)
Graph p best mean worst mean mean mean mean mean
1* 18 18 18 0 9.80 0 1.00
grid1 1 18 18 18 0 10.03 0.10 1.00
2 18 18 18 0 10.41 0.69 0.94 0.96
4 18 18 19 0 10.00 2.67 0.98 1.00
6 18 18 21 0 7.17 1.75 1.37 1.40
8 18 19 21 0 5.60 1.44 1.75 1.79
1* 35 44 68 0 20.37 0 1.00
grid2 1 34 41 68 0 23.81 0.21 1.00
2 35 40 69 0 23.28 1.58 0.88 1.02
4 35 40 69 0 15.86 2.99 1.28 1.50
6 35 41 70 0 11.73 2.51 1.74 2.03
8 35 49 70 0 9.31 2.22 2.19 2.56
1* 1 1 2 0 87.53 0 1.00
U1000.05 1 1 1 3 0 88.80 0.39 1.00
2 1 1 2 0 83.10 1.81 1.05 1.07
4 1 1 1 0 60.86 4.54 1.44 1.46
6 1 1 1 0 42.15 6.09 2.08 2.11
8 1 1 1 0 32.19 6.16 2.72 2.76
1* 50 62 78 1 14.49 0 1.00
U1000.10 1 39 62 73 1 15.03 0.17 1.00
2 40 59 76 1 14.97 1.16 0.97 1.00
4 40 59 71 1 11.88 2.57 1.22 1.27
6 50 61 72 1 8.72 1.95 1.66 1.72
8 57 61 72 1 7.12 1.76 2.04 2.11
1* 221 277 370 8 12.14 0 1.00
U1000.20 1 221 256 337 6 13.03 0.15 1.00
2 219 259 373 7 12.48 0.99 0.97 1.04
4 219 266 369 7 10.67 2.51 1.14 1.22
6 219 288 368 10 7.75 1.75 1.58 1.68
8 219 278 370 9 6.05 1.34 2.01 2.15
1* 185 211 234 1 64.91 0 1.00
crack 1 184 204 277 1 85.02 0.29 1.00
2 184 195 231 0 80.48 6.28 0.81 1.06
4 185 203 246 0 52.25 10.40 1.24 1.63
6 186 202 230 0 39.70 9.25 1.64 2.14
8 185 203 225 0 32.04 8.45 2.03 2.65
* sequential code
Quality Time[s] Speed-up
ζ(D) b(D) tT tC S(p) Sr(p)
Graph p best mean worst mean mean mean mean mean
1* 38 39 41 1 18.01 0 1.00
grid1 1 38 39 42 1 19.67 0.08 1.00
2 38 39 41 0 19.38 0.67 0.93 1.01
4 38 39 41 0 18.12 2.72 0.99 1.09
6 38 39 41 0 13.50 1.69 1.33 1.46
8 38 39 41 0 10.42 1.14 1.73 1.89
1* 96 104 118 4 47.38 0 1.00
grid2 1 95 102 111 3 63.08 0.23 1.00
2 94 106 116 3 65.21 4.78 0.73 0.97
4 92 105 123 2 47.96 10.14 0.99 1.32
6 93 106 116 2 35.35 8.18 1.34 1.78
8 93 103 115 2 28.16 6.89 1.68 2.24
1* 9 14 20 3 50.78 0 1.00
U1000.05 1 7 14 22 2 57.88 0.20 1.00
2 9 14 23 2 60.96 8.28 0.83 0.95
4 7 14 21 1 45.15 12.00 1.12 1.28
6 8 13 18 0 36.26 9.99 1.40 1.60
8 7 11 17 0 36.03 11.15 1.41 1.61
1* 95 114 166 3 35.17 0 1.00
U1000.10 1 102 113 133 3 43.09 0.12 1.00
2 98 110 133 2 40.76 2.89 0.86 1.06
4 92 112 163 2 39.03 10.12 0.90 1.10
6 101 113 162 2 27.14 6.64 1.30 1.59
8 91 115 161 3 19.96 4.64 1.76 2.16
1* 485 580 856 6 32.27 0 1.00
U1000.20 1 479 592 838 6 36.77 0.13 1.00
2 485 586 817 6 36.19 1.85 0.89 1.02
4 490 593 687 5 32.29 7.85 1.00 1.14
6 490 632 730 6 22.65 4.70 1.42 1.62
8 491 649 727 8 17.02 3.34 1.90 2.16
1* 373 415 522 15 191.07 0 1.00
crack 1 374 425 496 14 259.03 0.27 1.00
2 377 426 495 11 217.40 14.39 0.88 1.19 4 373 423 506 8 139.52 25.92 1.34 1.86 6 384 431 493 6 109.29 23.66 1.75 2.37
8 378 429 526 6 83.35 18.40 2.29 3.11
* sequential code
Graph p best mean worst mean mean mean mean mean mean
1* 18 18 18 0 9.80 0 0 1.00
grid1 1 18 18 18 0 44.79 34.45 0.11 1.00
2 18 18 18 0 37.61 17.87 1.54 0.26 1.19
4 18 18 18 0 18.86 8.26 3.01 0.52 2.38
8 18 18 18 0 11.83 5.01 3.00 0.83 3.79
1* 35 44 68 0 20.37 0 0 1.00
grid2 1 35 45 69 0 143.34 118.24 0.29 1.00
2 34 42 68 0 92.74 56.55 9.08 0.22 1.55
4 35 39 53 0 52.29 26.57 13.44 0.39 2.74
1* 1 1 2 0 87.53 0 0 1.00
U1000.05 1 1 1 2 0 463.82 373.45 0.32 1.00
2 1 1 2 0 295.38 190.25 41.64 0.30 1.57
4 1 1 2 0 182.04 90.89 61.65 0.48 2.55
1* 50 62 78 1 14.49 0 0 1.00
U1000.10 1 39 60 76 1 44.47 27.11 0.20 1.00
2 39 63 77 1 30.27 11.54 4.58 0.48 1.47
4 40 59 71 1 21.16 6.63 4.77 0.68 2.10
8 40 59 70 1 14.73 4.45 4.32 0.98 3.02
1* 221 277 370 8 12.14 0 0 1.00
U1000.20 1 219 268 373 7 24.41 11.23 0.15 1.00
2 219 272 371 8 21.83 5.43 2.58 0.56 1.12
4 219 255 368 7 16.48 2.77 3.92 0.74 1.48
8 235 262 308 5 10.65 1.73 3.14 1.14 2.29
1* 185 211 234 1 64.91 0 0 1.00
crack 1 184 191 262 0 312.25 205.08 0.42 1.00
2 184 189 211 0 223.60 95.82 57.03 0.29 1.40 4 184 187 207 0 150.94 48.21 63.33 0.43 2.07 * sequential code
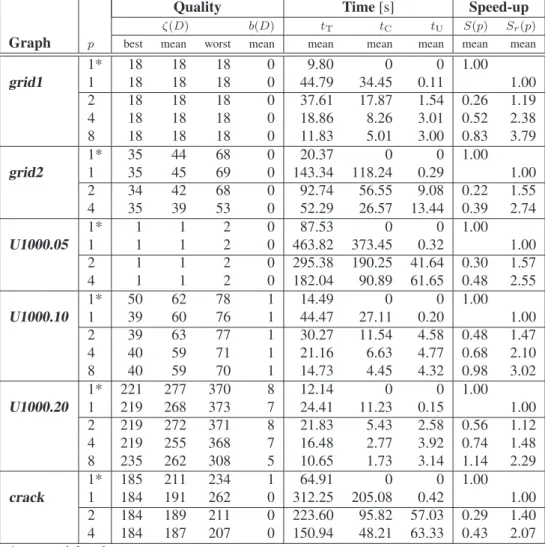
Table 5: Experimental results:2-partitioning problem with ItDMACA
The results show no speed-up in case of 2-processor and4-processor parallelization. Speed-upS ≥ 1 is evi-dent when8 processor applied on the graphs for solving the4-partitioning problem and for2-partitioning of graphs
U1000.10,U1000.20. Speed-down and low speed-ups are due to the big amount of time spent on communication and memory updates (synchronizations) during level op-timization activities. The performance of ItDMACA w.r.t the quality of obtained solutions confirms the observation from the SIDMACA results. More specifically for the 2 -partitioning problem, equal partition solutions in all runs are obtained for graphsgrid1andU1000.05, while signifi-cant improvement is evident for theU1000.10, and slightly better solution for the rest of the graphs.
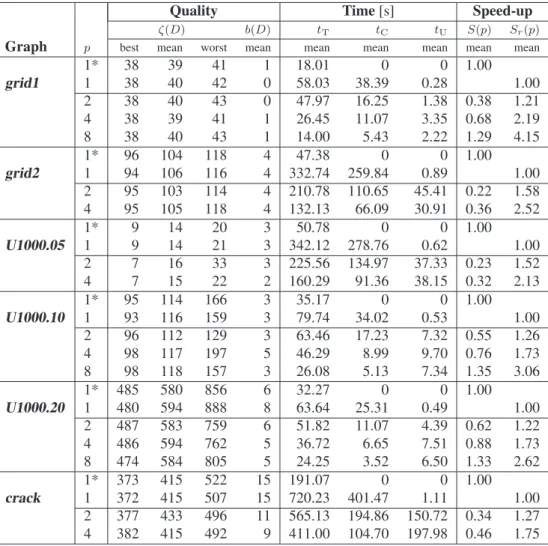
In general, comparable or improved solution quality is observed in the case of solving the4-partitioning problem with ItDMACA as well. For p = 8, we gain speed-up and (i) better solution for graphU1000.20, (ii) equal best found solution for graphgrid1, (iii) comparable solutions for graphU1000.10.
As expected, the results on relative speed-upSr(p)are
better than the speed-upS(p)results. How big this
differ-ence is, is dependent on the size of the problem and algo-rithm implementation. Consequently, for SIDMACA the difference is not significant (except for graph grid2 and
crack) compared to the ones in the ItDMACA, which in case of the grid2 graph yields7 times higherSr(p)than
S(p). This difference reveals that ItDMACA suffers from communication/update overhead, which for specific prob-lems could be disadvantageous.
Additional experiments are needed in order to confirm the conclusions drawn from the initial experimental evalu-ations results, based on small number of processing nodes and a small set of graphs. There is a large space with pos-sible directions for further work, such as:
– application on additional new graph problems, spe-cially large and complex ones,
– try to solve the partitioning problem with more than 8 processors in parallel and find how the number of processors influences the solution quality and speed-up,
Quality Time[s] Speed-up
ζ(D) b(D) tT tC tU S(p) Sr(p)
Graph p best mean worst mean mean mean mean mean mean
1* 38 39 41 1 18.01 0 0 1.00
grid1 1 38 40 42 0 58.03 38.39 0.28 1.00
2 38 40 43 0 47.97 16.25 1.38 0.38 1.21
4 38 39 41 1 26.45 11.07 3.35 0.68 2.19
8 38 40 43 1 14.00 5.43 2.22 1.29 4.15
1* 96 104 118 4 47.38 0 0 1.00
grid2 1 94 106 116 4 332.74 259.84 0.89 1.00
2 95 103 114 4 210.78 110.65 45.41 0.22 1.58
4 95 105 118 4 132.13 66.09 30.91 0.36 2.52
1* 9 14 20 3 50.78 0 0 1.00
U1000.05 1 9 14 21 3 342.12 278.76 0.62 1.00
2 7 16 33 3 225.56 134.97 37.33 0.23 1.52
4 7 15 22 2 160.29 91.36 38.15 0.32 2.13
1* 95 114 166 3 35.17 0 0 1.00
U1000.10 1 93 116 159 3 79.74 34.02 0.53 1.00
2 96 112 129 3 63.46 17.23 7.32 0.55 1.26
4 98 117 197 5 46.29 8.99 9.70 0.76 1.73
8 98 118 157 3 26.08 5.13 7.34 1.35 3.06
1* 485 580 856 6 32.27 0 0 1.00
U1000.20 1 480 594 888 8 63.64 25.31 0.49 1.00
2 487 583 759 6 51.82 11.07 4.39 0.62 1.22
4 486 594 762 5 36.72 6.65 7.51 0.88 1.73
8 474 584 805 5 24.25 3.52 6.50 1.33 2.62
1* 373 415 522 15 191.07 0 0 1.00
crack 1 372 415 507 15 720.23 401.47 1.11 1.00
2 377 433 496 11 565.13 194.86 150.72 0.34 1.27 4 382 415 492 9 411.00 104.70 197.98 0.46 1.75 * sequential code
Table 6: Experimental results:4-partitioning problem with ItDMACA
and local memory updates,
– how statistically significant is the difference in the per-formances of the proposed parallel implementations among them or/and vs. the sequential MACA algo-rithm.
5 Conclusions
An efficient parallelization of a given algorithm depends mainly on the available computing platform, the underlying problem and the algorithm itself. If there is a large com-munication overhead between the processors, then parallel performance can be degraded. When the algorithms uses global structures, such as the pheromone matrix or the grid matrix of2–3trees in MACA case, a shared memory sys-tem would gain on communication (less) over a distributed memory system. On the other hand, the most common and cheaper approach in the same time is a parallelization using distributed memory systems, i.e., MIMD architecture such as cluster of workstations.
In this paper, two distributed MACA versions were
pre-sented, Semi-Independent and Interactive, implemented on a cluster of workstations. The initial experimental eval-uations confirms that parallelization efficiency is problem dependent. Overall, both approaches show comparable or better (stable) quality performance. While ItDMACA is more sensitive on the parallel performance efficiency, due to the synchronization overhead, SIDMACA can obtain same or better quality for less computational time, which is gain on both scales: quality and cost.
In order to see how significant is this improvement and how robust is this approach additional experimental anal-ysis regarding different problem type (large and complex) and experiment setup should be performed.
References
[1] A. Bahreininejad, B.H.V. Topping, and A.I. Khan. Finite Element Mesh Partitioning Using Neural Net-works.Adv. Eng. Softw., 27(1-2):103–115, 1996.
[3] M. Blondi and M. Bondanza. Parallelizzazione di un Algoritmo per la Risoluzione del Problema del Commesso Viaggiatore. Master’s thesis, Politecnico di Milano, 1993.
[4] R.D. Cook, D.S. Malkus, M.E. Plesha, and R.J. Witt.
Concepts and Applications of Finite Element Analy-sis. John Wiley & Sons, 2001.
[5] M. Dorigo, G. Di Caro. The Ant Colony Opti-mization Meta-Heuristic. In D. Corne, M. Dorigo, and F. Glover, editors, New Ideas in Optimization, McGraw-Hill, 1999.
[6] M. Dorigo. Optimization, Learning and Natural Algo-rithms. PhD Thesis, Dipartimento di Elettronica, Po-litecnico di Milano, 1992.
[7] C.M. Fiduccia and R.M. Mattheyses. A Linear Time Heuristic for Improving Network Partitions. InProc. 19th IEEE Design Automation Conf., Las Vegas, NV, 1982, pages 175–181.
[8] Graph Collection.wwwcs.uni-paderborn.de/ cs/ag-monien/RESEARCH/PART/graphs. html.
[9] B. Hendrickson and R. Leland. A Multilevel Algo-rithm for Partitioning Graphs. In Proc. ACM/IEEE Conf. Supercomputing, San Diego, CA, 1995.
[10] P. Kadłuczka and K. Wala. Tabu Search and Genetic Algorithms for the Generalized Graph Partitioning Problem.Control Cybern., 24(4)459–476, 1995.
[11] G. Karypis and V. Kumar. Multilevel k-way Partition-ing Scheme for Irregular Graphs. J. Parallel Distr. Com., 48(1):96–129, 1998.
[12] B.W. Kernighan and S. Lin. An Efficient Heuristic Procedure for Partitioning Graph.Bell Sys. Tech. J., 49(2)291–307, 1970.
[13] A.E. Langham and P.W. Grant. Using Competing Ant Colonies to Solve k-way Partitioning Problems with Foraging and raiding strategies.Lect. Notes Comp. Sc., 1674:621–625, 1999.
[14] P. Korošec, J. Šilc, and B. Robiˇc. Solving the Mesh-partitioning Problem with an Ant-colony Algorithm.
Parallel Comput., 30(5-6):785–801, 2004
[15] M. Randall and A. Lewis. A Parallel Implementation of Ant Colony Optimization.J. Parallel Distr. Com., 62(9):1421–1432, 2002.
[16] T. Stützle. Parallelization Strategies for Ant Colony Optimization.Lect. Notes Comp. Sc., 1498:722–741, 1998.