{From Wood 'n' Energy, October 1986)
TABLE OF CONTENTS
Missoula Montana: Inversion Conditions... ii
List of Tables, Figures, and Appendices... iv
Glossary... . vii
Introduction... 1
Chapter I. Emissions from Wood Heat Devices... 6
Woodstove Usage... 6
Emission Concerns... 15
Affected Groups... 27
Chapter II. Existing RWC Emission Abatement
Programs... 31
Federal Controls... 31
State Controls... 42
Local Controls... 52
Observations... 57
Chapter III. Policy Objectives and Control Alternatives... 59
Policy Objective Considerations... 60
Methods of Emission Control... 66
Methods Compared with Decision Factors... 7 3
Alternatives for EPA Action... 76Chapter IV. Inapplicability of Traditional
EPA Rulemaking Procedures... 78
Chapter V. Environmental Mediation and the EPA... 82
Chapter VI. Applicability of a Negotiated
Regulation to RWC... 91
Chapter VII. The Rulemaking: Pre-negotiation Status... 9 7
Chapter VIII. The Negotiations... 104
Procedural Discussion... 104
The First Session... 105
The Second Session... 110
The Third Session... 113
The Fourth Session... 116
The Fifth Session... 122
The Sixth Session... 127
Chapter IX. Comments on the Role of OMB... 133
Chapter X. Comments on Interviews with Woodstove Manufacturers... 142
Chapter XI. Summary and Conclusions... 145
Bibliography... 152
#
Page
Figure 1
-Annual and Cumulative US Sales of ,
Residential Wood-Burning Devices (Nero 1984)... 8
Table 1 - ͣ '
RWC Emissions Estimates (Nero 1984)... 9
Figure 2
-Statewide Average per Household Wood Usage (Nero 1984).. 10 Table 2
-Fuel Wood Consumption Characteristics by State,
1980-81 (Nero 1984)... 12
Table 3
-Statewide RV^C Wood Use Estimates from US DOE and
the USDA Forest Service (Nero 1984)... 14
Figure 3
-Industrial and Residential Particulate Emissions:
Portland, Oregon (Tombleson 1984)... 16 Table 4
-Emission Inventory for Winter Season
Missoula, Montana (Nero 1984)... 17 Table 5 - Summary of Data from Missoula, Montana Study
(Carlson 1980)... 18 Figure 4 (Map)
-Areas . . . Having Known or Suspected RWC Impacts
(Nero 1984)... 20
Figure 5 (Map)
-Frequency of Occurrence of RWC Impacts (Nero 1984)... 21 Table 6
-Estimated Heating Season and Non-Heating
Season BaP Emission Rates in New Jersey (Harkov 1985)... 24
F igure 6
-Plot of Degree Heating Days, -Plot of Average
BaP Concentrations (Harkov 1985)... 25
Table 7
-Percentage of Households Using Different
Wood-Burning Equipment by Demographic Group, 1980-80
(Wood 'n' Energy March 1984)... 28
LIST OF TABLES, FIGURES, AND APPENDICES
(continued)
Page
Table 8
-Control Element - Party Incurring Cost
(CONEG 1984)... 30
Table 9
-National Ambient Air Quality Standards
(Cooper 1982)... 32
Table 10
-Proposed CAA Particulate Standards
(Federal Register 1984)... 34
Table 11
-Major Pollutant Emissions from Residential Wood Combustion Compared to Emissions from
Other Sources (Cooper 1982)... 36
Table 12
-Emissions of Major Pollutants from RWC
Sources (Cooper 1982)... 37
Table 13
-Emissions of Annual POM Emission by Source
Type on a National Basis (CONEG 1984)... 39
Figure 7
-State-by-state Emissions Update
(Wood 'n' Energy August 1984)... 44
Table 14
-Comarison of Oregon and Colorado Standards
(Gay 1986)... 48
Table 15
-Control Strategy Elements in Use/Proposed
(Weigold 1984)... . 67
Table 16
-Control Options vs. Decision Factors... 74
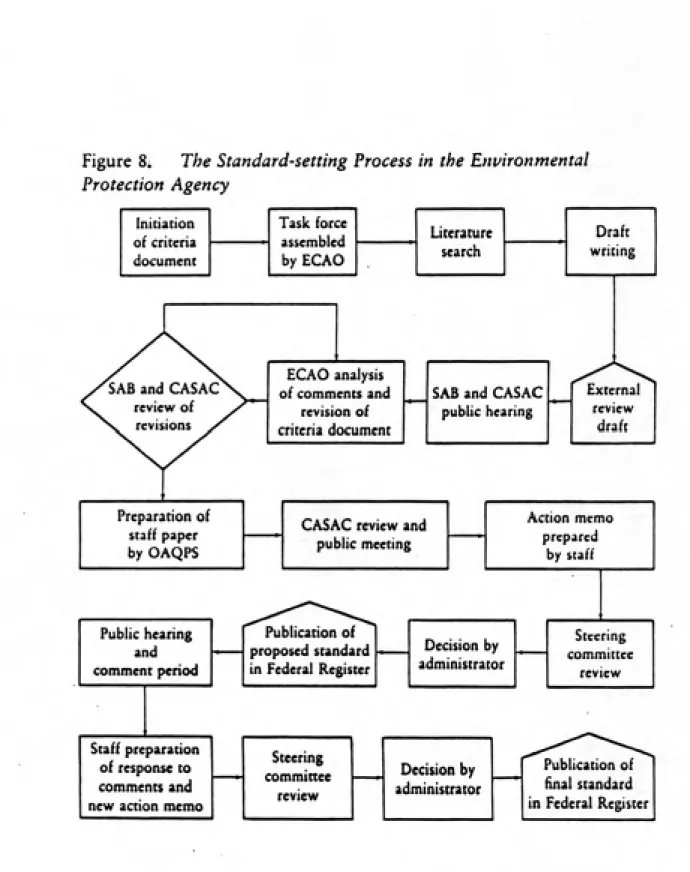
Figure 8
-The Standard-Setting Process in the
Environmental Protection Agency (Melnick 1983)... 80
Table 17
Page
Table 18
-Tentative Reg-Neg Schedule... 106
Table 19
-Comparison of Regulatory Approaches... 118
Table 20
-RWC Issues Versus Negotiation Sessions... 132
Appendix 1
-Reg-Neg Legal Committee Draft (US EPA 1986)... 1-53
Appendix 2
-Oregon DEQ Certified Woodstoves... 1-5
GLOSSARY OF TERMS ANPR AS BACT BaP BATNA BDT BTU CAA CASAC CMB CONEG EAB EPA ESED g HAP HC HI J kg NAAQS NAPCTAC NCP NESHAP -
NONO^
NRDC NSPS OAQPS 0MB PMIO POM RegNeg RWC-SIP - .
STAPPA-ALAPCO
TSP ug WHA
-Advance Notice of Proposed Rulemaking Air Stagnation
Best Achievable Control Technology
Benzo(a)pyrene
Best Alternative to a Negotiated Agreement
Best Demonstrated Technology
British Thermal Unit
Clean Air Act (42 U.S.C. 7401 et seq.) Clean Air Scientific Advisory Committee
Chemical Mass Balance
Coalition of New England Governors Economic Analysis Branch, OAQPS, EPA U.S. Environmental Protection Agency
Emission Standards and Engineering Division
OAQPS, US EPA
Grams
Hazardous Air Pollutant Hydrocarbons
High Impact
Joules - a unit of heat K ilograms
National Ambient Air Quality Standard
National Air Pollution Control Techniques
Advisory Committee
Nonconformance Penlal
National Emission Standard for Hazardous Air
Pollutants
Oxides of Nitrogen Nitrogen Dioxide
National Resources Defense Council New Source Performance Standard
Office of Air Quality and
Standards-Office of Management and Budget
Particulate Matter less than 10 micrometers
diameter
Polycyclic Organic Material Regulatory Negotiation
Residential Wood Combustion
State Implementation Plan
State and Territorial Air Pollution Program
Administrators-Association of Local Air
Pollution Control Officers
Total Suspended Particulates
Micrograms
Wood Heating Alliance
Introduction
As I write this introduction, EPA and interested
parties are near culminating what, if successfully
implemented, will be the first truly negotiated new source performance standard (NSPS). When I began my investigation into the residential wood combustion (RWC) emissions problem in early 1985, EPA had been less actively investigating the subject for at least ten years. One EPA employee at that time felt it would be 15 years before EPA set a RWC-NSPS. My initial investigations and recommendations for action were based on the traditional "safe track" approach EPA has adapted to avoid court and/or internal challenges. My
recommendations had followed basically a national ambient air quality standard (NAAQS) approach to the RWC emission problem and had called for an improved and centralized data base for RWC NAAQS contribution as well as calling for a coordinated EPA and state research and development (R&D) program for stove improvement and testing procedures.
There- were forces at play, however, that would cause
EPA to amend its usual rulemaking procedures. By May 1985 EPA's Office of Air Quality Planning and Standards (OAQPS)
Rulemaking (ANPR) for high level EPA review. When the
notice was published in the Federal Register in August 1985,
it announced that EPA would seek an expedited rulemaking which would result in a regulation "two years sooner than under the Agency's traditional standard-development process"
(Federal Register, August 2, 1985, p. 31505) and a good deal sooner than many would have anticipated.
EPA's RWC interest had reportedly been accelerated when Assistant Administrator for Air and Radiation, Joseph A. Cannon, was introduced to Missoula, Montana emissions by
Senator Max Baucus on a particularly bad inversion day in the winter of 1984. Cannon promised to look into the issue and set up a wood smoke advisory committee. The call for an expedited NSPS, however, went beyond the recommendations that the wood smoke committee reported to Cannon in November
of 1984. Although there was no mention of it in the ANPR, EPA was in fact already engaging in court negotiations
concerning polycyclic organic material (POM) emissions, RWC being the major source. Although the final
#
The State of New York and NRDC brought suit in August 1984 for EPA's failure to regulate POM, a large class of
often carcinogenic material. Agreement was reached after eighteen months of out of court negotiations. The final
ruling required EPA to propose standards for wood smoke
emissions no later than January 1, 1987 and promulgate
standards by January 1, 1988 (NRDC 1986). (The ruling also
required EPA to propose a schedule for regulating waste
incinerators and to study toxic emissions from fossil-fueled boilers. Diesel exhaust, the remaining large source of POM
agreed to consider the NRDC's suggestion that EPA employ mediated negotiations with the Wood Heating Alliance (WHA), a woodstove industry voice, and other interested parties in order to promulgate an RWC regulation in the shortest
reasonable time period.
As pointed out by Conservation Foundation principal
Gail Bingham (Bingham, 1986), mediation may not always be the best way to handle environmental disputes. There are, however, many aspects of the RWC emission scenario which
seem to lend themselves to this method.
This paper has five purposes:
(1) To report on the technicalities of the RWC
emission issue.
(2) To enumerate the various factors which must
be considered in an RWC emission regulation. (3) To report on the use of regulatory negotiation,
and how this differs form normal EPA rulemaKing
procedures.
(4) To show how negotiation is particularly applicable to an RWC regulation.
(5) To examine the thesis that a negotiated regulation was an appropriate alternative by reporting on how
2
State of New York v. Lee M. Thomas and Natural
Resources Defense Council (NRDC) v. Alvin L. Aim, First
various specific issues were resolved in the six regulatory negotiation (reg-neg) committee
meetings held monthly from March to August 1986.
Chapters 1 and 2 present the background of the RWC
emission problem and the attempts by various states and localities to find solutions. Chapter 3 examines these
solutions and how they affect the different concerns
introduced in chapter 1. It also presents a model for
decision analysis that could be used (with refinement) for optimizing an RWC strategy. Chapters 4 and 5 introduce the concept of environmental mediation and describe EPA's
growing interest in regulatory negotiation or, more
specifically, negotiated rulemaking (see footnote 10, p. 83)
Chapter 6 explains how RWC emission regulation is a suitable
candidate for negotiated rulemaking. An analogy is drawn
with the multi-objective decision analysis described in chapter 3 showing how mediation is a logical forum to
formulate an optimal solution - in this case an NSPS - when affected parties have differing agendas - i.e. multiple objectives. Chapters 7 and 8 describe the preparations and
the negotiations both chronologically and by issue. It is intended that the reader may gain a sense of the negotiation process itself - how positions developed and how they
compromised. Chapter 9 comments on the less obvious agendas of several participants. Special attention is given to the
critical to reg-neg's future as a viable alternative to
traditional adversarial or adjudicatory rulemaking
procedures. The role of the Wood Heat Alliance (WHA) as an
appropriate representative of the woodstove industry is examined in chapter 10 with an analysis of interviews with
stove manufacturers. Finally, chapter 11 presents
conclusions on the negotiations and comments on negotiated rulemaking in general.
In the course of this investigation I have attended all
but the first two negotiation meetings to observe the
dynamics of the interchange. I have also interviewed twenty woodstove manufacturers - primarily from the Southeast - as
well as members of the reg-neg committee and others who have become involved. I will attempt to show that the issues
involved in the RWC emission problem logically require that
many interests be represented - that it is perhaps a perfect
candidate for a negotiated regulation if the criterion for
success is reaching an agreed-upon standard. Other criteria exist, however, and in the long run court challenges and/or public opinion may present opposing evidence.
Tables and figures will follow the page in which they
are first referred. The appendices follow the bibliography.
Appendix I is a draft of the NSPS final reg-neg agreements.
This may be amended before official EPA publication in the
CHAPTER I
EMISSIONS FROM WOOD HEAT DEVICES:
"DOESN'T IT BOTHER ANYBODY THAT IT'S PART OF OUR
AMERICAN HERITAGE TO SIT DOWN^IN FRONT OF A
CRACKLING FIRE?"
The precipitous increase in foreign oil prices of the early 1970s resulted in many changes in energy use patterns in the United States. One striking change in many areas was a rapid increase in the use of residential wood combustion (RWC) for home heating. Although RWC had been a primary
source for some rural and/or lower income sectors, and had been gradually declining in this century, the 1970s
witnessed an increase in RWC use across almost all demographic groups.
WOODSTOVE USAGE
It is estimated that 7 to 8 million new wood stoves
were sold between 1974 and 1984. In Vermont, a 1981 survey indicated that wood was used as the primary source of heat
in more single family households than was electricity,
natural gas, kerosene, coal, and wood and was secondary only
to oil (Peterson 1984, Loh 1984, Roper 1984). Lipfert (1983)
3
Medora Lile, President, Woodburners United of Missoula
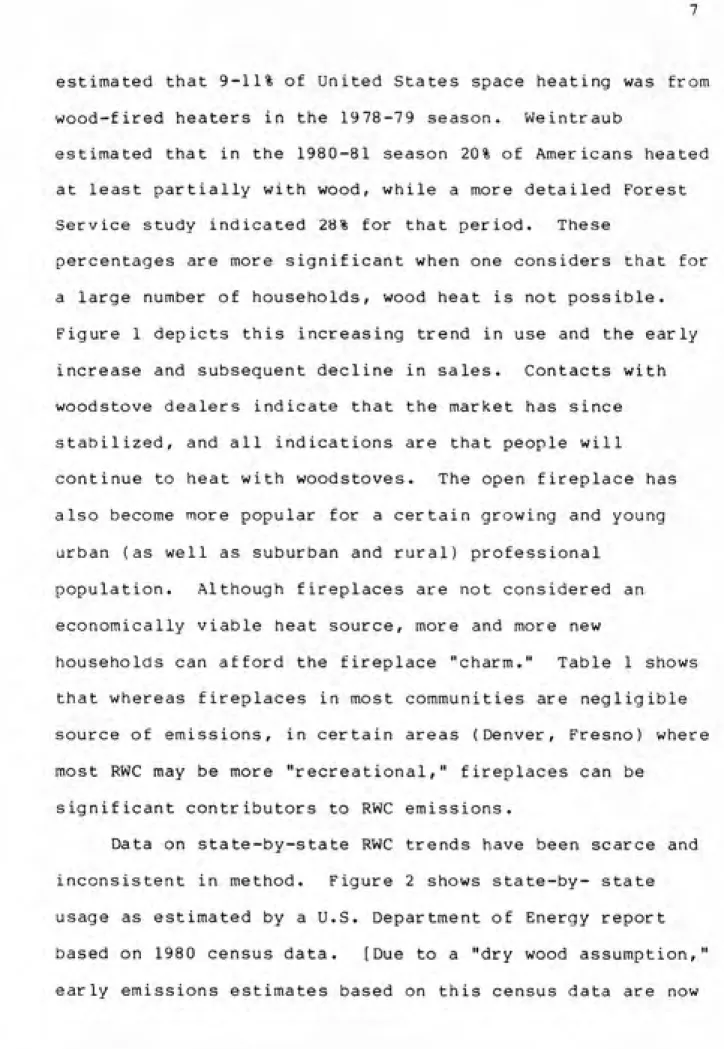
wood-fired heaters in the 1978-79 season. Weintraub
estimated that in the 1980-81 season 20% of Americans heated
at least partially with wood, while a more detailed Forest
Service study indicated 28% for that period. These
percentages are more significant when one considers that for a large number of households, wood heat is not possible. Figure 1 depicts this increasing trend in use and the early increase and subsequent decline in sales. Contacts with
woodstove dealers indicate that the market has since
stabilized, and all indications are that people will
continue to heat with woodstoves. The open fireplace has also become more popular for a certain growing and young
urban (as well as suburban and rural) professional
population. Although fireplaces are not considered an
economically viable heat source, more and more new
households can afford the fireplace "charm." Table 1 shows that whereas fireplaces in most communities are negligible
source of emissions, in certain areas (Denver, Fresno) where
most RWC may be more "recreational," fireplaces can be
significant contributors to RWC emissions.
Data on state-by-state RWC trends have been scarce and
2,000,000 [_
Annual
U.S. SalesI
of
Uood-Bumlng
Devices
(Units)
1,000,000 |_
Annual
Sales Cumulative Total Sales
(1972-1982)
1972 1973 1974 1975 1976 1977
Year
1978 1979 19'80 1981
Source: U.S. Census (1972-d2)
Figure 1, Annual and Cumulative U.S. Sales of
Residential Wood-Burning Devices. 1972-82
J 10.000,000
Cumulative
Total Annual U.S. Sales of
Wood-Bum Ing
Devices
(Units)
_| 5,000.000
UGEND:
Annual Sales
Cumulative
Total Sales,
1972-1982
19'82
Locality, State Date
Cord Total RWC TSP Emissions RWC CO Emissions
Wt HHs Stoves Frplc Total Per Stoves Frplc Totl Per
kg/ 1000s 1000 1000 1000 lb/ 1000 1000 1000 lb/
cord T/Yr T/Yr T/Yr HH/Yr T/Yr T/Yr T/Yr HH/Yr
Waterbury, VT
Western MA
Nashville, TN Petersville, AL
Minneapolis, MN Albuquerque, NM
Missoula, MT
Denver, CO
Telluride, CO
Reno, NV
Las Vegas, NV
Fresno, CA
Boise, ID Portland, OR Medford, OR
Eugene, OR
Yakima, WN Spokane, WN Anchorage, AK
1980/81 1983/84 1981/82 1980/81 1979/80 1980 1982/83 1983/84 1983/84 1983/84 1983 1981/82 1983/84 1983 1983 1981/82 1982/83 1980/81 1982/83 1497 955 1438 14 38 1815 1100 1489 1100 1100 1011 1100 1815 N/A 1588 1588 N/A 1588 1444 0.647 281 178 1*2 721 151 23 567 0.671 62.6 103 96 60 38 6 42
1800 70
21 .4 70.9 55.2 .029 .429 1.74 N/A 8.48 1.565 2.65 .023 .442 N/A .036 N/A 6.51 1.58 2.18 N/A .961 N/A .002 N/A .47 N/A 1.76 .725
.465-
.064-.939 .128
4.13 .001 .307 0.1 1.17 N/A 2.52 .29 .68 N/A 2.11 N/A
.031 96 .179 .013
N/A N/A N/A N/A
2.21 25 10.76 2.87
N/A N/A N/A N/A
10.25 28 52.5 10.7
2.29 30 9.69 4 .40
.192 594 N/A N/A 13.63 154 N/A N/A 63.2 175 14.09 174 .529-
46-1.07 93
2.88- .386- 3.27- 284-5.81 .779 6.59 573
6.78 24 16.42 25.05 41.46 146
.024 71 .142 .006 .148 440
.749 24 2.737 1.863 4.6 147
N/A N/A N/A N/A N/A N/A
1.20 25 .221 7.07 7.29 152
N/A N/A N/A N/A N/A N/A
9.04 47 40.31 15.32 55.63 289
1.87 89 9.75 1.77 11.52 549
2.87 82 13.50 4.16 17.66 505
N/A N/A N/A N/A N/A N/A
3.07 86 5.95 12.79 18.74 528
N/A N/A N/A N/A N/A N/A
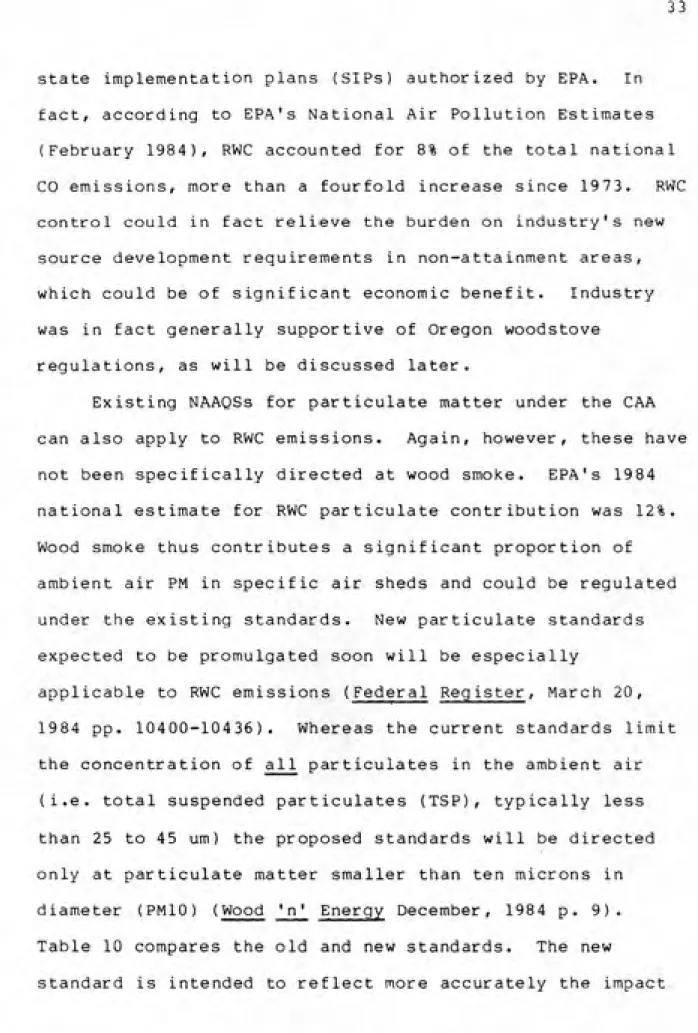
Figure 2. Statewide Average per Household Wood Usage, From U.S. Department of Energy Estimates
upon which NEDS Is Based
r/
0
felt to be as much as 25% low (Nero 1984).] A national wood usage telephone survey by the USDA Forest Service in 1980-1981 provided what may be the best available estimate of state-by-state total wood burned. Table 2 gives the results of the Forest Service study and Table 3 compares the two
studies. Per household, usage was highest in the Pacific Northwest and in Northern New England. Data such as these are typical of most of those available in that they do not
accurately point out local problems. For example, in 1983
the head of the Western Massachusetts Department of
Environmental Quality Engineering David Howland identified
wood burning as the greatest source of air pollution in
Western Massachusetts (New York Times, December 8, 1983)
although Massachusetts shows a relatively moderate .52 cords per household in the Forest Service study. Moreover,
woodstove emission problems are not limited to the Northeast or the Northwest. Other areas such as the resort areas of
the Rocky Mountains have concentrations of RWC use. Perhaps surprisingly, the Southeast contains 39% of the wood heating
devices and accounts for 32% of the wood burned (DeAngeles
et al., 1980). Approximately 16% of North Carolina
households used wood as their main home heating fuel in 1981
J3 00 I o 00 U H < H W X BQ cn u M W k: u o < a: < z o M E-i 04 T. W z o u a o o 3 u D Cl,
0) r-( tn
OiTJ -1 "O 10 0) (0 i-l ;j c 0 (U u U £ > 3 <U 0)
< ^ > (fl 0 3 O £
rH T3 nj 0) cn <B 4J C c u o u
ͣ
H 0 H 3
C £ J2
^ 3 tl
n 0 m 'O IQ 0) -a ij ^ c -H 0 a> u o o > 3
£ < n
(U m
W V,
3 rH
O
X
9P c
rH T3
u 10 (U
c ͣU C
3 0 U o H 3 £ ia 10 >, c 10 0) cn-o cn (0 v
c u c
-iH 0) u
c > 3
^ < XI 3 J3 </] ͣ o CT -H C 0 * ^J
£ J2 0)
0)
3 U
0 0) 73 X i2 r-l e i=
3 U)
z x: a 10 (fl 0 u c o w r-< U -H 0 10 o u c o to ^r^ •a —1 o Ul o o (fl c o in
M ^ r~ o O CS fO ͣv
r^ a> •-I 3> 'J' rt ro CM po ^
ro ro rM vo r*
I >-t ro vn in \a
I • • I 12
in m po r~ (N 00 1* ro ^
^ rH Ol VO in »-| rH
ve r- ro in 00 ^ oo O I rH
*-H r^ vc a^ ^ 00 in .^ o\ V ro ^ r~ ^
^ CO in CO r*^ 00 •^ o r- (J>
^H »-< I rH I I
ooflomcoooveincN'^'^coincNijN inr»-i-irootN"-ioo^'^kecN^r~
CN <• in ffi fN
Ol ^ CM r-( •-( i-l i-C
I
i-lrHmcM(S{N(Nc>l(NTr^CNrMcN I (NCS I CN
r~ rt <N ^ ^ rsi
<N rH ^ .H CN CN I Oi-toovoi-Hf^oorOffiONOrnpominf^r-t iI rHfsjrOrHCNpHiHCN ^CNCNfMCMCNCNrO I
kO in ,). <T, ^ 1 1 CN fO ON 00 ^o 1 1 1 1 T <Tl t^ (5\ ve n vo 1
(~ CO CO cn « 1 1 ve r^ m in CO 1 i 1 1 CO T o r~ (Ti CM CN 1
•"HOOVOvOin^v I r OOO'^WOrOCTlOf^fMVO'H'-ICN I CNTT ooi^r-oro I I >*^kor»ffiaiflomcooNinoo(Nff> I a\ ^
CN (N r-t ^ r-(rHCNr-|r-(rtrHCN"-lcni-li-(fNr>t i-lCN
CN
CO^fN»inoa> I '-lOO^OCNrOrH'^
CN CN ^ CN ro m CN I - -•---. -. ~.oo^ocNropH'^y3ro^>-i9\ininr-kOco^ ICNTCNCNCN«NCNrHinfNCNCN(»ieN(»irOi-l I
^(»i'Hroo>M't~-c*i'^CNrOrHvo^oOTr<-H(^iap-'^cNOCN>*rMin CNkOf^^Olno^Oln^^^cNlnc*^ln^*lO(No^^cNa^^'*^a^oo^^o roi5\covooocNCNr~ooroo(J>ooo<NTj'n^O'H^oor~(Ninro
i-l flOr-li-l rOrH i*i-(rH r-t I-l r^CNCni-H r-i
a
4J
(0 4J ..H
10 3 C 0) Ot
•HOC 10 u) 10 a.
Ul C 0 -H 0) *J U) >,c -O 3 C *J -r* -H (0
loiQioi^'O'i-'i^ai'oio -Hio j£ 10 ci:ioo''iu'o^
EciflO'Ooioc'a-rt oc to U -rt IOOO>U)Ifl3CU)lO
(aOC>4-i)a(U3-'<-HolOCiO <0 3 W (UrHCO-WD-rtO'O'O'a ^Htti-HOCcoj^UU.C-M-i-1 10 CO 4J •'^ c S^UliCWtflJJUlO
m-HX'H'Hc.-iMOOiOi-i'o 3 C C 3•H u(fiOcinu)CXJ>
FUELWOOD CONSUMPTION CHARACTERISTICS BY
STATE, 1980-81
Households burning Average Households burning any amount 1/3 cord or mor e burned state
over all
Number % Average Total % Average Total households
hshld brng burned burned
brng burned burned
Million Million
Millions Cords Cords Cords Cords Cords
New Hampshire 0.324 47 3.00 0.46 44 3.10
046 1.42
New Jersey 2.551 18 .89 .41 15 1.01 .40 .16
New Mexico .444 43 1.18 .23 33 1.46 —
.51
New York 6.332
18 1.86 2.12 14 2.30 2.06 .33
North Carolina 2.047 46 2.05 1.92 40 2.31 1.90 .94
North Dakota .229 36
1.70 .14 36 1.70 .14 .61
Ohio 3.837
30 1.84 2.09 26 2.07
2.07 .54
Oklahoma 1.114 22 —
.57 19 2.67 .57 .51
Oregon .993 58 2.68 1.55 54 2.87 1.54 1 .56
Pennsylvania 4.213 23 2.25 2.20 19 2.69 = 2.17
.52
Rhode Island .339 25 — —
21 — —
—
South Carolina 1.031 36 1.6 3
.61 30 1.9 4 .60 .59
South Dakota .244 27 3.32 .22 23 3.93 —
.90
Tennessee 1.615
38 2.40 1.47 36 2.50 1.46 .91
Texas 4.945
25 1 .08 1.32 20 1.27 1.28 .27
Utah .448
32 2.03 —
24 2.65 —
—
Vermont .178
58 3.95 .41 52 4.38 .40 2.28
Virg inia 1.857 46 2.06 1.76 42 2.25 1.74 .94
Washington 1.540 53 2.04 1.67 43 2.51 1.65
1.09
West Virginia .687 35 2.67 .64 33 2.82 .64 .94
Wisonsin 1.653
28 2.72 1.28 25 3.04 1.27 .77
Wyoming .166 40 2.19 .14 31 2.72 .14 .87
TaDle 3
14 STATEWIDE RWC WOOD USE ESTIMATES FROM U.S. DOE
AND THE USDA FOREST SERVICE (CORDS/VTEAR; 1980-81)
State U.S. Department of Energy USDA Forest Service
Dry Tons Million Cords Cords Per HH Million Cords Cords Per HH Alabama Ar izona Arkansas California Colorado Connecticut Delaware Washington, DC Florida Georgia Idaho Illinois Indiana Iowa Kansas Kentucky Lou isiana Maine Maryland Massachusetts Michigan Minnesota Mississippi Missour i Montana Nebraska Nevada New Hampshire New Jersey New Mexico New York North Carolina North Dakota Ohio Oklahoma Oregon Pennsylvania Rhode Island South Carolina South Dakota Tennessee Texas Utah Vermont Virg inia Washington West Virginia Wisonsin Wyoming Totals 0 .712 0.189 0 .272 0 .566 0 .569 0 .792 0 .168 0 .015 0 .795 0 .991 0 .399 1 .830 1 .615 0 .171 0 .154 1 .473 0 .382 0 .762 1 .090 1 .085 2 .191 1 .447 0.625 1.777 0 .401 0.091 0 .125 0 .430 1 .112 0.473 2.693 2 .819 0 .034 2.536 0 .874 0 .947 3 .054 0 ,141 0 .626 0 .059 2.089 0 .582 0 .237 0 .347 2 .298 1 .088
0 .9 58
EMISSION CONCERNS
Regardless of the inconsistencies in RWC use data, new
stove sales figures attested to a significant nationwide use
increase. It can also be assumed that there had been a
similar increase in the use of existing stoves as well.
Concurrently, there developed growing concern with potential
health risks associated with RWC. These concerns focused
basically in three areas: ambient air quality standards,
health risks, and indoor air pollution.
Ambient Air Quality Standards
Several communities noted that RWC emissions were a significant factor in meeting U.S. EPA's national ambient air quality standards (NAAQS). In some areas, increased RWC usage was even found to negate gains made in cleaning up
industrial point sources. Figure 3 shows such emission
trends in Oregon. In Missoula, Montana, which is currently
a non-attainment area for both carbon monoxide (CO) and
particulate matter (PM), RWC contributed to 60-70% of winter
PM and 35-50% of winter CO (Weigold 1984 and Table 4).
Since adverse health effects are implicit in NAAQS non-attainment there were also concerns with health. In 1980 a
four-year study concluded that Missoula, Montana's
children's lungs had lower capacities than the average of
other Montana children (Table 5 shows a summary of this
study.) One-half of the 22,000 homes in the Missoula Valley
16
(0
«
a
01
C
o
H
O
(0
•o c
CO (A
3 O
|S
«"
c
JO
jn
E
o
ͣ
3
(0
12-
10-Industriai Point Sources
Residential
Woodstoves
J J I ii II J i
73 75 77 79
Year
Figure 3. Industrial and Residential Particulate Bnissions
Table 4
EMISSION INVENTORY FOR WINTER SEASON,*^
MISSOULA, MONTANA
Emission Seasonal Emissions (tons)
Source Category Particulates Carbon Monoxide
1979/80^ 1982/83^ 1979/80^ 1982/83*^
Residential Wood
Combustion*^ 600 1,315 5,340 6,362
Paved Roads 204 204 -
-Point Sources 150 150 194 194
Fuel Consumptiin 149 149 49 49
Transpor tation 73 73 7,928
7,9 28
Unpaved Roads 56 56
-Total Emissions 1,234 1,947 13,511 14,533 RWC % Contribution 48.7 68 39.5 43.1
a) Church, 1980
b) Steffel, 1983. All 1979/80 emissions except RWC were
assumed to remain constant.
c) Assumes all RWC emissions occur within a 120-day winter
18
Table 5
SUMMARY OF DATA FROM MISSOULA, MONTANA STUDY
Test Group 475 urban Missoula students 133 Missoula students from outlying areas.
328 Great Falls
students 366 Missoula students (Missoula Acute Effects Study) Study Per iod Jan-Feb 1978 May 1978 1978-1979 Ambient TSP^ In outlying areas, levels were 1/3 to 1/2 the levels
of urban Missoula
Annual avg.
for Missoula:
81 ug/m
Annual avg for
Great Falls:
4 2 ug/m
Three-day avg.
TSP range:^
0-200 ug/m . Only 3 test
days had TSP ^
below 50 ug/m
none were above
200 ug/m
Observations
Except for FEB,,
PFT tests were
poorer in urban
students than students from
outlying areas Except for FEV,,
PFT tests were
poorer in Miss¬
oula students than those of Great Falls
Best^
ug/m
PFT at 0-100 TSP Worst
PFT ^
ug/m
t 151-200 TSP
120 Missoula 1979-students 1980
(Missoula Acute
Effects Study)
84 Missoula adults 1978-with chronic 1979
obstrue-pulmonary
disease
Three-day
avg-TSP: 440 ug/m
Control
days-avg
154 TSP:^93-ug/m Winter T
121 ug/m
Summer TSP
81 ug/m
SP avg.
avg
PFT are low on
high TSP days
All PFT parame¬
ters and activity levels decreased
as TSP increased
Sources: Carlson, J. in 1980 International Conference on Residential Solid Fuels, Portland Oregon.
Montana Air Quality Bureau 1980.
FEV
1
^TSP: Total Suspended Particulates
(Forced Expiratory Volume) The volume of air expired in the first second.
blanket of wood smoke" during the frequent thermal inversion
conditions (Loh 1984). This is illustrated in the picture
on page i i.
Other areas have had air quality problems associated
with RWC as well. In 1983, Joseph Grimsley, N.C. Secretary
of Natural Resources and Community Development, reported that wood emissions could have an impact on some N.C.
cities: Raleigh, Durham and Charlotte were all having difficulty in meeting carbon monoxide standards (Spohn
1983). Studies in Nashville showed that residential wood
combustion was a significant contributor to particulate
levels and were "cause for concern as to whether particulate ambient air quality standards could be achieved" (Imhoff et al. 1984). Since only 11% of the homes were estimated to heat with wood in Nashville, potential existed for further use. RWC has been specifically identified as a major cause
of PM attainment in Medford, Oregon and to CO
non-attainment in Albuquerque, N.M. and Reno, Nevada. Figures 4 and 5 show the national distribution of locally perceived
RWC emission problems. The nature of these perceived
problems is not given. Often the most obvious problem is visibility, due to the efficient light scattering effect of RWC emissions small particle size. A recent study showed that 50% of Albuquerque's winter visibility impairment was
caused by wood smoke (Weigold 1984).
RWC is not considered to be a significant contributor
rigure4 Areas Identified by State and Local
Agency Contacts as Having Known or Suspected RWC Impacts
—*• "• 'c...
p fall* u-ui r.11.,1
ij5Si.»t »M>MUM .
r«ifi
or Local Agency Contacts
\
[^ 0-3 Days
/^ 25 Days, to
^
22
Hydrocarbons (HC) are basically products of incomplete
combustion, a characteristic of most residential stove
operation, and may possibly be of some local concern. (HC is not a criteria pollutant but is regulated as a precursor of
ozone.) Oxides of nitrogen (NO ) are basically products of
high temperature combustion: not a characteristic of RWC use.
Health Risks
A contribution to NAAQS non-attainment of course
implies a health risk commensurate with the basic
assumptions of the Clean Air Act (CAA). Beyond this,
however, RWC emissions are particularly respirable (80% are smaller than 2.5 micrograms (um)), and are thereby a greater health hazard than NAAQS-total suspended particulates (TSP) compliance implies. In addition, much of the polycyclic organic matter (POM) in wood smoke has been found to be
mutagenic and thereby a possible human cancer risk. Studies in London 200 years ago related a high incidence of scrotum cancer among chimney sweeps to the soot from smoke, and coal
tar has induced cancer in animal studies (Harvey 1982).
More recent studies show that at least one wood smoke
component, benzo(a)pyrene (BaP) is a very potent animal carcinogen. A 1984 EPA study reported that in New Jersey,
61% of these carcinogenic particles in the air were
#
be a greater health threat than previously thought. (New York Times, August 1984). In fact, Harkov (1985) reports that RWC accounts for 98% of New Jersey's winter ambient BaP. Figure 6 and Table 6 show the seasonal variations and
source apportionment.
Studies by Kamens et al. (1985) have shown that while the mutagenic nature of wood smoke degrades in the presence of sunlight, nitrogen dioxide plus ozone greatly increase the mutagenicity. Moreover, the mutagenicity degradation is slowed by low temperatures. POM mutagenicity is therefore highly variable and would be of greater concern in some
colder urban areas with high RWC use.
Other known carcinogens may also be problematic.
Liparl (1984) found that RWC is likely to be a major source of primary aldehydes in the winter and that formaldehyde
constituted 21-42% of the wood smoke aldehyde component. For particulates that are not mutagenic, little is
known of toxicity. Dartmouth Professor James Hornig
reported that wood smoke could especially pose a problem for children with asthma and elderly people with chronic lung
problems (New York Times, December 8, 1983), but there is
little evidence of bioaccumulation or adverse effects in
plants, microorganisms or fish and other wildlife (Santodonato et aj.. 1979).
Indoor Air Pollution
The health risks associated with the above components
#
Table 6
ESTIMATED ANNUAL HEATING SEASON (NOV.-MAR.)
AND NON-HEATING SEASON BaP EMISSION RATES FOR NEW JERSEY
Fuel Solid fuels Coal Coal Wood Total Oil Heating Mis. distillate Residual Total Natural gas Heating Motor fuels Gasoline Diesel Total Grand Total User
BaP Est Heating Non-htg
rate Annual Season Season (ng/Btu) (kg) (kg) (kg)
Utilities Residential Residential Residential Commercial/ industr ial Utility/ commerc ial/ industr ial
6.1 X 10 37.7 227
-2
2.6 X 10 2 X 10
4.3 X 10
-4 -4 4.5 3.8 6129 6137 0.4 0.2 <0.1 0.6 .-4 1.9 3.8 6129 6135 0.4 0.1 0.5 2.6 2.6 0.1 0.1
Residential 2.0 X 10 ^ 0.1 0.1
Autos/trucks 0.6 228 95 133
Trucks/buses 2.3 85 35 50
313 130 183
2400 o 2200 7
X 30
-2000
klJ^ i^^AU
MM rca MAN AM MAY JUH JUi AUG UP OCT «tOV OCC JAM
1862 1963
n$m9 6. Top: Ploi of haalinodagraadayt(HDO)aawaM at Insolaiion during
•w pariod ftomjmuary 1962 ivoughJwiuary 1963. KX) data Irom NOAA and
imoiathM data fcom Andareon.^ BodonK Plol of awaraoa B(ajP oonoantaliona
(no/m^ lor ai 27 Naw Jaraoy iJlat Irom January. 1962 Wough January.
26
of concern. The use of fireplaces or woodstoves has been
shown to increase indoor concentrations of particulate
matter from 20 to 60 times that of natural gas heat (Cooper
1982). Although indoor fugitive emissions are highly
dependent on variations in user operation and installation, and can vary widely from household to household, use of better insulation and building sealing heightened indoor concentrations of any pollutant with an inside source.
There have been few studies identifying RWC as an indoor health problem. Early studies by Kirk Smith and others in Thailand and Nepal established a dose response relationship between indoor wood cooking and respiratory disease (DeKoming 1984). However, these were very high concentrations not likely found in typical USA RWC use. Also the open fires common to the study have emission characteristics quite different from modern reduced air
stoves: POM formation is reduced and particulate size tends to be larger in an open fire (personal communication from
Judy Muraford, U.S. EPA). This may account for a lack of any
4
association found with cancer in these studies.
A more recent study in Michigan found a significant increase in symptoms of severe respiratory illness in
children aged 1 to 7 from homes with RWC compared to matched
#
4
Holly Reid, a field worker in the Nepal study suggests that a very low life expectancy from causes other than
cancer could be responsible. Studies on open coal burning
stoves in China do show a lung cancer association (personal
children in homes without RWC. A significant increase in mild or moderate symptoms was not indicated (Honicky 1985).
Actual air monitoring was not done and it is conceivable
that the relation could have resulted from the temperature variations common to wood heat or humidity differences.
Nonetheless, a RWC risk is indicated.
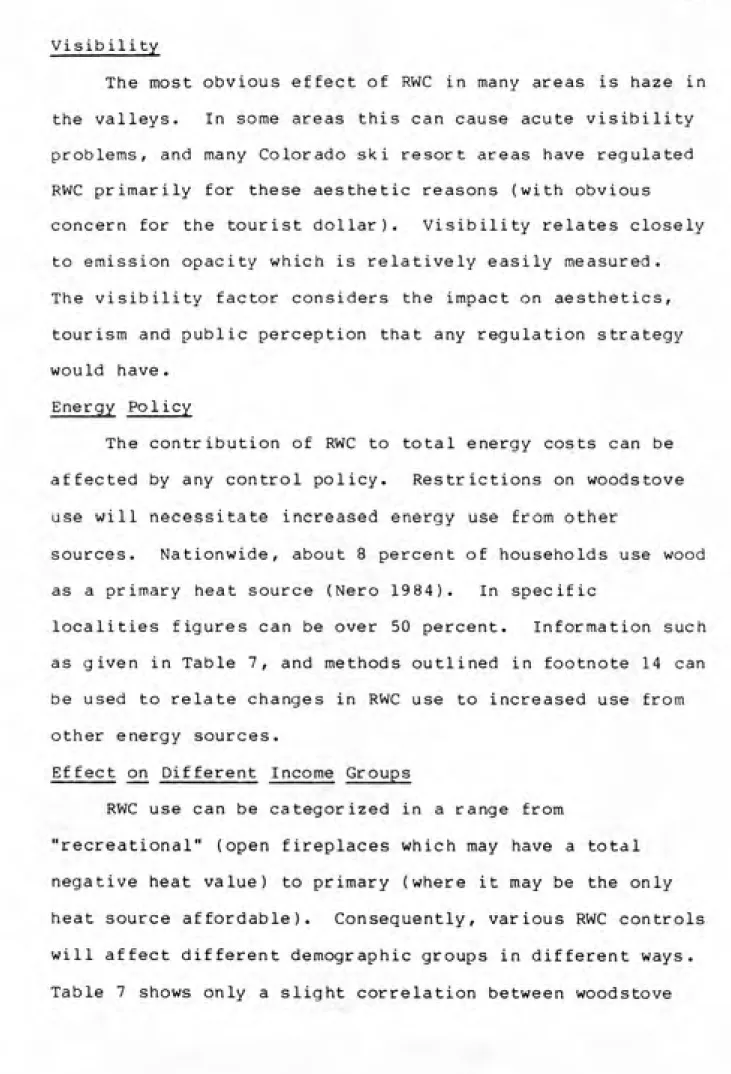
AFFECTED GROUPS
Information has already been presented concerning the geographic distribution of RWC use (see Figure 2 and Table 2). The regional nature of RWC emissions has been
established although the specific contribution of RWC is not generally known for all high impact areas. It is
nonetheless clear that these areas stand to benefit from any
decrease in RWC emissions from both health concerns as well
as from perhaps less costly industrial development in non-attainment areas. The question remains, who stands to pay for reduction in RWC emissions? Ultimately the user as
well as the RWC industry.
Table 7 shows the demographic distribution of RWC users. Although the table does not account for the amount
of wood used, several interesting associations appear.
m
In accordance with EPA's "offset" policy, emissions from new sources in non-attainment areas must be offset by reductions in existing sources. This greatly increases the expense of certain industrial expansion. Additionally,
Table 7.
Percent Of Households Using Different Wood-Burning Equipment
______________By Demographic Group^ 1980-81_____________
GfXNJp
Stove
With
Totri
Not
AirtlgM Ahtlgtit Total
Furnace Any Equipment Househokte In (Mllllonsj
Total 14 20 8 28 80.0
Regions
WesP 20 8 28 1 8 8 D 34' 15.1
North Central 13 8 19 1 7 8 1 28 22.2
Northeast 11 5 17 2 7 9 2 24 200
South 14 7 20 2 7 9 1 29 22.8
Location
Urban 14 S 19 1 4 S 1 23 629
Rural 14 12 28 4 18 22 3 45 17.0
1980 Incoma
SO to 10.000 4 2 8 2 4 8 1 12 20.9
$10,001 to 20.000 9 5 14 1 7 8 1 21 22.8
$20,001 to 30.000 17 8 25 1 9 10 1 33 17.0
$30,001 to 40,000 23 11 34 2 8 10 1 42 9.3
$40.000> 33 13 48 1 9 10 1 53 9.9
Educadon .
Syearsorlaas 4 3 7 2 7 10 1 17 77
gtoll years 8 3 9
<l
9 9 1 18 6.9I2years
College. 1 to 3 yaar«
11 8 17 8 10 1 26 26.9
15 7 21 2 5 7 1 27 15.2
Coflege, 44 years 22 9 32 1 8 7 1 38 23.3
Agaofhead .
0 to 24 years 7 3 10 0 2 2 0 7 5.2
2S to 29years 11 7 18 1 6 7 1 11 9.0
30to44yaars 18 9 27 2 9 12 1 31 24.7 .
45to64years 18 7 23 2 8 9 1 30 24.2
65-t> years 7 3 10 1 4 S 1 18 18.0
Not determined 12 5 17 2 5 7 1 3 at
ConvenHonal fkjal used
Natural Gas 18 4 20 1 3 3 0 24 42.2
Fuel Oil 13 8 21 2 10 12 1 30 13.5
Electricity 13 10 22 2 9 12 1 32 17.0 ,
Other 8 9 14 4 11 15 2
26 5.7
None 13 13 25 9 49 58 13 88 16
Tigursa are percent of households in the demographic category I
ͣ
Ijess than 0 5 percent.
Totals do not always add up because ot rounding.
Considering that most "fireplaces with inserts" are
probably equivalent to airtight stoves, airtight stove
ownership increases only slightly with income while ordinary fireplace ownership increases significantly with income. A larger percentage of rural homes burn wood although the
total number of urban households with RWC is almost twice that of total rural RWC homes. More detailed information
-including wood usage, correlation with conventional fuel used, and urban vs. suburban breakdown - would be necessary to better assess the demographic impact of any RWC emission
control strategy. Several state and local control programs
have been initiated already, and analyses from them could improve this data base. Table 8 shows a conceptual
distribution of various strategy cost impacts. A discussion of existing strategies appears in the next chapter, and a discussion of the various strategy impacts will follow. Specific costs of various controls will also be discussed
30
Table 8
CONTROL ELEMENT PARTY INCURRING COST
Public Education
Control Devices
Energy Subsidies
Episode Curtailment
Cert if ication
State government for planning,
implementation and maintenance
Consumer
Cost usually shared between consumer and state government State and/or local government
for planning, operation, enforce¬
ment, and maintenance
State or Federal government to
accredit test laboratories,
reviewing test results, enforce¬ ment. Industry incurs the cost
of performing the tests.
Industry might pass the costs of
EXISTING RWC EMISSION ABATEMENT PROGRAMS
Compared to other air pollutants, residential wood combustion (RWC) emission is a newly recognized problem.
Laws do exist, however, and public officials at many levels
have already investigated proposals for control regulations.
Government action pertaining to woodstove emissions can be
divided into three categories; 1) Federal, 2) State, and 3)
Local.
FEDERAL
Federal authority to regulate RWC is provided in the Clean Air Act (CAA), which as previously administered provides only minimal protection from RWC emissions.
Particularly applicable are sections 108 and 109, which describe national ambient air quality standards (NAAQS) for
carbon monoxide (CO) and particulate matter (PM) (see Table
9). ͣͣ'ͣ
CO is presently monitored under the air quality
monitoring system and regulated as a criteria pollutant (for which NAAQSs are set) although no federal action had yet
been directed specifically at wood smoke. Where wood smoke
32
Table 9
NATIONAL AMBIENT AIR QUALITY STANDARDS
Pollutant Averag ing Time Pr imary Standard
Particulate Annual ^
Matter (Geometric Mean) 75 ug/m24-hour* 260 ug/m^^
Sulfur Annual ^
oxides (Arithmetic Mean) 80 ug/m (.03 ppm)
3
24-hour* 365 ug/m (.14 ppm)
CO 8-hour* 10 mg/m^ (9 ppm)
3
1-hour* 40 mg/ra (35 ppm)
N0„ Annual ^ .
(Arithmetic Mean 100 ug/m (.05 ppm)
Photochemical _
oxidants 1-hour* 160 ug/m (.08 ppm)
Hydrocarbons
3
(non-methane) 3-hour* 160 ug/m (.24 ppm)
3
Lead Quarterly 1.5 ug/m
state implementation plans (SIPs) authorized by EPA. In fact, according to EPA's National Air Pollution Estimates
(February 1984), RWC accounted for 8% of the total national
CO emissions, more than a fourfold increase since 1973. RWC control could in fact relieve the burden on industry's new source development requirements in non-attainment areas, which could be of significant economic benefit. Industry was in fact generally supportive of Oregon woodstove
regulations, as will be discussed later.
Existing NAAQSs for particulate matter under the CAA
can also apply to RWC emissions. Again, however, these have not been specifically directed at wood smoke. EPA's 1984
national estimate for RWC particulate contribution was 12%.
Wood smoke thus contributes a significant proportion of ambient air PM in specific air sheds and could be regulated under the existing standards. New particulate standards
expected to be promulgated soon will be especially
applicable to RWC emissions (Federal Reg ister, March 20, 1984 pp. 10400-10436). Whereas the current standards limit the concentration of all particulates in the ambient air (i.e. total suspended particulates (TSP), typically less
than 25 to 45 um) the proposed standards will be directed only at particulate matter smaller than ten microns in diameter (PMIO) (Wood 'n' Energy December, 1984 p. 9). Table 10 compares the old and new standards. The new
34
Table 10
PROPOSED CAA PARTICULATE STANDARDS
TSP
Existing (all particulates)
Annual 24-hour
3 3
Primary 7 5 ug/m 26 0 ug/m not to
geometric mean be exceeded more
than once per
year 3
Secondary - 150 u/m not more
than once per
year
Proposed (PMIO only)
Annual 24-hour
3 3
Primary 50-65 ug/m expected 150-250 ug/m
annual arithmetic with one
statis-mean tically expected exceedence per
year
3
Secondary - 70-90 ug/m
expected annual
arithmetic mean
Note: EPA does not intend to change how particulate matter is currently defined for purposes of the prevention of
on health, because it is only the smaller particles which can penetrate the inner lung passageway (Cooper 1982). Because almost all wood smoke emissions are in this
inhalable size range (Cannon 1984), wood smoke will
contribute to a significantly larger proportion of the total regulated particulates when the PMIO standards take effect. For example, in 1978 data, RWC contributed 12.2% of TSP but accounted for 31% of the total respirable particles.
(Cooper 1982; see Table 11). Later studies in Oregon and
Montana show an approximate twofold increase in RWC
contribution to the PMIO standard versus the earlier standard (Core 1984).
To summarize, primary components of RWC emissions are already regulated under NAAQS although action has not yet
been directed at woodstoves. RWC's contribution to proposed
PMIO standards will be significantly more than the 12% reported nationally in 1984 under the old standards, In
specific inversion and high RWC use areas, the RWC contribution will be greater still.
Other potentially hazardous components of RWC emissions
are either not in significant quantities or are not
presently listed as NAAQS criteria pollutants (see Tables 11 and 12). EPA has additional authority to regulate RWC
emissions under CAA section 112 (42 USC sec. 7412(b)(1)(B)),
which requires an "ample margin of safety" to protect
36
Table 11
MAJOR POLLUTANT EMISSIONS FROM RESIDENTIAL WOOD
COMBUSTION COMPARED TO EMISSIONS FROM OTHER SOURCES
IN THE PORTLAND-VANCOUVER AQMA (1978)
Av Tons High Tons
Tons Tons in Per Day Per Day
Pollutant Per ,Yr January in Jan in Jan
Carbon Monoxide
Wood-burning
stoves 87,000 17,000 560 2,250
Transportation 779,000 65,000 2,100 2,100
Volatile
Hydrocarbons 1,080 216 7.0 28 NOj^ as NO2 270 54 1.7 7.0
SO^ as SO2 108 22 .70 2.8
Aldehydes 600 119 3.8 15 Polycyclic Organic
Matter 160 32 1.0 4.1
Benzo(a)pyrene 1.4 .28 .009 .036 Carcinogens 21 4.2 0.14 .54 Pr ior ity
Pollutants 220 44 1.4 5.7
Total Particulates 4,600 920 30 120 Respirable
Particulates
from other
Portland sources 10,200 850 27 27
Total Particulates from other
Table 12
EMISSIONS OF MAJOR POLLUTANTS FROM RESIDENTIAL
WOOD COMBUSTION SOURCES
Wood-Burning Stoves Fireplaces
g/kg lbs/ % g/kg lbs/ i Parti-Chemical Species wood 10 BTU culates wood 10 QTU culates
Carbon Monoxide 160
(83-370)
22 ""ͣ^ 22
(11-40)
3.0
Volatile Hydrocarbons
NOj^ as NO2
2.0 (0.3-3.0) 0.5 .28 .07 ****"" 19 1.8 2.6
.25 ͣ ^«>*
SO^ as SO2 0.2 .03 — —
---Aldehydes 1.1 .15 —
1.3 .18
Condensable Organics
Particulates
Total particulates Polycyclic Organic Mat.
4.9 (2.2-14) 3.6 (0.6-8.1) 8.5 (1-24) 0.3 .67 .50 1.2 .04 42 100 3.5 6.7 (5.4-9.1) 2.4 (1.8-2.9) 9.1 (7.2-12) 0.03 .92 .33 1.3 .004 74 26 100 0.3
Benzo(a)Pyrene 0.0025 .0003 .03 0.00073 .001 o.ooa
Carcinogens .0 38 .005 .45 .0059 .0008 0.06
Priority Pollutants 0.41 .06 4.8 0.063 • ouy U.7
Na .005 .0007 .06 .004 .0006 .04
Al .004 .0006 .05 .002 .0003 .02
Si .003 .0004 .04 .002 .0003 .02
S .03 .004 .4 .004 .0006 .04
CL .05 .007 .6 .05 .U07 .6
K .07 .01 .8 .05 .007 .5
Ca .004 .0006 .05 .005 .0007 .05
Organic Carbon 4,2 .58 49 4.2 .58 46
38
are pollutants not covered by NAAQS under section 109. Polycyclic organic material (POM) in wood smoke could be such a HAP due to the demonstrated cytotoxicity and
mutagenicity of many of the RWC POM species. RWC's contribution to POM has been estimated from 30% (Karaens 1984) to 60% (EPA 1984). BaP levels in N.J. were found to
be ten times higher in the heating season than in other
seasons during 1983 (see Figure 6). In fact, in the
drafting of the 1977 CAA, a summary of the provisions of the conference agreement indicated that Congress expected
criteria to be issued for POM, and benzo(a)pyrenes were specifically considered (Bonine and McGarity 1984). Thus EPA has been very aware of the presence of BaP and its
carcinogenic effects, but has been reluctant to "list" it as an identified air pollutant since its "primary and only
unregulated source is RWCs."
Due to the nonspecificity of POM in general and its many different sources (see Table 13), there are many legal and administrative difficulties with "listing" RWC emissions
under section 112. However, CAA section 111(d) (42 U.S.C. sec. 7411(d)) allows EPA to set New Source Performance
^New York Times, August 19 1984, 11:4:1 The 1970 CAA
required EPA to publish a list of HAPs for which the agency
intended to establish national emission standards. Once a
pollutant is "listed," the administrator has 180 days to
publish a proposed National Emission Standard for Hazardous
Table 13
ESTIMATES OF ANNUAL POM EMISSION BY SOURCE TYPE ON A NATIONAL BASIS
Estimated Percent of
annual POM total POM
emissions, emissions
metric tons ' from all
______Source type _______sources
Residential heating
Wood-fired total 3,837 34.8
primary heating auxiliary heating fireplaces
Coal-fired 102 0.9 Oil-fired 7.4 <0.1 Gas-fired 9.8 <0.1
Open burning sources
Agricultural open burning 1,190 10.8 Prescribed burning 1,071 9.7 Forest wildfires 1,478 13.4 Coal refuse piles 28.5 0.3 Land clearing waste burning 171 1.6
Structural fires 86 0.8 Mobile sources
Autos-gasoline 2,160.8 19.6
Autos-diesel 1.2 <0.1
Trucks-diesel 103.5 0.9
Coke production 632 5.7
Industrial boilers
Coal 69.0 6.3
Oil 1.3 <0.1
Gas 2.1 <0.1
Wood/bark 1.2 <0.1 Begasse 0.3 <0.1
Incinerators
Municipal 0.3 <0.1
Commercial 55.8 0.5
Utility boilers
Coal 12.9 0.1 Oil 0.3 <0.1 Gas 0.3 <0.1
40
Table 13
(continued)
ESTIMATES OF ANNUAL POM EMISSION BY SOURCE TYPE
ON A NATIONAL BASIS
Source type
Estimated annual POM
emissions,
metric tons
Percent of total POM
emissions
from all
sources
Carbon Black 3.1 <0.1
Charcoal manufacturing
uncontrolled batch kilns
continuous furnace production Asphalt production
Saturators
Air blowing
Hot road mix
0.8
0.7
0.2
0.2 3.9
<0.1 <0.1
<0 <0, <0 Barium chemicals
(Black ash rotary kiln) 0.3 <0.1
Standards (NSPS) for pollutants that are neither criteria pollutants nor HAPs under section 112. Since 70-80% of POM components in wood smoke either are particulates or are
adsorbed onto particulates, particulate control is
considered a sufficient means to control RWC POM emissions
if implemented specifically for woodstoves (personal
communication from Harriet Ammonn, U.S. EPA, February 1985). Implementation of section 111(d) generally would require
establishment of an NSPS as well as a Best Available Control
Technology (BACT) for individual State Implementation Plan (SIP) use. This process however is complex and cumbersome. Experience has shown that "sections 111 and 112 are not amenable to regulating toxic air pollutants effectively"
(Cannon 19 86).
The costs to stove users of full implementation of CAA or of possible POM regulations would vary depending on how each state chooses to comply with NAAQSs. The cost
effectiveness for control of particulates from woodstoves
has been estimated to be about $275 per ton and about $86 per ton for total emissions including CO and others
(Emison 1984). (These figures do not credit potential
savings from cleaner stoves due to reduced chimney cleaning
and damage from chimney fires.) Others estimate $350 per ton PM and compare this with $1,000 to $17,000 per ton PM for various industrial controls (Hough 1983).
Implications of EPA alternatives will be discussed in
42
take the lead in RWC emission control. Because of delay in federal initiative, several states led the way in
establishing emission controls.
STATE CONTROLS
Federal NAAQS are generally administered by the various state implementation plans (SIPs) as approved by EPA. Wood
smoke's contribution to excessive CO and TSP in
non-attainment areas prompted many states to propose legislation and initiate studies. Two states, Oregon and Colorado, have already enacted legislation to regulate RWC, and Washington has proposed legislation which has passed its House and was awaiting Senate action as of May 1986 (Wood 'n' Energy, May 1986). Several other states are presently studying RWC
emissions. The Coalition of Northeastern Governors (CONEG)
completed a study on RWC in 1985 with recommendations for legislative action (personal communication from Dave Wilson, CONEG, February 1985). The Massachusetts legislature has considered a bill authorizing its Environmental Study Committee to investigate recommendations for control legislation (personal communication from Mark Geres,
Massachusetts Office of Energy Resources, February 1985); and in North Carolina, a bill was proposed to initiate a similar study (personal communication from Rep. Margaret Keesee-Forester, February 1985). Stove certification
(Wood 'n' Energy Aug. 1986). A geographical summary of
current state action with a brief description appears in
Figure 7 (updated through August, 1984). Note that the Southeast is significantly underrepresented although it accounts for 32% of all residential wood use.
A 1977-78 Portland (Oregon) Aerosol Characterization Study was the first receptor modeling/source apportionment
study to use chemical mass balance (CMB) methods to
demonstrate that RWC was a major contributor to particulate
non-attainment. Subsequent Oregon SIP studies concluded that the woodstove industry must be forced to produce a cleaner stove (Gay 1986).
In 1983 Oregon passed the nation's first statewide
woodstove legislation, to take effect voluntarily by July 1984 with required certification of new stoves by July 1986.
The law required a 75% reduction in woodstove emissions by the year 2000, which would bring Oregon's non-compliance cities - Portland, Eugene, and Medford - within standards
(Towslee 1984). Specifically, the law charged the Oregon Department of Environmental Quality (DEQ) to work with a Woodstove Advisory Committee to set a workable standard and
to come up with test procedures by July 1984. Oregon's program included five major elements: 1) a testing procedure for stove emissions and efficiency; 2) TSP
emissions standards; 3) an accreditation process for testing
laboratories; 4) stove labeling requirements; and 5)
44
State-by-State
Emissions Update
Figure 7.
pMaad 8Uta>W« EmlMlMM !.««
jsutoiaid* Sludi«» UiKlM««y
I Tewiw lA State Have EMiaaiOAa Lawa
I Itoatonal Emlaalona Study Undanaair
ty Steven Maviglio
Alaska - Regulations are in place in the city of Juncau. Unique opacity nandardt require official* to Me through
the unoke.
Califoraia •> Air Rcsourco Board examining pouiblc emistioot control uraicgiet and auitting town* in dcviaing
their own regulation*. Truckcc Mcadowi it the hardcu hit
area in the tuu,
Colorado - Statewide law goes into effect July 1,1917. Voluntary program begin* July 1, t9t5. Require* all itoves,
ifltert*, and fireplace* to be certified cleanburnen. Town*
allowed to have stricter law*. Department of Health plant
testing to Oregon's uandard this Fall to see if it should be
adopted for the stau.
Idaho - Sute air quality officials recently completed an
assessment of wood smoke in Boise. Voluntary *no burn*
days in some mountain towns.
Massachusetts - Depanment of Environotental Qual* icy Engineering's western office chief says the state is likely to follow* Oregon's uove certification program. Legislative
approval may not be necessary, he claims.
Oregon - Stauwide law goes into effect July I, 1916.
Voluntary program begins July 1| 19t4.
Utah •> Prove and Salt Lake City arc being evaluated at
sites with emissions problems. Staw authorities currently are evaluating usi resulu gathered last wimer.
Virginia - Town of Virginia Beach officials launching uudy to inventory stove emissions.
Washington - Depanment of Ecology emissioot
MIclligan - Depanment of .Natural Resources has in*
stalled air monitoring machines in the town of Mie.
Minnesota — Statewide emiuions monitoring program
launched. No suuwide legislation eapccud.
Montana — Stau officials are weighing propouls to regu¬
late wood bcaicn. Bill* arc capccxcd to he utirodwced in
the next session of the legislature providing laa credits. Mi*>
soula's much-publiciaed emissions law faces a ballot test in
November.
Nevada — Division of Environmental Preicnien eyeing
Oregon developments. Several towns have voluncary ref¬
lations, ioduduig Tahoc.
New Mexico — Emistiotu invemory of Albuquerque re> ccoily compleud with EPA funds. Results were inconclu¬
sive. No statewide legislation planned.
Northeast - Regional wood energy center will make
policy recommeodatioos to the Coalition of Nonhcasi
Governors in Ocfobcr on how lo best cenirel stove emis¬
sions.
nKMitoring program underway. Coouol wratcgict being
asKued for possible ioiretiucilon in the ncit legislative ses¬
sion. Officials working closely with wood energy groups.
Wisconsin - Small-scale emissions monitoring underway
in several towns.
Wyoming - Studies underway by the Departmem of En¬
vironmental Quality. Oregon standard being reviewed. Air
quality chief uyi he is watching Colorado and Oregon's
to be done at different specified heat outputs so that the
data could be interpreted for different climates. Aweighted average characteristic of Oregon problem cities (Portland and Medford) was used to determine compliance with the standard. The law required all woodstoves, cookstoves, and fireplace inserts sold in Oregon to pass a test
certifying not more than 15 grams/hr emissions for
non-catalytic stoves and 6 grams/hr for non-catalytic stoves. In
July 1988 the standards will change to 9 g/hr and 4 g/hr. All new stoves sold must have a permanent certification label plus a removeable label giving information on average
emissions and efficiency levels. The labels include a
simple graph of the burn characteristics (see Appendix 2).
The standards do not apply to used stoves, already installed stoves, central heaters, or fireplaces (Maviglio 1984).
Oregon's DEQ predicted it would cost $6000 to certify
each stove design (a figure twice that originally estimated)
in order to satisfy the stove industry's desire to fjrovide
expanded information for other parts of the country and thus
avoid repetitious testing costs (Maviglio 1984). This
additional information included setup, operations, and heat
efficiency determinations (Kowalczyk 1984). Many felt that
the 1988 9 g/hr standard (non-catalytic) could not be met
7
The tighter standard for catalytic converter stoves is based on the assumption the converter will degrade over
time. Regulations require 70% converter efficiency after
5000 hrs for certification with a two year free replacement
46
with existing designs (Crasilneck 1984). In fact, the first
non-catalytic stoves to meet the 1988 standards used a
palletized wood fuel system. Actually, Oregon hadconsidered a phase II standard of 3 and 7.5 g/hr for
catalytic and non-catalytic stoves but this was rejected due
to woodstove manufacturers' objections (personal
communication from Robert Lebens, Oregon DEQ, August 1986).
The legislation was not intended to be "technology forcing"
yet it took much development for most manufacturers to reach
the standards. A summary of stoves meeting 1988 standards
is given in Appendix 2. Six non-catalytic stoves had
surpassed the 1988 9 g/hr standard as of May 1986.
Colorado in February 1985 became the second state to
pass similar legislation. Its program is similar to
Oregon's in that: 1) particulate standards must be met
before a new stove is sold in Colorado; 2) emission
standards are applied in two stages (Phase I Jan 1987 and
Phase II July 1988); 3) the Oregon 0M7 test method may be
used for certification; and 4) stove testing is done by
private laboratories certified by the state.Colorado incorporated many elements of Oregon's
woodstove certification program and in addition required
that testing laboratories rather than the state (as did
Oregon) verify that the stoves certified were those actually
on the market. In doing so Colorado was able to implement
Energy February 1985). There are elements of the Colorado
program that differ from Oregon's, however. Probably the
biggest factor is the effect of altitude on emissions. Sheldon Energy Research conducted studies to determine an appropriate factor to relate low altitude test scores with emissions at higher altitudes. (Colorado uses 5,000 feet
-where most population exposure occurs - although certain localities with RWC emission problems are at a much higher elevation.) This conversion factor remains questionable.
Colorado also has a much colder climate than Oregon, and
consequently uses a different burn rate weighting formula. It also allows for a slightly different standard for "very large" stoves with a minimum burn rate greater than 4,000
BTU/hr.
Another fundamental difference from the Oregon program is that Colorado set standards and required testing for CO emissions. Although most manufacturers are finding that CO compliance is usually reached if TSP standards are met, some
non-catalytic stoves may have trouble meeting the Colorado
Phase II CO standards (Gay 1986). (Colorado does not
differentiate between catalytic and non-catalytic stoves in
its standards.) Conceptually then, whereas Oregon's
standards were developed to meet NAAQS (i.e. performance
standards), Colorado's were based on best available control technology (BACT) and in fact may be "technology forcing"
for non-catalyst stoves. A comparison of the Oregon and
s a a < ^-c 0 3 in a It a a 1
•D I O +
O
«l 3 3 TJ in a 0 0 •-ͣID ID
a bi (t •>. t- rt rr IT O ͨ-ͣ 1^ ^. « < » <
n> o » a cf II <t a
n «ͣ n !-»,
« c a » n a n n n- rt
C i^
" (I c
< (^ 3
« £ 0 a = »_ " a >-rr U 0 re n n 3 0 a c ^^. c o 3" rr O (t 0 a. 3 •o
o-I^ ͣ< n
fc--If
0 If. 3 m 3 ^ͣ 0 ^'
O Q r"
"D 3 a
C n
3-n ^t-.b rr
•a ^'r».
0 n a> + tf> a
a + 0
ir, rr + 1
0 +0 1 3 + n •< + c n 1 1 1 1 ͨ 3 «^ •^ >
0 z It a
rr 0 b 3
s> r»0) ^. ^- t- 3 o p ͨͣ
0 o ͨ.. in r% in H- r»
n ͨͣ• n
1-4 ^rr D<
3 •< rt a
^ͣ <
n a a 0) c o 1 1 + 1 ro 1 o •f 1
o- 1
+ c o > n n K ͣ D r» Bi 3 • D O 01 I I I I I I I I I I
" I
S r> < O a 3 •- 0 O 3 ͣ
D #-ͣ
3 n a 3 O 3 >- & •- O
C O O >
3 >-ir.
I I -I
I 4
+
I I O I I
•f
o
e — p: p5 •- 3 .a 3 en n c a
rr O •- n
1 3 o iD
o
C n U r» n 3
ͨͣ o a O C 5 n f <t> in b' »- ^ 17 rt >- 3 c O O I 3 O ft
C o
I
ͣ
» I
I
??
O in
01 o 3
^Vteatherization
•oLimit on
''Nurnbcr
•; ^No Bom Days
c r,
^ J^'Visibility
o LlTUtS
0
51 "Subsidies
C-3
X _3
C £
0 ͣ•-Seasoned Wood r H-^"
c c
0 •r
^
n wiPublic C
0 Education
3
Z
0 S^Mandatory
3 Brassions
o o^^Ja.^datory
(t Efficiency
St-allows for an alternative test method, the ASTM or "hybrid"
method, and has allowed for the test differences in its
standard. This was hailed as a major victory for the wood heating industry's voice, the Wood Heating Alliance (WHA) (Wood 'n' Energy, July 1985). Colorado also seems to use an altitude conversion factor of 1.3 for Phase II compliance although a factor of 2 is used in Phase I.
Voluntary compliance began in July 1985. Colorado will
essentially require that Oregon's 1988 catalytic standards
(4 g/hr) be met by July 1987. A reciprocity agreement was
reached allowing Oregon-approved stoves to be certified in
Colorado although there are obvious differences in the standards. This will save stove manufacturers additional
expense. (Wood 'n' Energy February 1985.)
Unlike the Oregon Law, the Colorado bill requires the
air quality control division to designate voluntary no-burn days in any non-attainment area of the state. Additionally,
amendments offered in the House Committee report would require every municipality to enact a building code provision by July 1987 to regulate the construction and
installation of fireplaces "in order to minimize emissions" according to design specification to be determined by the air pollution control division (originally) by July, 1986
(Colorado, [House Committee of Reference Report] 1984). If
fully implemented, these fireplace standards would affect
what may be a significant contributor to RWC emissions in