1
INCOME DISTRIBUTION AND CHANGING RETURNS TO EDUCATION AMONG BUMIPUTERAS IN MALAYSIA: A QUANTILE REGRESSION ANALYSIS
By
Yi Rong Hoo
Honors Thesis
Department of Public Policy
University of North Carolina at Chapel Hill
March 14th 2014
Approved:
______________________
Dr. Geetha Vaidyanathan
_______________________
2
Abstract
Using subsamples from the Malaysian Household Income Survey in 1995 and 2012, this
paper investigates income inequality and returns to education in 1995 and 2012 among the
Bumiputeras in Malaysia by calculating income inequality measures and by estimating Mincer
wage equations using OLS and quantile regression techniques. The estimates of income
inequality measures indicate that income inequality did not change from 1995 to 2012. It is also
found that income inequality in urban areas was higher than in rural areas in both years. The
findings from the estimates of Mincer wage equations are consistent with the human capital
theory. Specifically, it is found that returns to education increase with the level of education in
both years. In addition to that, the results indicate that returns to education diminish across the
quantiles. In other words, Bumiputeras at the lower quantiles of the income distribution gain
more from a given level of education as compared to those at the upper quantiles. These findings
suggest that policies should be enacted to promote educational attainment among poorer
Bumiputeras. This can perhaps be achieved via more comprehensive needs-based affirmative
action policies targeted to this group of Bumiputeras. Extension of governmental scholarships for
tertiary education to poorer Bumiputeras can be one example. Similar approaches can also be
1
Acknowledgements
I would like to express my deepest gratitude to my advisor, Dr. Geetha Vaidyanathan
who has ceaselessly supported me with her guidance, patience as well as encouragement. I offer
my sincere appreciation for the learning opportunities that I have experienced through this
honors thesis project under her tutelage. I would also like to thank my second reader, Dr. Krista
Perreira whose critical advices have been fundamental in pushing me beyond my limits. Also,
the completion of this project could not have been accomplished without the support of the Tom
and Elizabeth Long Excellence Fund for Honors administered by Honors Carolina. Last but not
least, to my parents – thank you for your patience and support in accompanying me through the
completion of this project. The countless reminders both of you gave to keep my feet on the
2
Contents
Introduction ... 3
Literature Review... 6
Data and Methods ... 13
Results and Discussions ... 18
Policy Implications ... 27
Summary and Conclusion ... 29
Bibliography ... 31
Appendix ... 35
Table 1: Summary Statistics of Bumiputeras’ Net Income for 1995 and 2012 ... 35
Table 2: Ratios of Bumiputeras’ Median Net Income Between Deciles in 1995 and 2012 ... 36
Table 3: Changes in Bumiputeras’ Median Net Income Ratios Between Deciles for 1995 and 2012 ... 37
Table 4: Inequality Measures for Bumiputeras’ Net Incomefor 1995 and 2012 ... 38
Table 5: Summary Statistics for Rural and Urban Bumiputeras’ Net Incomefor 1995 and 2012 ... 39
Table 6: Summary Statistics for Male and Female Bumiputeras’ Net Income for 1995 and 2012 ... 40
Table 7: Proportion of Bumiputeras by Education Attainment in 2012 and 1995 ... 41
Table 8: Mean Net Income and Gini Coefficient by Education Attainment ... 42
Table 9: Breakdown of Bumiputeras’s Education Attainment by Deciles in 1995 and 2012 . 43 Table 10: Average Net Income by Level of Education and Gender ... 44
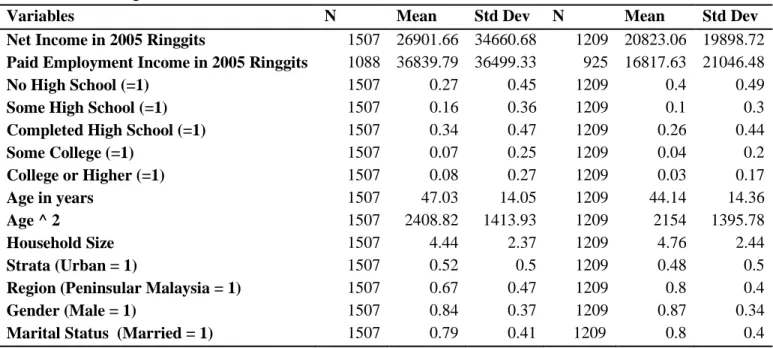
Table 11: Descriptive Statistics for the variables used in the Model ... 45
Table 12: Estimates of OLS Model ... 46
Table 13(a): OLS and Heckman Correction Estimation for Male and Female Paid Employment Income ... 47
Table 13(b): 95 Percent Confidence Interval for Estimates of Returns to Education Presented in Table 13(a) ………49
Table 14: Quantile Regression for Bumiputeras’ Net Incomein 2012 ... 49
Table 15: Quantile Regression for Bumiputeras’ Net Income in 1995 ... 50
Table 16: Quantile Regression for Bumiputera’s Paid Employment Income in 2012 ... 51
3
Introduction
The role of human capital in economic growth and development is an important one due
to its positive influence on social, political and economic performances. The Malaysian
government has been the primary contributor of education in Malaysia and has allocated, from
time to time, substantial amount of resources to the country’s education system. In fact,
Malaysia’s public expenditure on education is larger both as a share of GDP (6.0 percent) and
total public expenditure than that of other countries in Asia such as China (3.9 percent),
Indonesia (3.0 percent) and South Korea (3.1 percent) (Cheong, Selvaratnam, & Goh, 2011).1
For example, in the period between 2000 and 2003 the proportion of the government’s
budget that was allocated for education and training was more than 20 percent albeit it was
substantially reduced to just above 12 percent in 2003 and 2004 (Malaysia, 2000, 2001, 2005,
2006). That figure increased again from 2005 to 2007 when the government spent on average
about 25.2 percent of the total public expenditure on education (Cheong, Selvaratnam, & Goh,
2011). In 2009, a total RM 47.7 billion was allocated for education and training and this
accounted for about 23 percent of the total annual budget allocation for that year (Ministry of
Finance Malaysia, 2009)
Significant in Malaysia’s impressive spending on education is its focus on college/
tertiary education. From 1996 to 2005, total expenditure on tertiary education grew over 150
percent through the Seventh and Eighth Malaysian Development Plans. Malaysia’s spending on
tertiary education is also higher than that of other Asian countries including the Newly
Industrialized Economies of Singapore and South Korea. For example, in 2000 the amount of
4
money Malaysia has spent per student in tertiary education is equivalent to 81 percent of per
capita GDP while South Korea’s and Indonesia’s corresponding figures are 5.5 percent and 34.1
percent respectively (Cheong, Selvaratnam, & Goh, 2011).
In addition to this, both the private sector and the public sector play a significant role in
education development in Malaysia as in other countries. In the latest Economic Transformation
Program (ETP) annual report in 2012, private sector’s involvement and contribution to the
education sector in Malaysia accounted for RM 17.4 billion (Pemandu, 2012).
The idea that growth of human capital can lead to economic growth is tied to the human
capital theory proposed by Becker (1964). According to Becker, education or training increases
the productivity of workers by impacting useful knowledge and skills thereby increasing a
workers income. The increased labor productivity across the economy will translate into
economic growth through an increase in output. This in turn will increase labor income.
Investigating the returns to education is thus critical for understanding the changes and evolution
of income distribution in an economy and is also fundamental for an understanding of the labor
market dynamics.
The research in this paper investigates the changes in income distribution and estimates
the returns to education among Bumiputeras in Malaysia in 1995 and 2012 by estimating a
Mincer equation using OLS as well as quantile regression techniques. Comparisons of these
estimates give insights into the changes in Bumiputera income distribution in Malaysia over
time. Studying the income distribution and returns to education among Bumiputeras will be
useful because the Bumiputera population has been the target group for Malaysia’s affirmation
5
The use of quantile regression analysis to study the evolution of returns to education and
its relationship to education attainment has been done extensively in developed countries. These
include Abadie (1997) and Budria and Moro-Egido (2008) for Spain, Andini (2007) for Portugal,
Buchinksy (1994) for the United States, and Lemiux (2007) for the United States and other
industrialized countries. However, research on this topic is limited for the developing countries.
A few recent studies on developing countries include Blom, Holm-Nielsen and Verner (2001) for
Brazil, Falaris (2008) for Panama, Mwabu and Schulthz (1996) for South Africa and Patrinos,
Ridao-Cano and Sakellarion (2009) for several Latin American as well as East Asian countries.
Studies on income distribution in Malaysia include Chung (2003), Ismail and Jajri (2012) and
Kenayathulla (2013) among others. However, the existing studies on Malaysia have used older
data sets and standard estimation methods such as OLS. The availability of newer data and better
estimation methods makes it important to study this topic due to the continuing changes in the
distribution of Malaysian household income.
From the findings of this research, four main conclusions can be drawn. Firstly, income
inequality measures have not changed significantly from 1995 to 2012 but inequality in urban
areas are higher than in rural areas in both years. Secondly, returns to education increase with the
level of education in both years. Thirdly, real returns to education have declined from 1995 to
2012 across all quantiles. Lastly, the returns to education diminish across the quantiles. In other
words, Bumiputeras at the lower quantiles of the income distribution gain more from a given
level of education as compared to those at the upper quantiles.
6
Literature Review
The role of human capital on earnings through increased productivity was highlighted by
Schultz (1960) and Becker (1964) who argued that human capital variables have a positive
impact on earnings through increased productivity. There are two forms of argument – weak and
strong – that can explain how accumulation of human capital has a positive impact on earnings
(Arabsheibani and Riss, 1998). The “weak” form of argument explains that at the early stages of
the employment process, employers will pay a higher salary to hire individuals with higher levels
of education. In other words, a higher level of education signals to the employer that an
individual is potentially more productive than an employee with less education. The “strong”
form on the other hand states that employers will continue to pay high salaries since higher
education enhances productivity as experience on the job rises.
A vast number of empirical studies on human capital theory have found a positive
relationship between human capital attainment and earnings or income. Some of these examples
include Mankiw, Romer and Weil,(1992), Brunello and Comi (2000) and Sousounis (2009).
Mankiw, Romer and Weil (1992) used an augmented version of the Solow growth model by
including both accumulation of human capital and physical capital in the traditional Solow
growth model. They approximated the rate of human capital accumulation by estimating the
proportion of individuals within the population across each country with a secondary school
education. They then used this augmented model to study the effects of human capital on per
capita income which is assumed to be the average income attainment of an individual within a
country. Their estimates indicated that schooling has a positive impact on a country’s per capita
income. They found that by including human capital as an additional explanatory variable within
7
population growth have been overstated using the traditional Solow Growth Model. Mankiw,
Romer and Weil thus proposed that the human capital is a missing exogenous factor in the
traditional Solow growth model and inclusion of the variable enables the Solow model to explain
the effects of savings and population growth more precisely.
Unlike Mankiw, Romer and Weil (1992), Brunello and Comi (2000) studied the effects
of an individual’s accumulated experience. They used a cohort data from 11 European countries
to study whether experience profiles differ by educational attainment. According to them, such
experience profile may affect returns to education over the working life of individuals. They
found that employees with college education have steeper experience profiles than employees
with upper secondary or compulsory education. They thus concluded that education provided not
only an initial labor market advantage through labor market signaling but also a more long
lasting advantage that increases with time in the labor market.
On the other hand, Sousounnis (2009) investigated the effects of human capital
attainment of an individual in terms of work-related training. Using data from the British
Household Panel Survey for the years 1998-2005, Sousounnis estimated the impact of different
work-related training programs on earnings level. While it is found that general work-related
training have a negative impact on earnings especially when employees finance themselves
through lower wages, he also found that specific work-related training actually has a significant
positive impact on real weekly earnings of employees. The positive effect of specific training is
also greater for blue collar workers compared to white collar workers.
Studies in the academic literature are also able to link the relationship between human
8
education will lead to a more equal distribution of income. By using a micro simulation dynamic
model on household income data in Ivory Coast, Grimm found that there is strong and positive
relationship between income distribution and returns to education. In addition to this, the study
conducted by Brunello and Comis (2000) also found that inequality in earnings growth by
education are higher in countries which have experienced both relatively fast labor productivity
growth and a relatively low educational attainment. According to their findings, countries with a
more stratified system of secondary education have smaller difference in earnings growth by
education.
A model that is often used in empirical investigation of the rates of return to education is
the Mincer equation developed by and named after Jacob Mincer (1974). The formulation of the
Mincer equation looks like:
1)
In this equation, Wi is the earnings while Si is the years of schooling and Expi is the potential
experience of individual, Xiis the set of independent or explanatory variables that are included in
the model, and is the unobservable error term. The unobservable error term is also often
regarded as the portion of unobserved ability. r in this case, can be interpreted as the marginal
returns to education for an additional year of education in cases where schooling is a continuous
variable.
Mincer (1974) found that the earlier schooling model to be outmoded and posited that the
schooling model should be expanded to address the concavity that persists in a typical
working-life earnings profile. The concave shape between earnings over an individual’s working working-life
9
account for this, Mincer added a squared term for years of experience. Mincer suggested that the
years of experience can be calculated by an individual’s actual age minus the estimated age an
individual completed his or her education although direct information on experience is
preferable.
The relationship between human capital and income distribution has been investigated
using the Mincer equation in a number of empirical studies. Podder (2003) for example studied
the role of human capital in determining earnings inequality in Australia. Using the Mincer
equation, he found that inequality is associated with the presence of discrimination within the
labor work force.
The Mincer equation has also been used in analyzing the returns to education in
Malaysia. Chung (2003) used the Malaysian Household Income Survey of 1997, a nationally
represented survey, and found that returns to education are high and positive. Furthermore,
Chung reported that the marginal gross returns to education are 14.1 percent for Bumiputeras
who completed the upper secondary education levels and 16.4 percent for those who completed
the tertiary education level in the overall sample.
It is also interesting to note that the findings from Chung (2003) showed that rates of
return to education for women in Malaysia are generally higher than rates of return for men. The
findings from Chung about the returns to education for women in Malaysia is consistent with the
estimates found for an earlier period of time in Malaysia reported in Psacharopoulos and Patrinos
(2004). For example, returns to education for Malaysia in the 1978-1979 period was estimated to
be at 8.2 percent for women and 5.3 percent for men. However, it is important to understand that
10
Malaysia for example, the percentage of women who participate in the labor force is only 47.3
percent and women place higher intrinsic value on housework (Ministry of Women, Family and
Community, 2007). According to Kenayathulla (2013), adjustments are needed to be made to
rates of return to education to take into consideration the non-randomness that results from
self-selection in the sample.
The findings of Chung (2003) in terms of gender wage differentials between males and
females are reflected again in Ismail and Jajri (2012). Using the 2007 Malaysian household
income survey of about 4535 working households, Ismail and Jajri found that returns to
education were slightly higher for females compared to males. Similar to previous studies, Ismail
and Jajri also concluded that Bumiputeras with higher education levels are being paid
significantly higher wages than Bumiputeras with lower education levels.
Kenayathulla (2013) used the Mincer equation to study private rates of return to
education in Malaysia by using the 2007 Malaysian Household Income Survey. Kenayathulla
addressed selectivity bias inherent in Chung (2003) and Ismail and Jajri (2012). Additionally,
unlike Ismail and Jajri, Kenayathulla’s study used a much larger sample size from the 2007
Malaysian household income survey. The number of observations in her study in this case was
54,921 Bumiputeras. The findings from her research suggest that for both males and females
average private returns to education are highest at the high school (16.5 percent and 27.2 percent
respectively) and college (15.5 percent and 16.1 percent respectively) levels. She concluded that
it is important for an individual to complete education at the high school and college levels to
11
Idrus and Cameron (2000) on the other hand used the Mincer equation with a dummy
variable specification to proxy for different levels of education attainment. Instead of using years
of schooling as a continuous variable, Idrus and Cameron (2000) created different dummy
variables to indicate the different levels of education attained by the individual. In their model
however, as Mincer (1974) suggested, the estimated coefficients will not be the rate of returns to
education but will be a weighted average of returns to education for each education level. Their
research however focused specifically on returns to education for both the self-employed and
employed Bumiputeras within a specific rural area in Malaysia which is predominantly
populated by Bumiputera. They found that there is no significant difference in returns to
education between the self-employed and employed sector in Rantau. Interestingly, their study
also revealed that returns to education increase by the level of schooling and they are the highest
for Bumiputeras who attain a high-school education level.
Studies like Idrus and Cameron (2000) and Kenayathulla (2013) have used the Mincer
equation but they adopted the equation in an OLS setting. As highlighted by Arabsheibani,
Carmeiro and Hanley (2003), studies that modeled average earnings through an OLS setting fail
to reveal the non-constant effects of education on earnings across different levels of income
attainment. An appropriate empirical strategy according to them is to estimate an earnings model
across different levels of the income distribution, using the quantile regression method.
As discussed earlier, several studies have incorporated the Mincer equation in the form of
quantile regression. By using quantile regression, one can achieve two objectives in the context
of studying the returns of education. The first is that one will be able to estimate the returns to
education at different quantiles within the income distribution. Rate or returns to education have
12
case of countries such as Panama (Falaris, 2004) and Portugal (Hartog, Pereia, & Vieira, 200
returns to education across different quantiles showed an increasing trend. On the other hand,
Girma and Kedir (2003) found that returns to education declined across the wage distribution in
Ethiopia.
The second objective that can be achieved via a quantile regression method is that one
will be able to analyze the effects of returns to education at a given level of education on the
earnings inequality within the income distribution. Arabsheibani, Carmeiro and Hanley (2003)
for example studied the rates of return to human capital for men in Brazil using data from
household surveys. In fact, they estimated simultaneous quantile equations to gain a picture of
the impact of human capital on earnings across the distribution of hourly earned wages. Human
capital in this case is measured by years of schooling as in the Mincer equation. By estimating an
OLS estimates and then simultaneous quantile regression estimates for the 10th, 25th, 50th, 75th
and 90th quantiles, they conclude that there is evidence of growing inequality in rates of return to education. In addition they found evidence for a strong form rather than a weak form of
argument for the relationship between human capital and earnings. This implies that education is
no longer used as a screening device in the labor market, but individuals are rather rewarded for
their perceived productivity levels. Lastly, they found that despite the fact that rates of return to
education have been more prominent at the top of the earnings distribution, inequality has not
increased. They attributed this trend to the general increased level of education and other labor
market endowments that may have offset the pronounced rates of return to education at the top
of the earnings distribution.
Tansel and Bircan (2011) used the Mincer equation to study earnings inequality among
13
the Mincer equation in their analysis using a quantile regression. A number of conclusions were
implied from their study. They concluded that male wage inequality is high in Turkey that while
it declined at the lower end of the wage distribution it increased at the top end of the wage
distribution and that education contributed to the inequality. Additionally, all education levels
contributed positively to the wage inequality for both inter-group and within-group inequality.
The largest contribution of education to inequality in their analysis comes from university
education for 1994 and 2002. Returns to different schooling levels declined significantly from
1994 to 2002. They attribute two possible underlying factors for this trend. One is that there is
now a greater accessibility to public education in Turkey among the working population while
the second possible reason to the trend is that the severe economic crisis that Turkey had to
endure in 2001 had adversely affected the labor market. They also observed that within group
inequality among male wage earners had increased between the two periods studied. They
attributed this to several recent economic developments in Turkey including increased foreign
direct investment inflows, openness to trade as well as technological developments which
favored skilled labor.
To my knowledge, there is no existing study which has used the quantile regression
analysis in understanding the returns to education among Bumiputeras in Malaysia. Hence the
research findings in this paper will contribute significantly to this literature and will have
important implications for policy making especially in education.
Data and Methods
The research in this paper is based on sub-samples of the 2012 and 1995 Household
14
are used from the 2012 sample while from the 1995 sample, a total of 1208 Bumiputeras are
used. It is also important to note that the Bumiputeras sampled in both surveys are head of
households. While the data do include information such as level of education attainment,
different types of income sources and type of strata (rural or urban) as well as other important
variables, the data however is unweighted due to the relative smaller size of each sample
compared to the full sample of each respective household income survey.
The summary statistics of the variables used in this study can be found in Table 11 in the
appendix section. The Bumiputeras’ individual net income, measured in 2005 Ringgits, is the
total annual income after taking into account net transfers (such as taxes). The different sources
of income that make up the total net income include paid employment income, other earned
income and property income. In other words, the Bumiputeras’ paid employment income is a
subset of net income and is also measured annually in 2005 ringgits.
A series of dummy variables are created to designate the different levels of education
attainment among the Bumiputeras in both 2012 and 1995. These dummy variables include
Bumiputeras who 1) did not attend high school 2) have some high school education 3) completed
high school 4) have some college education and 5) completed college or higher. These dummy
variables are created based on the data on highest education certificate achieved by each
Bumiputera. Bumiputeras who attained a diploma (or an Associate’s degree) for example are
categorized as individuals who have some college education since they did not complete a
typical 3 or 4 years college degree program.
In line with the spirit of the Mincer equation, an age variable as well as its squared term
15
experience conventionally used in the Mincer equation. Other explanatory variables that are used
in this study include 1) a strata dummy variable to designate if the Bumiputera lives in urban or
rural area 2) a region dummy variable to designate if the Bumiputera lives in Peninsular or East
Malaysia 4) a gender dummy variable 5) a marital status dummy variable to designate if the
Bumiputera is married or not and lastly 6) a variable which depicts the size of the Bumiputera’s
household since the Bumiputeras studied in this research are head of households.
As highlighted earlier, the research in this paper uses the Mincer human capital earnings
function to estimate the returns to education among Bumiputeras in Malaysia. The Mincer
equation will be estimated first using ordinary least squares (OLS) and subsequently quantile
regression. The OLS is first estimated to provide a general understanding of the returns to
education on average across the Bumiputera population for both years. The findings in the OLS
regression are then compared to the findings in the quantile regression. As discussed later in this
paper, the findings from both models share a consistent pattern.
The empirical model or the OLS version of the Mincer equation looks like below:
2)
Two different OLS equations will be estimated. In one specification, the natural log of
annual net income will be used as the dependent variable while in the second the natural log of
annual paid employment income will be used. Also, as discussed earlier, instead of using an
“experience” variable as defined in the conventional Mincer equation, this research has instead
used the individual’s age to proxy for experience due to data limitations to estimate the age of
16
compute the experience variable in the equation by taking the assumption that a child begins
schooling at the age of 7 and starts working immediately after completing schooling.
Unfortunately, this will be difficult to achieve since unlike Kenayathulla (2013), the sample used
for research in this paper did not have data on years of schooling. One limitation of the model in
this research is that it does not distinguish the different types of occupation and employment of
each individual.
It is important to also highlight why Tobit regression analysis is not used in this research.
The Tobit regression is often used to address individuals who report zero income. This however
is not regarded as an important issue in this research since there is only one observation with
zero income in the 1995 sample and none in the 2012 sample. Furthermore, following Deaton
(1997) this research advocates the use of OLS simply on the basis that zero income represents
valid observations. In addition to that, the presence of zero income as an extreme value will not
be much of a factor in the quantile regression analysis since (as discussed shortly) quantile
regression is robust to extreme values.
A separate OLS regression using the natural log of paid employment income will also be
estimated for male and female sub-samples for both 1995 and 2012 similar to Kenayathulla
(2013). A Heckman correction model will also be estimated to address the selectivity bias
inherent in the sample among female respondents as highlighted by that same study. The purpose
of this is to understand if there are systematic differences between male and female Bumiputeras
in terms of their returns to education.
The quantile regression method was first introduced by Koenker and Bassett (1978).
17
cases in which linear models yield non-normal errors. As highlighted by Arabsheibani, Carmeiro
and Hanley (2003), studies that modeled average earnings through an OLS setting fail to reveal
the non-constant effects of education on earnings across different levels of income attainment.
Similarly, Tansel and Bircan (2011) opined that it is of interest to know the effects of the
exogenous variables at different points of the distribution of the dependent variable. This can be
achieved via a quantile regression method. The quantile regression model in this research is
defined as below:
3)
( | )
Where ( | ) denotes the θth conditional quantile of lnW given X. The quantile regression minimizes an asymmetrically weighted sum of absolute errors and not the sum of
squared errors (Koenker and Hallock, 2001). In addition to this, the quantile regression provides
estimates that are robust to the outliers of the dependent variable and are more efficient than the
OLS in cases where error terms are not normal. The quantile regression model specification in
this research will be the same as the OLS model above where two separate versions will be
estimated. The first uses the natural log of net income while the second uses the natural log of
18
Results and Discussions
Descriptive Statistics
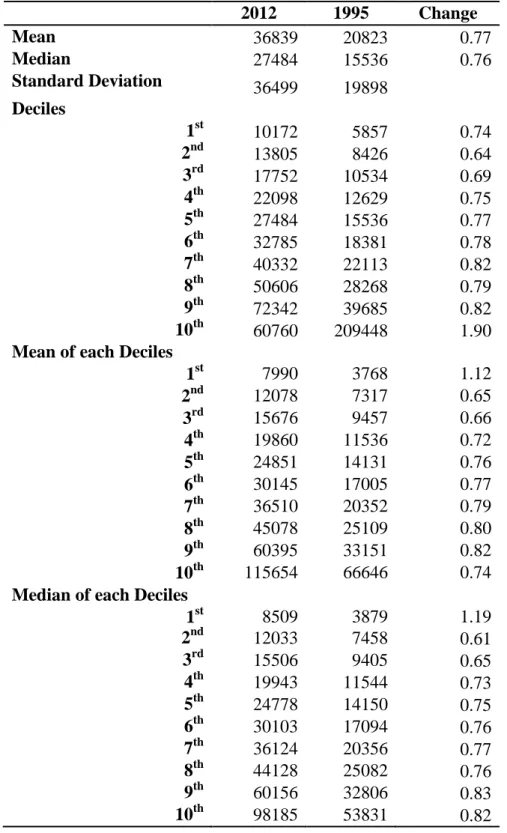
Table 1 presents the summary of average real income (measured in 2005 Ringgits)
among Bumiputeras within the sample studied for 1995 and 2012. It is found that real income
among Bumiputeras has increased at all levels of deciles with the greatest increase witnessed in
the bottom decile. The average real income in the bottom decile was RM 7990 in 2012 while it
was RM 3768 in 1995. This corresponds to an increase of 112 percent. The findings from Tables
2 and 3 which tabulate the ratio between each decile for both years and the changes in each ratio
respectively further illustrate the findings in Table 1. Both tables show that the gap between the
bottom decile and each of the other subsequent upper deciles to have reduced from 1995 to 2012.
One possible explanation of these findings is that the affirmative action policies that Malaysia
has undertaken since the implementation of the New Economic Policy (NEP) in the 1970s and
subsequently the National Development Policy (NDP) and the National Vision Policy (NVP)
might have been successful in reducing the poverty. Studies such as Snodgrass et al. (2001) and
Ragayah (2008) for example have applauded the success of these programs in reducing poverty.
Furthermore, average and median real income increase at a higher rate at higher deciles
in both years. Still, this difference in income growth rates across the upper and lower deciles
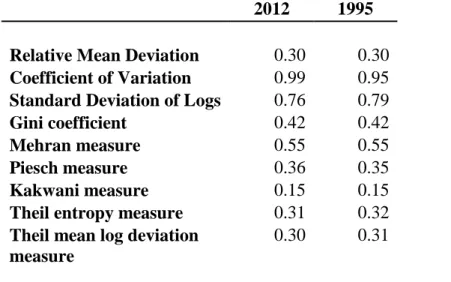
does not correspond to an increase in inequality within the sample studied. Table 4 presents a
series of inequality measures. The Gini coefficient for example did not change significantly from
1995 to 2012. However, when the data for urban and rural areas are separated, a different story
emerges. Table 5 shows that from 1995 to 2012, the Gini coefficient for both the urban and rural
19
0.40 in 1995 to 0.42 in 2012. Also, Inequality also remains higher in urban areas compared to
rural areas. This is also in line with the findings of Ismail and Yussof (2010) who reported that
Gini coefficients in urban areas were higher than rural areas in Malaysia from 1999 to 2007.
Table 6 presents the average net income attainment for female and male Bumiputeras
within the sample. The table shows that the average net income for female Bumiputeras to be
lower than their male counterparts for both years although the average net income for both
genders have improved during the same period. In addition, the net income gap between female
and male Bumiputeras within the sample has reduced from 1995 to 2012. In 1995, women’s
average net income was 84 percent less than men but it decreased to 70 percent in 2012. This
also corresponds to the findings from an earlier study by Chapman and Harding (1987) who
found that women earned only 71 percent of the earnings of men. Chapman and Harding,
however, cautioned that one reason to the witnessed trend is that women tend to work in lower
paying jobs.
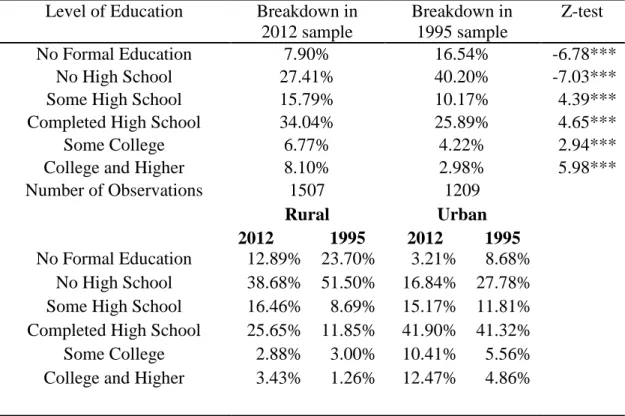
Table 7 presents the proportion of Bumiputeras classified according to their education
attainment for 1995 and 2012. Generally, education attainment among Bumiputeras has
improved at all levels of education between 1995 and 2012. The greatest improvement is
exhibited at the tertiary level where Bumiputeras who have completed college increased from
1995 to 2012. Additionally, the difference in percentages for education attainment between the
two years across each level of education attainment showed statistical significance at the 1
percent level.
The general increase of education attainment among the Bumiputera population from
20
in Malaysia as discussed in the introduction. Additionally, the improvement in the percentage of
Bumiputeras who completed college can be reflected by the general increase in total enrollments
in tertiary education institutions in Malaysia from 2000 to 2010. For example, 574,421
Bumiputeras were enrolled in a tertiary education institution in Malaysia in 2000. By 2010, the
enrollment more than doubled to 1,326,340 (Ismail and Yussoff, 2010).
The findings here also further validate the success of affirmative action policies for the
Bumiputera population in the education sector recorded by earlier studies. For example, 75
percent of the newly admitted students to Malaysian public universities between 1976 and 1977
were Malays (Tan, 1982). By 1985, the share of Bumiputera enrollment in public universities
increased to 63 percent from 38 percent in 1970. Moreover, government scholarships for local
and overseas education are also largely reserved for Bumiputeras. For example, 95 percent of the
overseas scholarships for tertiary education offered by the Malaysian government between 1980
and 1984 went to Bumiputera recipients (Brown, 2007).
Education attainment across strata has also improved from 1995 to 2012 based on the
sample. Table 7 also shows that the percentage of Bumiputeras in both rural and urban areas who
did not have any formal schooling reduced from 1995 to 2012. In 1995, 23.7 percent of
Bumiputeras from rural areas in the sample did not have any formal schooling but by 2012, it has
reduced to 12.9 percent. Similarly, 8.6 percent of the Bumiputeras from urban areas did not have
any formal schooling in 1995 while the number is only 3.2 percent in 2012. On the other hand,
while only 4.9 percent of the Bumiputeras who live in urban areas completed college in 1995,
21
Still, urban Bumiputeras are more likely to obtain a tertiary education compared to rural
Bumiputeras. This finding is also reflected in a number of studies in the literature. Lee (2005)
pointed that children of Bumiputeras who live in urban areas have an advantage relative to rural
Bumiputeras due to greater access to the preferential policies such as the education quotas set at
public tertiary institutions. Furthermore, Mehmet and Yip (1986) investigated how the Malaysian
government awarded scholarships for tertiary education and found that these scholarships were
distributed regressively with most of these scholarships being awarded to higher income
Bumiputera households. Richer Bumiputera students are 21 times more likely to obtain a
scholarship than the poorest Malays.
Similarly, Nicholas (2000) has also found this phenomenon to be true for non-Malay
Bumiputeras (or native Malaysians). Using the 1991 census statistics, Nicholas found that native
Malaysians who lived in urban areas at the time of the census actually completed higher levels of
education. For example, about 10 percent of urban native Malaysians completed upper secondary
education while 5 percent obtained tertiary education. On the other hand, only 1.6 percent of the
rural native Malaysians completed upper secondary school and a mere 0.2 percent obtained
tertiary education.
There is also evidence that improvement in education attainment between the two studied
periods might have contributed to the improvement in income attainment. Table 8 presents the
average real income across different education levels for both 2012 and 1995. This table shows
that average income across different levels of education in the sample has increased from 1995 to
22
Table 9 presents the proportion of Bumiputeras with different education levels across the
different deciles of the income distribution within the sample studied. The proportion of
Bumiputeras who did not have any formal schooling shows a declining trend from the lower
deciles to higher deciles while the proportion of Bumiputeras who either completed high school
or attained a college degree increases across the same deciles. The association between
educational attainment and income inequality is also exhibited in Table 8 which shows that the
Gini coefficient, particularly for Bumiputeras who have attained a certain level of education, has
declined from 1995 to 2012. In the sample studied here for example, an improvement in the
proportion of Bumiputeras who attained a certain college education corresponds to an
improvement in inequality. The Gini coefficient for Bumiputeras who completed college for
example declined from 0.36 in 1995 to 0.33 in 2012.
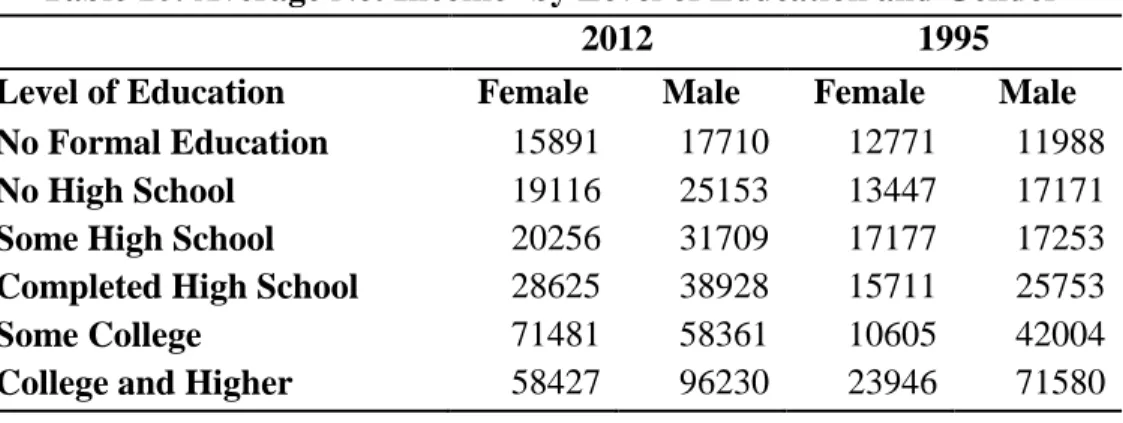
It is also interesting to see how income among female and male Bumiputeras is
distributed given the same level of education level. Table 10 presents the average net income
across the two genders at different education levels. One weakness of this analysis however, is
that there is only a small number of observations for female Bumiputeras at each education level.
Still, table 10 shows that generally, at each level of education, average net income for females is
lower than for males. These findings are similar to Kenayathulla (2013) who found that females
earned about 60 to 80 percent of males’ earnings with similar education levels.
Regression Analysis
The summary statistics of the variables used to estimate equations (2) and (3) are
presented in Table 11 and the estimated coefficients for both specifications of equation (2) are
23
Breusch-Pagan tests indicate the presence of heteroscedasticity, the OLS models are also
estimated with robust standard errors. Robust standard errors are important in this case since it
relaxes the assumption that errors are homoscedastic (Wooldridge, 2002).
Firstly, for both years, the model depicts that higher levels of education are associated
with higher returns to education. For example, in the year 2012, the returns to education are
about 1.59 times higher for Bumiputeras who completed college compared to those who did not
have any formal schooling. The findings here concur with Kenayathulla (2013) who concluded
that returns to education are highest at the secondary and tertiary level. Secondly, experience as
approximated by age also has a positive impact on returns of education in both years. An
additional year of age corresponds to an income increase of 3 and 4 percent in 1995 and 2012
respectively.
Secondly, the OLS estimates also show that the real returns to education from 1995 to
2012 have declined at all levels of education. For example, returns to education were 1.94 times
higher for Bumiputeras who completed college compared to those of Bumiputeras who did not
have any formal schooling but in 2012 that figure reduced to 1.59.
Thirdly, the estimates of the rates of return to education are higher across all education
levels in the OLS model which uses natural log of paid employment income as the dependent
variable than in the model where net income is used. All in all, the trends in returns to education
that are estimated under the paid employment OLS model are similar to the trends that are
estimated under the net income OLS model.
A Heckman correction model is then used to study the returns to education for both male
24
address the sample selectivity bias that may have influenced the estimates on returns to
education. To perform the estimation of the Heckman correction model, an initial OLS model is
estimated for the male and female samples for both 1995 and 2012. Table 13(a) and Table 13(b)
present the results from these models. Again, the dependent variable in this case is paid
employment income. Also, the estimates reported here are with robust standard errors after
having found that errors are not homoscedastic under the Breusch-Pagan test.
In the OLS estimates of the two models for both years, it is found that the returns to
education for male Bumiputeras are higher than for female Bumiputeras. However, a closer look
at the 95 percent confidence level reported in Table 13(b) indicates that this difference is not
systematic as the confidence intervals overlap.
Tables 14 and 15 present the results from the quantile regressions for both 2012 and
1995 respectively. The dependent variable estimated in these models is the natural log of real net
income of Bumiputeras. The estimates are reported with robust standard errors. Each of the
quantile regression is estimated at the 10th, 20th, 30th and so on up to the 90th quantile for each year.
A number of findings can be drawn from the regression results. Firstly, consistent with
the human capital theory and the earlier findings in this research, returns to education increases
with the level of education at all quantiles for 2012 and 1995. For example, in 2012,
Bumiputeras who completed college education have returns to education that are about 1.49 to
1.66 times higher than those without any formal schooling. Secondly, for 1995 a declining trend
of returns to education is observed particularly for Bumiputeras who completed high school or
25
is about 2.47 times higher than those who did not have any formal schooling at the 10th quantile. However, at the 90th quantile, the returns to education for Bumiputeras who have the same level of education are about only 2.0 times higher than those who did not have any formal schooling.
The results are however mixed for the 2012 sample though. In the case for Bumiputeras
who have completed a college education, the returns to education are fairly similar across the
quantiles. Bumiputeras who completed college have returns to education of about 1.55, 1.57 and
1.58 times higher than those who did not have any formal schooling at the bottom, middle and
top quantiles respectively. However, for Bumiputeras who have completed high school there is
an increasing returns to education across the quantiles. For example, Bumiputeras who have
completed high school have returns to education about 0.68 times higher than Bumiputeras who
did not have any formal schooling at the 10th quantile while at the 90th quantile they have 0.82 times more.
Thirdly, consistent with the earlier findings of this research, the real returns to education
for each level of education across each quantile have declined from 1995 to 2012. The returns to
education for Bumiputeras who have a college education are about 2.0 times higher at the 90th quantile in 1995. That estimate however declined in 2012 when the same returns to education are
only 1.58 times higher.
Tables 16 and 17 present the results from the quantile regressions for both 2012 and 1995
respectively using the natural log of paid employment income as the dependent variable. Again,
the estimates are reported with robust standard errors. Similar to the findings in the earlier OLS
regression, the returns to education are much higher when paid employment income is used
26
quantile for both years. For example, returns to education for Bumiputera who completed college
is 1.74 and 2.03 times higher than those who did not have any schooling for 1995 and 2012
respectively when paid employment income is used but returns to education are 1.59 and 2.00
times higher respectively for the same category of Bumiputeras when net income is used.
In short, Tables 16 and 17 also present similar findings that are discussed earlier.
Particularly, returns to education at a given level of education decline across the quantiles. This
pattern is more consistent across each level of education when paid employment income is used
compared to the net income specification. This is to say, the impact of a given level of education
is higher for Bumiputeras in the lower quantiles compared to those in the upper quantiles. This
implies that poorer Bumiputeras will benefit more from a given level of education than richer
Bumiputeras. In addition to that, it is again seen that real returns to education have declined from
1995 to 2012.
Based on the results discussed above, it seems that education has a greater impact on
returns to education when paid employment income is used as the dependent variable. One
reason as to why such a pattern is observed here is that education in Malaysia is heavily
subsidized through the financing that the government has undertaken. Psacharopoulos (1994)
highlighted this pattern and noted that individuals in countries that regularly subsidize its
education experience higher returns to education.
Furthermore, the returns to education across the quantiles for both years exhibit a trend of
diminishing returns. Psacharopoulos (1994) has also highlighted this particular phenomenon that
private as well as social returns to education decline with an increase in a country’s per capita
27
lowest quantile to the top quantile. This is also a reflection of the law of diminishing returns to
human capital formation at the margin (Psacharoupoulos, 1994). In other words, the impact of a
given level of education attainment will be higher for poorer Bumiputeras compared to richer
Bumiputeras. In addition to that, the findings from Psacharoupoulos (1994) can also help explain
why the real returns to education have declined from 1995 to 2012. As discussed earlier, the
average real net income for Bumiputeras within the sample studied has also increased from 1995
to 2012. As such, the law of diminishing returns to education will also hold when taking into
account the increase in average net income among Bumiputeras from 1995 to 2012. This is to
say, the effect of a certain level of education attainment on returns to education will be higher for
Bumiputeras in 1995 compared to 2012.
Policy Implications
Based on the findings of the quantile regression analyses, it is clear that for both years,
the returns to education exhibit a pattern of diminishing returns across the quantiles. Bumiputeras
in the lower quantiles experience higher returns to education relative to those at the upper
quantiles. In other words, poorer Bumiputeras gain more from a given level of education when
compared to richer Bumiputeras.
One possible policy implication of the above findings is to extend education
opportunities to Bumiputeras in the lower quantiles of the income distribution. The 2001 to 2010
Malaysian Education Blueprint for example has stressed to increase the percentage of single
session schools for both at the primary and secondary level. This is because, under this
28
the rural areas, where most of the poorer Bumiputeras would normally be concentrated (Cheong,
Selvaratnam, & Goh, 2011).
In addition to that, it is also found that the returns to education for Bumiputeras who
completed college to be highest in the lower quantiles. This implies that further education
policies should be extended to promote college education among poorer Bumiputeras. This can
perhaps be achieved via more comprehensive needs-based affirmative action policies that can be
extended to this group of Bumiputeras. However, there are a number of challenges to effectively
implement this policy goal.
Firstly, based on the earlier findings in this research, urban Bumiputeras are more likely
to obtain a tertiary education compared to rural Bumiputeras. Such a finding is also reflected in
Lee (2005) who pointed that children of Bumiputeras who live in urban areas have greater access
to the preferential policies such as the education quotas set at public tertiary institutions. Mehmet
and Yip (1986) have also found that governmental scholarships were distributed in a manner in
which richer Bumiputera students are more likely to obtain a scholarship than poorer ones
While it is logical to argue that affirmative action policies can promote education
attainment at the tertiary level, such policies should be designed to ensure that it actually reaches
the poorer Bumiputeras. Governmental scholarships for tertiary education for example, should be
extended to Bumiputeras who really need them. Admissions to public universities in Malaysia
29
Summary and Conclusion
This paper studies the income distribution and returns to education and its changes from
1995 to 2012 among Bumiputeras in Malaysia. Interpretation of the descriptive statistic shows
that the average income increases with the level of education, consistent with the human capital
theory. Also, while income inequality measures have not changed from 1995 to 2012, urban
inequality remains higher than rural inequality.
To study the returns to education, the Mincer equation was estimated using both the OLS
and quantile regressions. Firstly, consistent with the human capital theory, it was found that
returns to education increase with the level of education across both years. Secondly, in the
quantile regression, returns to education generally show diminishing returns across the quantiles.
In other words, poorer Bumiputeras gain more from a given level of education as compared to
richer Bumiputeras.
By identifying that the returns to education to be highest for Bumiputeras in the lower
quantiles, this paper suggests policies to be enacted to extend education opportunities to poorer
Bumiputeras. This can perhaps be achieved via more comprehensive needs-based affirmative
action policies for this group. Extension of governmental scholarships for tertiary education to
poorer Bumiputeras can be one example.
There are a number of weaknesses in the research in this paper. Firstly, while the quantile
regression method used in this research has provided a useful understanding on how returns to
education change across the income distribution, findings will be richer if a larger dataset is
used. This is especially true when taking into account the dispersion of data within each quantile.
30
variables such as the types of employment and occupational sectors. Both factors may potentially
affect income attainment and thus the returns to education. Thirdly, the Mincer equation used in
this research did not include “years of schooling” as this information was not provided in the
data set. In addition to that, this research was also unable to calculate the years of experience for
31 Bibliography
Abadie, A. (1997). Changes in Spanish Labor Income Structure during the 1980's: A Quantile Regression Approach. Investigaciones Economicas, 21(2), 253-272.
Andini, C. (2007). Within-Groups Wage Inequality and Schooling: Further Evidence for Portugal. Bonn, Germany: Institute for the Study of Labor (IZA) Discussion Paper No. 2828.
Arabsheibani , G. R., & Riss, H. (1998). On the Weak Versus Strong Version of the Screening Hypothesis: A Re-examination of the P-test for the U.K. Economics of Education, 17(2), 189-192.
Arabsheibani, G. R., Carnerio, F., & Hanley, A. (2003). Human Capital and Earnings
Inequality: Quintile Regression Evidence. World Bank Institute Policy Research Working Paper 3147.
Becker, G. (1964). Human Capital : A Theoretical and Empirical Analysis, with Special Reference to Education. Chicago: University of Chicago Press.
Blom, A., Holm-Nielsen, & Verner, D. (2001). Education, Earnings and Inequality in Brazil, 1982-1998: Implications for Education Policy. Journal of Educaiton, 76((3&4)), 180-221.
Brown, Graham K. 2007. " making Ethnic Citizens: The Politics and Practice of Education in Malaysia." International Journal of Educational Development 27(3), 318-330
Brunello, G., & Comi, S. (2000). Education and Earnings Growth Evidence from 11 European Countries. Bonn, Germany: Institute for the Study of Labor (IZA).
Buchinsky, M. (1994). Changes in the U.S Wage Structure 1963-1987: Application of Quantile Regression. Econometrica, 62(2), 405-458.
Budria, S., & Moro-Egido, A. I. (2008). Eudcation, Educational Mismatch and Wage Inequality : Evidence from Spain. Economics of Education Review, 27(3), 332-341.
Cheong, K.-C., Selvaratnam, V., & Goh, K.-L. (2011). Education in Human Capital Formation. In R. Rasiah, Malaysian Economy : Unfolding Growth and Social Change (pp. 159-184). Kuala Lumpur: Oxford University Press.
32
Deaton, Angus (1997), "The Analysis of Household Surveys: A Microeconometric Approach to Development Policy, Baltimore: John Hopkins University Press.
Falaris, E. M. (2008). A Quantile Regression Analysis of Wages in Panama. Review of Development Economics, 12(3), 298-514.
Girma, S., & Kedir, A. (2003). Is Education More Beneficial to the Less Able? Econometric Evidence from Ethiopia. Department of Economics, Universityof Leicester Working Paper No: 03/1.
Grimm, M. (2004). The Medium and Long Term Effect of an Expansion of Education on Poverty in Cote d'Ivore : A Dynamic Microsimulation. United Nations University Research Paper No 2004/32.
Hartog, J., Pereia, P., & Vieira, A. C. (2001). Changing Returns to Education in Portugal During the 1980s and Early 1990s: OLS and Quantile Regression Estimators. Applied
Economics, 33, 1021-1037.
Idrus, A., & Cameron, S. (2000). Returns to Education between the Self-employed and
Employed Sectors: Evidence from Malaysia. The Pakistan Development Review, 39(4), 263-268.
Ismail, R., & Jajri, I. (2012). Gender Wage Differentials and Discrimination in Malaysian Labour Market. World Applied Sciences Journal, 19(5), 719-728.
Ismail, R., & Yussof, I. (2010). Human Capital and Income Distribution in Malaysia : A Case Study. Journal of Eocnomic Cooperation and Development, 31(2), 25-46.
Jobstreet. (2013). Job Market 2013 : The New Trends. Jobstreet. Retrieved from
http://www.mscmalaysia.my/sites/default/files/people-development/Talent_Conference_2013/2%20Job%20Market%202013%20The%20New %20Hiring%20Trends.pdf
Koenker, R., & Basset, G. (1978). Regression Quantiles. Econometrica, 15(4), 33-50.
Koenker, R., & Hallock, K. (2001). Quantile Regression. Journal of Economic Perspective, 15(4), 143-156.
Lee, H. G. (2005). Affirmative Action in Malaysia. Southern Asian Affairs , 211-228.
Lemieux, T. (2007). The Changing Nature of Wage Inequality. Cambridge, Massachusets: National Bureau of Economic Research (NBER) Working Paper No : 4716.
33
Malaysia. (2001). Midterm Review of Eighth Malaysia Plan, 2001-2005. Kuala Lumpur: National Publications.
Malaysia. (2005). Malaysia Quality of Life 2004. Kuala Lumpur: National Publications.
Malaysia. (2006). Ninth Malaysia Plan 2006-2010. Kuala Lumpur: National Publications.
Mankiw, G. N., Romer, D., & Weil, D. N. (1992). A Contribution to the Empirics of Economic Growth. The Quaterly Journal of Economics, 107(2), 407-437.
Mehmet, O., & Yip, Y. H. (1986). Human Capital Formation in Malaysian Universities. Kuala Lumpur: University of Malaya.
Mincer, J. (1974). Schooling, Experience and Earnings. Human Behavior and Social Science Institutions No 2.
Ministry of Finance Malaysia. (2009). Mid-Term Review of the Ninth Malaysia Plan 2006-2010.
Retrieved from http://www.epu.gov.my/midtermreviewninty
Ministry of Women, Family and Community. (2007). Measuring and Monitoring Gender Equality: Malaysian's Gender Gap Index.
Mwabu, G., & Schultz, T. (1996). Education Returns Acoss Quantiles of the Wage Function : Alternative Explanations for Returns to Education by Race in South Africa. The American Economic Review Papers and Proceedings, 169-182.
Nagaraj, S., Chew, S. B., & Rahimah. (2009). Education and Work : The World Of Work. Kuala Lumpur: Faculty of Economics and Administration, University of Malaya.
Nicholas, C. (2000). The Orang Asli and The Contest for Resources. Kuala Lumpur: Vinlin Press Sdn Bhd.
Patrinos, H. A., Ridao-Cano, C., & Sekellarion, C. (2009). A Note on Schooling and Wage Inequality in Public and Private Sector. Empirical Economics, 37, 383-392.
Pemandu. (2012). SRI : Education. In Pemandu, ETP Annual Report 2012 (pp. 198-219). Kuala Lumpur: National Publications.
Podder, N. (2003). Human Capital and Earnings Inequality:Some Considerations of Distributive Justice with Illustrations from Australia. Inequality, Poverty and Human Well-being Conference. Finland.
34
Pscaharopoulos, G., & Patrinos, H. (2004). Returns to Investment in Education: Concepts and Methods. Human Capital Development and Operations Policy Working Paper 63.
Ragayah, M. Z. (2008). Income Inequality in Malaysia. Asian Economic Policy Review, 3(3), 114-132.
Rasiah, R. (2011). Overview of Malaysian Economy. In R. Rasiah, Malaysian Economy Unfolding Growth and Social Change (pp. 1-20). Kuala Lumpur: Oxford University Press.
Schultz, T. W. (1960). Investment in Human Capital. American Economic Review, 51(1), 1-17.
Snodgrass, D. (1990). Inequality and Economic Development in Malaysia. Oxford: Oxford University Press.
Sousounis, P. (2009). Estimating the Effect of State Dependence in Work-Related Training Participation Among British Employees. Bristol, United Kingdom: Bristol Business School, University of West England : Working Paper 0920.
Tan , T. W. (1982). Income Distribution and Determination in West Malaysia . Kuala Lumpur: Oxford University Press.
Tansel, A., & Bircan , F. (2011). Wage Inequality and Returns to Education in Trueky : A Quantile Regression Analysis. Koc University-Tusiad Economic Research Forum Working Paper 1102.
Wooldridge, J. (2002). Econometric Analysis of Cross Section and Panel Data. The MIT Press.
World Bank. (2007). Malaysia and the Knowledge Economy: Building a World Class Higher Education System. Washington D.C: Report No. 40397-MY.
35
Appendix
Table 1: Summary Statistics of Bumiputeras’ Net Income+ for 1995 and 2012
2012 1995 Change
Mean 36839 20823 0.77
Median 27484 15536 0.76
Standard Deviation 36499 19898
Deciles
1st 10172 5857 0.74
2nd 13805 8426 0.64
3rd 17752 10534 0.69
4th 22098 12629 0.75
5th 27484 15536 0.77
6th 32785 18381 0.78
7th 40332 22113 0.82
8th 50606 28268 0.79
9th 72342 39685 0.82
10th 60760 209448 1.90
Mean of each Deciles
1st 7990 3768 1.12
2nd 12078 7317 0.65
3rd 15676 9457 0.66
4th 19860 11536 0.72
5th 24851 14131 0.76
6th 30145 17005 0.77
7th 36510 20352 0.79
8th 45078 25109 0.80
9th 60395 33151 0.82
10th 115654 66646 0.74
Median of each Deciles
1st 8509 3879 1.19
2nd 12033 7458 0.61
3rd 15506 9405 0.65
4th 19943 11544 0.73
5th 24778 14150 0.75
6th 30103 17094 0.76
7th 36124 20356 0.77
8th 44128 25082 0.76
9th 60156 32806 0.83
10th 98185 53831 0.82
Notes: +
36
Table 2: Ratios of Bumiputeras’ Median Net Income+ Between Deciles in 1995 and 2012
2012
Deciles 1st 2nd 3rd 4th 5th 6th 7th 8th 9th 10th
1st 1 - - - -
2nd 1.41 1 - - - -
3rd 1.82 1.28 1 - - - -
4th 2.34 1.65 1.28 1 - - - -
5th 2.91 2.05 1.59 1.24 1 - - - - -
6th 3.53 2.50 1.93 1.51 1.21 1 - - - -
7th 4.23 2.99 2.32 1.81 1.45 1.19 1 - - -
8th 5.17 3.65 2.84 2.21 1.78 1.46 1.22 1 - -
9th 7.06 4.99 3.87 3.01 2.43 1.99 1.66 1.36 1 -
10th 11.55 8.17 6.33 4.93 3.96 3.27 2.73 2.23 1.63 1
1995
Deciles 1st 2nd 3rd 4th 5th 6th 7th 8th 9th 10th
1st 1 - - - -
2nd 1.92 1 - - - -
3rd 2.42 1.26 1 - - - -
4th 2.98 1.55 1.23 1 - - - -
5th 3.64 1.90 1.50 1.23 1 - - - - -
6th 4.41 2.29 1.82 1.48 1.21 1 - - - -
7th 5.25 2.72 2.16 1.76 1.43 1.19 1 - - -
8th 6.46 3.36 2.67 2.17 1.77 1.46 1.23 1 - -
9th 8.45 4.39 3.48 2.84 2.32 1.92 1.61 1.31 1 -
10th 13.87 7.22 5.72 4.66 3.80 3.15 2.64 2.15 1.64 1
Notes:
+
37
Table 3: Changes in Bumiputeras’ Median Net Income Ratios Between Deciles for 1995 and 2012 Ratio Change from 1995 to 2012
Deciles 1st 2nd 3rd 4th 5th 6th 7th 8th 9th 10th
1st 1 - - - -
2nd -0.26 1 - - - -
3rd -0.25 0.02 1 - - - -
4th -0.21 0.07 0.05 1 - - - -
5th -0.20 0.08 0.06 0.01 1 - - - - -
6th -0.19 0.09 0.06 0.02 0.01 1 - - - -
7th -0.19 0.09 0.07 0.03 0.01 0.01 1 - - -
8th -0.19 0.08 0.06 0.02 0.01 -0.01 -0.01 1 - -
9th -0.16 0.13 0.11 0.06 0.05 0.04 0.03 0.04 1 -
10th -0.16 0.13 0.10 0.05 0.04 0.03 0.03 0.04 -0.01 1
Notes: +
38
Table 4: Inequality Measures for Bumiputeras’ Net Income+ for 1995 and 2012
2012 1995
Relative Mean Deviation 0.30 0.30
Coefficient of Variation 0.99 0.95
Standard Deviation of Logs 0.76 0.79
Gini coefficient 0.42 0.42
Mehran measure 0.55 0.55
Piesch measure 0.36 0.35
Kakwani measure 0.15 0.15
Theil entropy measure 0.31 0.32
Theil mean log deviation measure
0.30 0.31
Notes:
+
39
Table 5: Summary Statistics for Rural and Urban Bumiputeras’ Net Income+ for 1995 and 2012
Rural Urban
2012 1995 2012 1995
Mean 28094 16317 45034 25774
Median 20377 12345 34587 18714
SD 28559 13599 40974 24118
Gini 0.41 0.39 0.42 0.40
Notes:
+
40
Table 6: Summary Statistics for Male and Female Bumiputeras’ Net Income+ for 1995 and 2012
Male Female
2012 1995 2012 1995
Mean 38735 16268 27025 13703
Median 28914 21885 19523 11190
Stdev 37706 20612 27517 12044
Notes:
+