HIGH-
J
CO VERSUS FAR-INFRARED RELATIONS IN NORMAL AND STARBURST GALAXIES
Daizhong Liu1,2,3, Yu Gao1, Kate Isaak4, Emanuele Daddi3, Chentao Yang1,2,5, Nanyao Lu6, and Paul van der Werf7
1
Purple Mountain Observatory/Key Laboratory for Radio Astronomy, Chinese Academy of Sciences, Nanjing, China;[email protected]
2
University of Chinese Academy of Sciences, Beijing, China 3
CEA Saclay, Laboratoire AIM-CNRS-Université Paris Diderot, IRFU/SAp, Orme des Merisiers, F-91191 Gif-sur-Yvette, France 4
Scientific Support Office, ESTEC/SRE-S Keplerlaan 1, NL-2201 AZ, Noordwijk, The Netherlands 5Institut d’Astrophysique Spatiale, Bât 121, Université Paris-Sud, F-91405 Orsay, France 6
Infrared Processing and Analysis Center, California Institute of Technology, MS 100-22, Pasadena, CA 91125, USA 7Leiden Observatory, Leiden University, Post Office Box 9513, NL-2300 RA Leiden, The Netherlands
Received 2015 May 20; accepted 2015 August 2; published 2015 September 1
ABSTRACT
We present correlations between 9 CO transitions (J=4 3– to12 11– ) and beam-matched far-infrared (far-IR) luminosities(LFIR,b)among 167 local galaxies, usingHerschelSpectral and Photometric Imaging ReceiverFourier
Transform Spectrometer (SPIRE; FTS)spectroscopic data and Photoconductor Array Camera and Spectrometer (PACS)photometry data. We adopt entire-galaxy FIR luminosities(LFIR,e)from theIRASRevised Bright Galaxy
Sample and correct toLFIR,busing PACS images to match the varying FTS beam sizes. All 9 correlations between
L¢CO and LFIR,b are essentially linear and tight (s=0.2 0.3 dex– dispersion), even for the highest transition,
J = 12–11. This supports the notion that the star formation rate (SFR) is linearly correlated with the dense molecular gas(nH2 104 6cm 3
- - ). We divide the entire sample into three subsamples andfind that smaller sample
sizes can induce large differences in the correlation slopes. We also derive an average CO spectral line energy distribution for the entire sample and discuss the implied average molecular gas properties for these local galaxies. We further extend our sample to high-z galaxies with CO(J=5 4– ) data from the literature as an example, including submillimeter galaxies(SMGs)and“normal”star-forming BzKs. BzKs have similar FIR/CO(5–4)ratios as those of local galaxies, and agreeably follow the locally-determined correlation, whereas SMG ratios fall around or slightly above the local correlation with large uncertainties. Finally, by including Galactic CO(J=10 9– )data as well as very limited high-z CO(J=10–9)data, we verify that the CO(J=10 9– )–FIR correlation successfully extends to Galactic young stellar objects, suggesting that linear correlations are valid over 15 orders of magnitude.
Key words:galaxies: ISM– galaxies: starburst–infrared: ISM– ISM: molecules
1. INTRODUCTION
Molecular gas is the raw material from which stars are formed, hence its presence and physical conditions correlate with the star formation rate (SFR). A well-known correlation between gas surface density and SFR surface density is the Kennicutt–Schmidt law (K–S law): SSFR =ASgasN, with a
slope N=1.40.15(Kennicutt 1998), whereSSFR is based
on Ha luminosity or far-infrared (far-IR) luminosity (LFIR,
40 400 m– m )and Sgas is the sum of the atomic gas (fromHI
observations) and molecular gas (inferred from CO(1–0) line luminosity)surface density. This quantitative correlation serves as a fundamental input to most cosmological simulations(e.g., Springel & Hernquist 2003; Mac Low & Klessen 2004; Krumholz & McKee 2005; Krumholz & Thompson 2007; Narayanan et al. 2008). However, it brushes over and/or oversimplifies the relationship between the individual gas components and star formation (SF). First, observations have shown that the presence and state of the atomic gas component has little impact on SF (e.g., Bigiel et al. 2008; Liu &
Gao 2012; Schruba 2013; Liu et al. 2015). Second, the
correlation between the most widely used molecular gas tracer, CO(1–0), and LFIR is found to be more complex than just a
single power law: Gao & Solomon(2004)showed that the CO (1–0)–FIR slope changes from 1.27 to 1.73 with different sample selections, e.g., including only normal star-forming galaxies(SFGs:LIR<1011L), or adding(ultra-)luminous IR
galaxies (LIRGs: LIR =1011 12– L; ULIRGs:LIR>1013L), respectively. Greve et al.(2014, hereafterG14)showed similar slope variations from 0.9 to 1.4 by analyzing a large number of
data from the literature. It is thus questionable that a single power-law relation exists between CO(1–0) and FIR and whether it can be applied to all galaxies even if it exists.
CO(1–0)has a low critical density(nH ,crit2 ~2 ´10 cm3 3),
-and thus traces the total amount of molecular gas. It provides no physical insight into the higher density gas (nH2>10 cm4 3
-) that is known to be found at the formation
sites of individual stars (Kennicutt & Evans 2012). The sensitivity of the CO (JuJu-1) transition to denser/ warmer gas increases with an increasing upper level (Ju): for example, CO(10–9)has a critical density ofnH ,crit2 ~10 cm6 3
-(Carilli & Walter 2013). In contrast, the ground-J of high dipole-moment molecules such as HCN and HCO+ already have nH ,crit2 ~10 cm6 3
-, thus probing the dense gas in cold
phase. Studies based on HCN(Gao & Solomon2004; Wu et al. 2005,2010)and high-JCS (Zhang et al.2014)have found a unified linear correlation between dense gas and the SFR, describing the scenario in which all dense gas above a certain density threshold has a similar efficiency/timescale to collapse and form new stars, thus linearly determining SFRs.
Until recently, published mid-to-high-J(Ju4) CO data in local galaxies were still scarce due to the challenges of observing at frequencies450 GHz from the ground. Bayet et al.(2009) performed large velocity gradient(LVG)modeling with ground-based Ju7 CO to extrapolate Ju>7 transitions for several
local galaxies. They found that CO versus total IR luminosity (LTIR, 8–1000μm) correlations have decreasing slopes for
increasing Ju, similar to what modelings and simulations predicted(Narayanan et al.2008; Juneau et al.2009).
More recently, G14 presented the Herschel Spectral and Photometric Imaging Receiver (SPIRE; Griffin et al. 2010) Fourier Transform Spectrometer (FTS, Naylor et al. 2010) high-JCO data from the HerCULES program (Van der Werf et al. 2010; Rosenberg et al. 2015). They find that up to CO (7–6)the CO versus TIR or FIR relations are all roughly linear, while for higher-Juthe correlations become sub-linear, similar to the results of Bayet et al.(2009).
In this work, we use a large SPIRE FTS data set to statistically determine the correlations between 9 L¢CO
(J=4 3 to 12 11– – ) and beam-matched LFIR,b, and to
deter-mine which transitions are the best tracers of SF. We also verify the slope variations against Ju and test the validity of dense gas versus SF relation at high-z. The sample, data, and method are described in Section2. The results and a discussion are given in Section 3. We adopt H0=73 km s ,-1
0.73, M 0.27
W =L W = .
2. SAMPLE AND DATA
The sample was selected from all public FTS observations in theHerschelScience Archive(HSA)of local galaxies that are in the IRAS Revised Bright Galaxy Sample (Sanders et al. 2003). A further selection criterion requiring the availability of 70–160μm band imaging data taken with Photoconductor Array Camera and Spectrometer(PACS, Poglitsch et al.2010) for galaxies partially resolved by the FTS beam (see Section2.1)was imposed to enable beam-matching techniques to be used in the analysis. Thefinal sample contains 167 local galaxies(z<0.064,dL<286 Mpc), including 124(U)LIRGs and 43 SFGs(see Rosenberg et al.(2015)and Lu et al.(2014) for details of the HerCULES and GOALS programs, respectively; details of the full data set are given in D. Liu et al.(2015, in preparation).
2.1. FTS CO Measurements
FTS has two bolometer arrays: the SLW bolometer array (446 989 GHz– ) and the SSW bolometer array: (959 1543 GHz– ). Two observing modes are used: single-pointing for point-like sources (mostly with angular size less than FTS beam sizes, and dL>30 Mpc), and mapping for nearby extended sources (dL<30 Mpc). In single-pointing observations the central bolometer of each array is coaligned with the target, while off-axis bolometers point to the off-center sky. Mapping observations perform jiggling to scan extended targets, and each individual bolometer will produce one spectrum at its own pointing (R.A., decl.). All mapping data and∼30% single-pointing data were reduced using SPIRE v12 calibration products and Herschel Interactive Processing Environment (HIPE v12.1.0, Ott 2010) pipelines, with the remainder reduced using SPIRE v10 calibration products +pipelines. We note that measured linefluxes for the two sets of the ∼30% single-pointing data show little difference (σ ∼ 8%). For single-pointing data, we use central bolometers to extract CO lines. For mapping data, which are usually for spatially-extended galaxies, we select individual bolometers that are >half-beam-separated (Nyquist sampling) to extract CO lines.
Note that FTS covers a wide range of frequencies and its beam size varies accordingly8:∼43″at CO(4–3)to∼17″at CO
(13–12), and is not a simple function of frequency. The beam size variation is well-calibrated for each central bolometer, but unavailable for off-axis bolometers. Thus we assign an additional 15% uncertainty for off-axis bolometers.
To derive CO line flux, we use two different line profile fitting functions in HIPE: a Sinc and a Sinc-convolved-Gaussian (SCG). A SCG, where a Gaussian line profile is convolved with the Sinc instrument response, is appropriate for observations of sources with broad/resolved lines(e.g., Zhao et al. 2013): in such cases a Sinc fit would underestimate the line flux by ∼40%. In the more common case where the CO line is not obviously resolved, the SCG-derived fluxes are systematically larger by<20%. Given that a large fraction of single-pointing data have broad/resolved lines while mapping data do not, here we use SCG and Sinc for single-pointing and mapping data, respectively, although we note that using only SCG or Sinc for all data has no significant change to our correlation results. The COflux uncertainties are derived from the rms in the baseline-subtracted spectra in the vicinity of each CO line rather than from formal linefitting uncertainties. Then the fluxes are converted to L¢CO according to Solomon
et al.(1992).
2.2. Beam-matched FIR
As a starting point we took the entire-galaxy FIR luminosity (LFIR,e) from Sanders et al. (2003). Given the
mismatch between the dramatically varying FTS CO beam sizes and the physical extent of nearby galaxies (e.g., Galametz et al. 2013) and some merging/interacting (U) LIRGs(e.g., Gao & Solomon1999), we used a beam-scaling method based on the PACS imaging photometry9 to scale entire-galaxyLFIR,edown to the local region that matches the
CO beam size area (LFIR,b, for each CO line of each
bolometer). PACS bands span the peak of the spectral energy distribution (SED) of typical FIR-luminous local galaxies, and thus provide a good proxy for FIR and are insensitive to dust temperatures (Tdust).10 By performing photometry with an aperture of CO beam size (FPACS,b) and an aperture of
entire-galaxy, (FPACS,e), respectively, we can determine the
FIR luminosity that is appropriate to each CO beam size:
LFIR,b=FPACS,b FPACS,e´LFIR,e.
In this way we calculate a value ofLFIR,bfor each CO line.
This is essential for local galaxies that are partially resolved for FTS CO beam sizes (e.g., Bayet et al. 2009; Yang et al. 2013;G14; Zhang et al.2014).
3. RESULTS AND DISCUSSION
3.1. Correlations betweenL¢CO and Beam-matchedLFIR
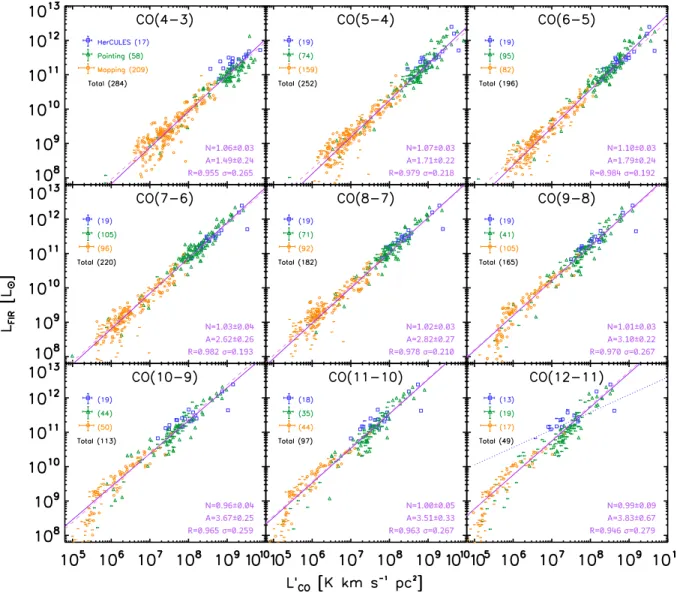
Figure1shows the 9 CO–FIR correlations of local galaxies and spatially resolved regions of nearby galaxies. FTS can observe CO(4–3) to CO(13–12), except for galaxies at
z>0.032 (mostly (U)LIRGs), whose CO(4–3) shift out of the FTS SLW waveband. Moreover, detections of CO(13–12) are sparse, and thus are not analyzed here.
To derive the slope and intercept, we fit all data points (excluding upper limits)with two linearfitting codes: an IDL
8
Figure 5.18 ofhttp://herschel.esac.esa.int/Docs/SPIRE/spire_handbook.pdf
9
All PACS data are updated to calibration 48 and post-processed with Scanamorphos v19.0(Roussel2013).
10
PACS bands: 70, 100, and 160μm. lpeak»290 mm Tdust, where
Tdust~20 30 K– for typical local SFGs.
least-squares fitting code based on MPFIT(Markwardt2009), and an IDL Bayesian regression code LINMIX_ERR (Kelly 2007). The two methods give consistent results, thus we only show the latter results in Figure1.
CO(4–3)has the largest number of detections, but the least dispersions are seen in the CO(6–5)and CO(7–6)panels(both withs=0.19 dex). This confirms the conclusion of Lu et al. (2014)that COJu~6 7– transitions are the best SFR tracers for (U)LIRGs.
For the entire sample, we find no evidence of a significant decrease in slopes with increasingJu:N ~1.0–1.1 atJu~4 6– ,
and 0.96–1.0 atJu~10 12– . Besides, thefittings are consistent with the average distribution of upper limits for non-detections in each transition.
Bayet et al.(2009)analyzed the IR beam corrections based on850 mm images and found correction factors similar to ours for galaxies we had in common. They found that IR beam corrections have only minor effects on the slopes (<5%)and
thus did not apply them, while in contrast we found that slopes without IR beam corrections are smaller by 10%–15%. This partially explains the discrepancy between our results and their decreasing slopes, i.e., N~1 at Ju~3, then N~0.8 at
Ju~7, andfinallyN=0.530.07 atJu=12.
In addition, small number statistics is another key factor behind the discrepancies between different studies. G14 presented the high-J CO–FIR correlation with HerCULES FTS data(Van der Werf et al.2010)and data from the literature of high-z submillimeter galaxies (SMGs). Their HerCULES sample contains 23 (U)LIRGs (excluding extended/merging galaxies). They evaluate IR beam correction with 870 or
350 mm maps, but the correction factors are small for their
local sample(mostly(U)LIRGs). They found correlation slopes
N~1.0 for 1 Ju5, which then decrease to
N=0.870.05 at Ju=7 and then rapidly become
N=0.510.11atJu=12.
For comparison, we divide our entire sample into three subsamples: a HerCULES subsample corresponding to theG14 local sample (mostly (U)LIRGs, excluding extended/merging ones), all other single-pointing data(mixed SFGs+(U)LIRGs), and all mapping data (nearby resolved SFGs, dominating the faint-end). Table1lists the best-fit slopeN, the interceptA, and the mean FIR/CO(A¯ =log(LFIR L¢CO))for the entire sample
and three subsamples. For the HerCULES subsample, similar toG14and Bayet et al.(2009), wefind decreasing slopes, e.g.,
N=0.650.31at CO(12–11). We overlay the significantly sub-linear CO(12–11)–FIR correlation of G14 (N=0.510.11) in the CO(12–11) panel of Figure 1 for reference.
Thus, with the largest high-JCO data set available to date, we conclude that within the luminosity range shown in Figure 1, L¢CO 7Ju9 closely and linearly follow LFIR
and by extension the SFRs, while all other 4Ju12 CO– FIR correlations are tight and not far from linear. These results are not in conflict with previous studies.
3.2. Average CO/FIR Spectral Line Energy Distribution(SLED)
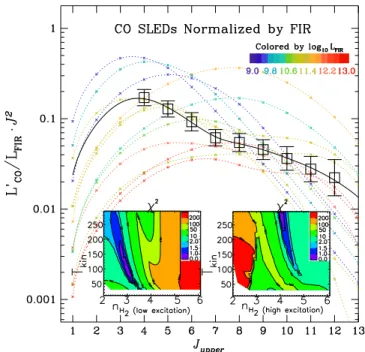
In Figure 2, we show a global FIR-normalized CO SLED, constructed from the products of the inversion of the best-fit FIR/CO normalization parameter for each transition(A¯, which is equal to LFIR L¢CO, given in Table 1) Ju
2
´ (where Ju2 is included to make the unit same as integrated line flux
Jy km s-1). Error bars are the dispersions of CO–FIR
correlations (theσshown in Figure1).
This CO SLED represents the average CO excitation conditions in local galaxies, and reveals at least two components: a low-excitation component peaking around
Ju~3 4– , and a higher-excitation component peaking around
Ju~8.
We used RADEX(Van der Tak et al.2007)to construct two-component LVG models and performed least-c2 fitting to
search for the best fits of gas kinetic temperature Tkin and
densitynH2, derivingTkin 90 40 K
100
~ -+ , n
log H 3.0 0.3cm
0.3 3
2~
-+
-for the lower-excitation component, and Tkin 200 K,
n
log H 4.1 0.2 cm
0.2 3
2~
-+ - for the higher-excitation component.
In Figure2, we also overlay the FIR-normalized CO SLEDs of a selection of galaxies that have at least six CO detections
and span a wideLFIRrange.(U)LIRGs/starbursts have stronger
high-JCO excitations and their normalized SLEDs areflatter at
Ju 6, whereas normal SFGs with weaker excitations show a bump at Ju~4 in their normalized SLEDs. Surprisingly, the largest difference between normalized SLEDs of(U)LIRGs and SFGs is seen not at a high-J(i.e.,Ju~10)but at a low-J(i.e.,
Ju~4), where the CO/FIR ratios vary within~1.5 dex. Since the low-excitation component dominates the low-J part of SLED, the large variation at a low-J indicates that low-excitation gas is less correlated with FIR, while the high-excitation component is intrinsically better correlated with FIR (see also Lu et al.2014).
Table 1
Best-fit Parameters of Beam-matched CO–FIR Correlations
(Sub)sample CO(4–3) CO(5–4) CO(6–5) CO(7–6) CO(8–7) CO(9–8) CO(10–9) CO(11–10) CO(12–11) Entire N=1.06±0.03 1.07±0.03 1.10±0.03 1.03±0.04 1.02±0.03 1.01±0.03 0.96±0.04 1.00±0.05 0.99±0.09
A=1.49±0.24 1.71±0.22 1.79±0.24 2.62±0.26 2.82±0.27 3.10±0.22 3.67±0.25 3.51±0.33 3.83±0.67
A¯=1.96±0.07 2.27±0.07 2.56±0.08 2.86±0.07 3.04±0.08 3.20±0.09 3.38±0.10 3.56±0.11 3.77±0.15
HerCULES N=0.75±0.62 1.08±0.43 0.98±0.29 0.84±0.35 0.81±0.24 0.81±0.26 0.73±0.25 0.76±0.26 0.65±0.31
A=4.46±0.57 1.67±3.89 2.78±2.61 4.18±3.06 4.68±2.04 4.80±0.21 5.56±0.02 5.49±0.02 6.58±0.00
A¯=2.20±0.23 2.40±0.21 2.61±0.21 2.85±0.21 3.08±0.21 3.28±0.22 3.42±0.22 3.65±0.23 3.90±0.28
Pointing N=1.00±0.10 1.10±0.09 1.06±0.09 1.05±0.08 1.09±0.11 1.02±0.11 0.93±0.09 1.05±0.12 1.12±0.18
A=1.96±0.88 1.43±0.79 2.09±0.79 2.51±0.65 2.34±0.92 3.02±0.84 3.88±0.70 3.12±0.91 2.73±1.36
A¯=1.93±0.13 2.30±0.12 2.62±0.11 2.89±0.11 3.02±0.13 3.18±0.16 3.34±0.16 3.51±0.18 3.65±0.24
Mapping N=1.17±0.10 1.13±0.09 1.11±0.10 0.96±0.08 0.94±0.08 1.17±0.12 1.12±0.18 1.03±0.17 0.66±0.42
A=0.64±0.71 1.29±0.67 1.78±0.74 3.08±0.56 3.44±0.56 2.14±0.77 2.68±1.14 3.40±1.04 5.99±0.00
A¯=1.93±0.08 2.22±0.10 2.47±0.13 2.82±0.12 3.04±0.12 3.19±0.12 3.40±0.17 3.58±0.18 3.81±0.29
Note.The best-fit CO—FIR correlations for the 9 transitions. Wefit the entire sample and three subsamples separately:G14HerCULES data, single-pointing data, and mapping data. Bothxandyerrors are considered. Upper limits are not considered in thefit.Nis the best-fit slope andAis the best-fit intercept from free-slopefitting.
A¯is the mean FIR/CO ratio(A¯=log(LFIR L¢CO)).
Figure 2.Average CO/FIR SLED(i.e., CO SLED normalized by FIR)for the entire sample, overlaid with several FIR-normalized CO SLEDs of individual galaxies spanning a wide range ofLFIR. The black open squares are the values of the average CO/FIR(i.e.,L¢CO LFIR´Ju2). The black solid curve is the best-fit two-component LVG model. The other dashed curves are the best-fit one- or two-component LVG models for individual galaxies. The colors indicate theirlg(LFIR). The two embedded panels are the least-c2fitting results of low-excitation gas(left)and high-excitation gas(right), respectively.
3.3. The CO(5–4)—FIR Correlation and Extension to High-z
To extend the high-J CO–FIR correlation toward higher-z, we use the extensive compilation of high-zCO data inCW13 that contains 60 CO Ju4 detections with literature LIR.11
They are the most extreme starbursts across all cosmic time, likely experiencing a short-term burst phase of SF resembling local ULIRGs, rather than the long-lasting mode in normal SFGs or the so-called“main-sequence”(MS)galaxies at high-z (e.g.,CW13).
COJu4observations toward high-zMS galaxies are still very rare: Daddi et al. (2015) presented the first CO(5–4) detections in a sample of 4 z~1.5 BzK-color-selected MS galaxies (BzKs). Thus combining all high-zJu4 data, CO (5–4) has the second-most detections but covers the most diverse galaxy types.
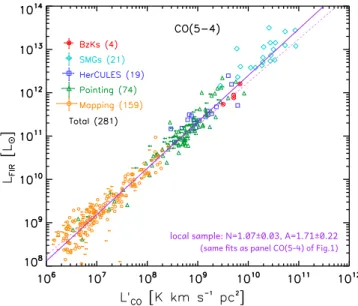
In Figure 3, we show the CO(5–4)—FIR correlation, including high-z galaxies as an example to illustrate the correlation between dense gas and SFR, as CO(5–4)traces a hundred times denser molecular gas than CO(1–0). We show the linear fits from Figure 1 only, as the inclusion of high-z SMGs and BzKs does not significantly change the results of the fit. The mean log(LFIR L¢CO 5 4( - ))=
L
2.270.07 (K km s-1pc2)-1
is consistent with Daddi et al. (2015) considering a conversion factor of 1/1.3 from TIR to FIR. BzK galaxies fall on the local linear best-fit correlation (dashed line), whereas high-z SMGs are offset above by~0.28 dex. Interestingly, using HCN(1–0)as a dense gas tracer, Gao et al. (2007)found higher FIR/HCN ratios in high-z galaxies (mostly QSOs/AGNs with only 5 HCN detections)than those of local ULIRGs/SFGs.
Given the large uncertainties in LFIR for a large fraction of SMGs12compared to BzKs(from SEDfitting), the amount of excess in FIR/CO(5–4) (i.e., dense gas SF efficiency)in SMGs should still be treated with caution. And this excess is not significant enough to break down a linear form of dense gas versus SF relation, as these starbursts are the most extreme systems at all redshifts and as such do not represent the dominant mode of SF observed in MS galaxies (e.g., BzKs). Thus, better FIR measurements, e.g., via SEDs, and additional high-J CO observations in normal MS galaxies are needed before making solid conclusions at high-z.
3.4. The CO(10–9)—FIR Correlation Extending to Galactic Young Stellar Objects (YSOs)
In Figure4we show the correlation between an even denser/ warmer gas tracer CO(10–9) and LFIR, which has the largest
number of observations of sources, spanning high-z galaxies (fromCW13 and ALMA Partnership et al. 2015) to galactic YSOs/protostars(from San José-García et al.2013).
ALMA Partnership et al.(2015)presented spatially resolved ALMA CO(10–9) in a strongly lensed SMG SDP.81 at z= 3.042, with demagnified LTIR=5.1´1012L, compar-able to the BzKs. We show the global SDP.81 as well as its east and west components in Figure4.
The best fit for all sources is N=1.040.01 and
A=3.040.06 (see also San José-García et al. 2013, who obtained the same N = 1.04 with only six galaxies); considering YSOs/protostars alone we get N=1.260.09, which is likely biased by the limited number of bright sources (Lbol»105L). Afixed-slopeN=1fit indicates that a mean
L L L
log( FIR ¢CO 10 9( - ))=3.300.09 (K km s-1pc2)-1 is valid for all sources withins~0.36 dex.
Figure 3. CO(5–4)–FIR correlation including high-z galaxies. The cyan diamonds are high-zgalaxies fromCW13. The crossed red circles arez~1.5
BzKs from Daddi et al.(2015). The other data points and the bestfit of the local sample are the same as the CO(5–4)panel of Figure1.
Figure 4.CO(10–9)–FIR correlation, including galactic YSOs/protostars(San José-García et al. 2013, red triangles), high-z SMGs/QSOs (CW13, cyan diamonds), and strongly lensed SMG SDP.81(global and two components; ALMA Partnership et al.2015, red crossed circles). The three data points of SDP.81 are: the west component, the east component, and global, from left to right, respectively. The solid line is a free-slopefit for all sources. The dashed line is a fixed-slope N = 1 fit, indicating a mean
L L
log( FIR ¢CO 10( -9))=3.300.09.
11
TheLFIRfor nine galaxies are derived from IR SEDs, a further 14 from FIR-radio correlation(Bothwellet al.2013;CW13), and the remaining 37 scaled from single-band850or1200 mm (CW13; Greve et al.2014). Where required we convertedLTIRtoLFIRby a factor of1 1.3.
12
For example, 850 mm -derived LFIR (usingCW13 conversion factor) are
3.5. Conclusions
We use Herschel SPIRE FTS observations of 167 local galaxies, including mapping data, to determine L¢CO J=4 3–
to12 11– , and derive corresponding beam-matched LFIR,b for
each CO line using PACS photometry. Wefind that these CO– FIR correlations are all linear, and that the non-linear result reported in G14 can be attributed to the comparatively small number of galaxies in their sample. The overall linearity suggests that a universal CO/FIR SLED exists among these galaxies, which further reveals two excitation states of gas. The high-excitation CO SLED peaks atJ~7, where the transitions are the best tracers of SFR(e.g., Lu et al.2014).
At high-z, however, SMGs/QSOs have elevated FIR/CO (5–4) ratios relative to those seen in local galaxies and contemporary BzKs: this is because they are the most extreme types of galaxies and hence are not representative of the typical SFG population.
A tight, linear correlation between CO(10–9)–FIR is shown to hold for the majority of local galaxies, resolved sub-kpc regions, Galactic YSOs, and also high-zgalaxies. These results strongly support a fundamental linear relationship between dense gas and the SFR, and also provide the local benchmark for probing the gas and SF in more types of galaxies(e.g., MS galaxies)at high-z.
This work is supported by NSFC#11173059,#11390373, #11420101002, and CAS #XDB09000000. D.L. gratefully thanks T. Greve, Z. Zhang, P. Papadopoulos, S. Madden, and R. Wu for constructive discussions, and K. Okumura and B. Altieri for helpful instructions on PACS.
REFERENCES
ALMA Partnership, Vlahakis, C., Hunter, T. R., et al. 2015,ApJL,808, L4
Aniano, G., Draine, B. T., Gordon, K. D., & Sandstrom, K. 2011, PASP,
123, 1218
Bayet, E., Gerin, M., Phillips, T. G., & Contursi, A. 2009, MNRAS,
399, 264
Bigiel, F., Leroy, A., Walter, F., et al. 2008,AJ,136, 2846
Bothwell, M., Smail, I., Chapman, S., et al. 2013,MNRAS,429, 3047
Carilli, C. L., & Walter, F. 2013,ARA&A,51, 105
Daddi, E., Dannerbauer, H., Liu, D., et al. 2015,A&A,577, A46
Daddi, E., Elbaz, D., Walter, F., et al. 2010,ApJL,714, L118
Galametz, M., Kennicutt, R. C., Calzetti, D., et al. 2013, MNRAS,
431, 1956
Gao, Y., Carilli, C. L., Solomon, P. M., & Vanden Bout, P. A. 2007,ApJL,
660, L93
Gao, Y., & Solomon, P. M. 1999,ApJL,512, L99
Gao, Y., & Solomon, P. M. 2004,ApJ,606, 271
Greve, T. R., Bertoldi, F., Smail, I., et al. 2005,MNRAS,359, 1165
Greve, T. R., Leonidaki, I., Xilouris, E. M., et al. 2014,ApJ,794, 142
Griffin, M. J., Abergel, A., Abreu, A., et al. 2010,A&A,518, L3
Iono, D., Wilson, C. D., Yun, M. S., et al. 2009,ApJ,695, 1537
Juneau, S., Narayanan, D. T., Moustakas, J., et al. 2009,ApJ,707, 1217
Kennicutt, R. C. 1998,ApJ,498, 541
Kennicutt, R. C., Jr., & Evans, N. J. 2012,ARA&A,50, 531
Krumholz, M. R., & McKee, C. F. 2005,ApJ,630, 250
Krumholz, M. R., & Thompson, T. A. 2007,ApJ,669, 289
Kelly, B. C. 2007,ApJ,665, 1489
Liu, L., & Gao, Y. 2012,ScChG,55, 347
Liu, L., Gao, Y., & Greve, T. R. 2015,ApJ,805, 31
Lu, N., Zhao, Y., Xu, C. K., et al. 2014,ApJL,787, L23
Mac Low, M. M., & Klessen, R. S. 2004,RvMP,76, 125
Mao, R., Schulz, A., Henkel, C., et al. 2010,ApJ,724, 1336
Markwardt, C. B. 2009, in ASP Conf. Ser. 411, Astronomical Data Analysis Software and Systems XVIII, ed. D. A. Bohlender, D. Durand, & P. Dowler (San Francisco, CA: ASP),251
Narayanan, D., Cox, T. J., Shirley, Y., et al. 2008,ApJ,684, 996
Naylor, D. A., Baluteau, J.-P., Barlow, M. J., et al. 2010,Proc. SPIE,7731, 773116
Ott, S. 2010, in ASP Conf. Ser. 434, Astronomical Data Analysis Software and Systems XIX, ed. Y. Mizumoto, K.-I. Morita, & M. Ohishi(San Francisco, CA: ASP),139
Papadopoulos, P. P., Van der Werf, P., Xilouris, E. M., et al. 2012,MNRAS,
426, 2601
Pineda, J. L., Langer, W. D., & Goldsmith, P. F. 2014,A&A,570, 121
Poglitsch, A., Waelkens, C., Geis, N., et al. 2010,A&A,518, L2
Rosenberg, M., van der Werf, P., Aalto, S., et al. 2015,ApJ,801, 72
Roussel, H. 2013,PASP,125, 1126
Sanders, D. B., Mazzarella, J. M., Kim, D. C., Surace, J. A., & Soifer, B. T. 2003,AJ,126, 1607
San José-García, I., Mottram, J. C., Kristensen, L. E., et al. 2013, A&A,
553, A125
Schruba, A. 2013,IAUS,292, 311
Solomon, P. M., Downes, D., & Radford, S. J. E. 1992,ApJL,398, L29
Springel, V., & Hernquist, L. 2003,MNRAS,339, 289
Van der Werf, P. P., Isaak, K. G., Meijerink, R., et al. 2010,A&A,518, L42
Van der Tak, F. S., Black, J. H., Schöier, F. L., et al. 2007,A&A,468, 627
Vogelsberger, M., Genel, S., Springel, V., et al. 2014,MNRAS,444, 1518
Wu, J., Evans, N., Gao, Y., et al. 2005,ApJ,635, L173
Wu, J., Evans, N., Shirley, Y. L., & Knez, C. 2010,ApJS,188, 313
Yang, C., Gao, Y., Omont, A., et al. 2013,ApJ,771, L24
Zhang, Z., Gao, Y., Henkel, C., et al. 2014,ApJ,784, L31
Zhao, Y., Lu, N., Xu, C. K., et al. 2013,ApJ,765, L13